Structural characteristics of tropical broadleaves stands under effect of conventional and low impact logging plot in truong son forest enterprise quang binh province
Bạn đang xem bản rút gọn của tài liệu. Xem và tải ngay bản đầy đủ của tài liệu tại đây (2.49 MB, 61 trang )
ACKNOWLEDGMENT
During months of conducting this working, I gained availed of encouragements
and assistance from many people without whom this thesis would have never been
conducted.
First and foremost, I would like to express my gratefulness to Dr. Nguyen Hong
Hai for constant support to each step of my thesis working, giving me motives and
enthusiasm as well as a wealth of knowledge. The guidance was really clear with vivid
images and detailed illustration, which facilitated me a lot in thesis project, in another
place, I would like to thank the Administration of Vietnam Forestry University,
Faculty of Forest Resources and Environmental Management, Department of
Environmental with sincere gratitude for enabling us all best to complete the
graduation thesis.
Also, I sincerely express my thankfulness to many local people and authorities,
both of whom untold assist me in collecting data and many other related procedures
Finally, I also thank my family and all my friends, partners for best effort me
the best facilitations to accomplish the thesis within expectations.
Thank you!
Xuan Mai, 2nd October 2019
Student
Nguyen Thi Hong Nhung
TABLE OF CONTENT
ACKNOWLEDGMENT .................................................................................... 1
TABLE OF CONTENT ..................................................................................... 2
LIST OF TABLES ............................................................................................. 4
LIST OF FIGURES ............................................................................................ 5
ABSTRACT ....................................................................................................... 1
CHAPTER 1 - INTRODUCTION ...................................................................... 2
1.1. Forest and forestry in the world ................................................................. 2
1.2. Forest and forestry in Viet Nam ................................................................ 2
1.3. Conventional Logging (CL) ...................................................................... 3
1.4. Low Impact Logging (LIL) ....................................................................... 3
1.5. Studying in Forest structure ...................................................................... 4
CHAPTER 2 - GOALS, OBJECTIVES AND METHODOLOGY ..................... 6
2.1. Goals ........................................................................................................... 6
2.2. Objectives.................................................................................................... 6
2.3. Methodology ............................................................................................... 6
2.3.1. Data collection.......................................................................................... 6
2.3.2. Data analysis ............................................................................................ 7
CHAPTER 3 - NATUAL AND SOCIO-ECONOMIC CONDITION OF THE
STUDY REGION ............................................................................................ 11
3.1. Natural condition ....................................................................................... 11
3.2. Socio-economical condition ...................................................................... 15
CHAPTER 4 - RESULTS AND DISCUSSIONS ............................................. 17
4.1 Forest stand properties ................................................................................ 17
4.1.1. Main characteristics of two forest stands ................................................ 17
4.1.2. Diameter distribution .............................................................................. 19
4.1.3. Characteristics of tree individuals at life stages ...................................... 20
4.2. Tree species composition ........................................................................... 21
4.2.1. Tree species composition of two plots .................................................... 22
4.2.2. Tree species compositions at life stages .................................................. 25
4.3. Species diversity ........................................................................................ 26
4.3.1. Species diversity in two plots ................................................................. 26
4.3.2. Species diversity at life stages in two plots ............................................. 27
4.4. Spatial distribution .................................................................................... 28
4.4.1. Distribution of trees by life stages .......................................................... 28
4.4.2. Spatial distribution of dominant tree species ........................................... 30
4.5. Some recommendations for sustainable forest management at Truong Son
Forest Enterprise. ............................................................................................. 33
4.5.1. Management solutions ........................................................................... 34
4.5.2. Policy solutions ..................................................................................... 34
4.5.3. Technical solution .................................................................................. 34
CHAPTER 5 – CONCLUSION ....................................................................... 36
5.1. Forest structure stand ................................................................................. 36
5.2. Species composition .................................................................................. 36
5.3. Species diversity ........................................................................................ 37
5.4. Spatial distribution .................................................................................... 37
5.5. Proposing management solutions............................................................... 38
REFERENCE
APPENDIX
LIST OF TABLES
Table 4.1. Structural characteristics of tree species in LIL plot......................... 17
Table 4.2. Structural characteristics of tree species in CL plot .......................... 18
Table 4.3. The most dominant tree species in LIL plot .................................... 22
Table 4.4. The most dominant tree species in CL plot ...................................... 23
Table 4.5. The most dominant tree species base on life stages in two plots ..... 25
Table 4.6. Summary of diversity measures for the two plots ............................ 27
Table 4.7. Summary of diversity measures for the study plots at life stage levels
......................................................................................................................... 28
LIST OF FIGURES
Figure 3.1 The location of the study site in Quang Binh Province .................... 12
Figure 3.2 Climate graph by month in Quang Ninh district, Quang Binh
province ........................................................................................................... 13
Figure 3.3 Average temperature Quang Ninh district, Quang Binh province .... 14
Figure 4.1 Frequency of tree individuals and tree DBH in LIL plot .................. 19
Figure 4.2 Frequency tree individuals and tree DBH in CL plot ....................... 20
Figure 4.3 Spatial distributions of life stages in LIL plot analyzed by the
Ripley’s L function........................................................................................... 28
Figure 4.4 Spatial distributions of life stages in CL plot analyzed by the Ripley’s
L function. ........................................................................................................ 29
Figure 4.5: Spatial distributions of seven dominant species in LIL plot analyzed
by the Ripley’s L function. ............................................................................... 31
Figure 4.6: Spatial distributions of seven dominant species in CL plot analyzed
by the Ripley’s L function. ............................................................................... 33
ABSTRACT
This study has aimed to show some structural characteristics of tropical
broadleaves that stands under the effect of conventional and low impact logging in
Truong Son Forest Enterprise, Quang Binh Province. A total of 2 plots of 100m x
50m each placed in two forest states were surveyed species name, diameter, height,
relative coordinates. We calculated and described structural parameters such as DBH
dominance and species index, tree density, frequency distribution, and tree diameter
and height data by Paleontological Statistics and Microsoft Excel softwares. The
results show that: most of studied species were found highly mixed with other species.
The number of trees per life stages and density of the forest state conventional logging
concentrated on all diameter levels form sapling, juvenile, and adult, suggesting that
this forested state will focus on all trees of economic value in Truong Son Forest
Enterprise, while in the low impact logging concentrated mostly on diameter of more
than 30 cm to keep the immature seedlings alive for future crops. The number of trees
in each life stage is inversely proportional to each other, the number of individuals
decreases when the diameter becomes larger. Species composition were very seriously
affected because number of species in the life stage all changed. The most important
species found in both two forest states were G.pierrei, T.javanica, L. glutinosa, B.
tonkinensis, P. cerasoides. About spatial distribution of two plot mainly clustered
distribution but some species that are completely randomly distributed without the
cluster distribution like G. pierrei. The spatial structural parameter offers direct
information and valuable about spatial structure of forest stand. That information can
be used in thinning of sustainable forest management, modeling and restoration.
Key words: Forest enterprise, forest stand properties, LIL plot, CL plot,
tropical broadleaves, tree species composition, tree species diversity, spatial
distribution.
1
CHAPTER 1 - INTRODUCTION
1.1.
Forest and forestry in the world
Geographically, tropical rain forests are currently found in Southeast Asia,
Central and South America, and Central and West Africa (Richards, 1996; Whitemore,
1998), with Southeast Asia containing the second largest tropical rain forest with an
area of about 2.5 million km2 (Whitemore, 1998). Globally, around 52% of the total
forests are in tropical regions and they are known to be the most important areas in
terms of biodiversity (Lewis et al., 2009) Tropical forests play a crucial role in three
respects regarding the well-being of mankind. Tropical forests provide many goods
and ecosystem services, such as prevention of soil erosion and preservation of habitats
for plants and animals (Anbarashan M. and Parthasarathy N., 2013).
Socially, millions of people who are living in or around tropical forests depend
on them for the many forest products and environmental services gained (NaughtonTreves and Weber, 2001). Economically, they possess a main source of energy in the
form of fuel wood, wood, and traditional medicines: they also provide timber and nontimber forest products. It is therefore essential to understand the structures and species
diversity of tropical forests in order to find a way to maintain, protect, and develop
those ecosystems, Biotic factors such as seed quality, seedling survivorship, and
recruitment are important in maintaining the tree composition of tropical forests
(Connell 1971). Overexploitation has resulted in the rapid loss of forests and is
recognized to be one of the biggest environmental and economic problems around the
world (Mani and Parthasarathy 2006). The natural forest is disappearing at alarming
rates worldwide, reducing annually by 1–4% of their current area (Laurance 1999).
Relatively increased anthropogenic pressures have led to agricultural expansion and
overgrazing of livestock (Anitha et al 2010).
1.2.
Forest and forestry in Viet Nam
Forest vegetation in Vietnam is diverse as a result of different climatic conditions
and topographic/latitudinal variations (Thai, 1978; USAID, 2013). Vietnam has at
present 13.7 million hectares of forest covering 41.45 % of its total land area; of these,
10.4 million hectares (75.2 % ) are natural forests (FPD, 2013) with 4.15 million ha is
production forest and State Forest Enterprises (SFE) manage that can be classified
2
into eight major forest groups: close-mixed evergreen broad-leaved rainforest, semideciduous mixed forest; mixed limestone forest; coniferous and mixed coniferous
broad- leaved forest; sparse forest, seasonal deciduous forest and Dipterocarpsdominant forest; mangrove forest; Melaleuca forest (i.e., forest on alum land); and
bamboo and mixed timber-bamboo forest. As it is the case concerning other tropical
forests, Vietnam's forests are high in diversity, and up to hundreds of different tree
species can be found within one hectare (Whitmore, 1990; Richards, 1996). The result
is a high level of biomass and productivity (Vanclay, 199la: Le, 1996; Sam, 2004;
Gunter et al.,2011).
1.3.
Conventional Logging (CL)
CL is a term used to identify methods commonly used in an area to move logs
from stump to mill. (By U. S. Forest Service). It brings the highest economic
efficiency but causes serious impacts on forest structure such as large areas of forests
are often destroyed in order to remove the few selected logs. One felled tree also often
brings down other trees with it by falling into them on its way to the ground. This
creates large holes in the canopy which impacts the habitat in many ways and
complete regeneration of this gap can take hundreds of years, if it is able to regenerate
at all. These gaps break habitats into smaller fragments, referred to as fragmentation,
which threatens many species with endangerment or extinction.
1.4.
Low Impact Logging (LIL)
LIL is considered better practice than clear-cutting (Gatti et al., 2014). It is
increasingly being accepted as an approach to protecting forest integrity and enabling
the proper use of resources. This silvicultural technique is widely used because the
growers want to keep the immature seedlings alive for future crops. In other words,
after the law impact logging, the rest retained the main structural elements of the forest
as well as the various ecological niches an of pre-harvested values (Nzogang, 2009).
Damage caused by LIL plot (LIL) was assessed in 18 plots 1 ha each in a terra
firm rain forest of Eastern Amazon (Brazil, Paragominas). Mean logging intensity was
6 trees ha−1 and the resulting commercial volume 21 m³ ha−1. On average, logging
damage affected 16% of the original stand while skid trails occupied 7% (661 m² ha−1)
of forest soil area. Canopy openness doubled to a mean of 11%. Of the variables
3
studied, “number of trees harvested or felled per plot” gave the best correlation to
“proportion of damaged or destroyed trees”. Damage to each diameter class was
distributed in accordance with relative abundance of trees (DBH ≥ 20 cm) in the
original population before logging, suggesting that all diameter classes were affected
equally (P Sist, FN Ferreira, 2007). Tree injury and death from RIL in contrast, was
substantially lower (30.5%) than from conventional methods (48.1%) (JG Bertault, P
Sist, 1997).
1.5.
Studying in Forest structure
However, the majority of researching tropical forests in developing countries are
still limited, consequently, the stand structures and species diversity of those forests
are often insufficient for management. Sustainable management of these forests
requires a good knowledge of all the natural forest resource; this knowledge could be
reliable only through studies of the forest environment (Hien Thu Thi Cao, Hong Hai
Nguyen, 2019).
Forest structure plays an important role in forestry research. Forest structure
greatly impacts the habitat of fauna and flora species. Complex forest structures
diversity microclimates, niches and habitats for maintaining the majority of terrestrial
biodiversity. Forest structure is the key to understanding and determining ecosystem
functions. The structure and distribution of forest patches regulates habitat structure,
wildlife distribution and determines the delivery of ecosystem services. In other words,
the structure directly affects the biodiversity, erosion control, water availability and
carbon storage functions of the forest. Changing forest structure leads to changes in
carbon stocks and evapotranspiration. Indicators of forest structure are also a
component that should be considered for sustainable forest management. Species
diversity can be influenced by tree diameter distributions. Forest structure
classifications can be practical and meaningful for ecological assessment and
monitoring (Hung Manh Bui, 2018)
Species diversity, species richness, and biodiversity are widely used terms in
ecology and natural resource management. In general, the species diversity of a
community is made up of two components: species richness (or the number of species
present) and the evenness, species equitability species (Pielou, 1966; Patil and Rao,
4
1994), or abundance of each Hamilton (2005) reports that there have been two
approaches to measuring species diversity: the first involves constructing
mathematical indices broadly known as diversity indices, and the second requires
comparing observed patterns of species abundance to theoretical species abundance
models. Species diversity indices take two aspects of the community into account:
species richness and evenness (Hamilton, 2005). In this study, species richness, the
Shannon-Wiener the Simpson indices, and the diversity profile are computed to
evaluate and compare the diversity of tree species in the for study sites. (Hien Thu Thi
Cao, 2016)
A diversity index is a quantitative measure that reflects how many different
types (such as species) there are in a dataset, and simultaneously takes into account
how evenly the basic entities (such as individuals) are distributed among those types.
The value of a diversity index increases both when the number of types increases and
when evenness increases. For a given number of types, the value of a diversity index is
maximized when all types are equally abundant. When diversity indices are used in
ecology, the types of interest are usually species, but they can also be other categories,
such as genera, families, functional types or haplotypes. The entities of interest are
usually individual plants or animals, and the measure of abundance can be, for
example, number of individuals, biomass or coverage. In demography, the entities of
interest can be people, and the types of interest various demographic groups. In
information science, the entities can be characters and the types the different letters of
the alphabet. The most commonly used diversity indices are simple transformations of
the effective number of types (also known as 'true diversity'), but each diversity index
can also be interpreted in its own right as a measure corresponding to some real
phenomenon (but a different one for each diversity index). (Source: Google scholar).
5
CHAPTER 2 - GOALS, OBJECTIVES AND METHODOLOGY
2.1. Goals
In order to provide a scientific basic for proposing solutions to sustainable
managing natural forest in general and natural tropical broadleaf in Truong Son Forest
Enterprise, Quang Binh province in particular, it is necessary to study: “Structural
characteristics of tropical broadleaves stands under effect of conventional and
low impact logging plot in Truong Son Forest Enterprise, Quang Binh Province”.
To study effect of conventional and low impact logging plot on structural
characteristics of tropical broadleaves stands
2.2 . Objectives
1) Investigating effects of selective logging on species composition, diversity and
forest structure properties of moist evergreen forest;
2) Investigating effects of selective logging on life-stage distribution and dominant
species distribution;
3) Proposing some recommendations about silvicultural treatments for sustainable
forest management at Truong Son Forest Enterprise.
2.3. Methodology
2.3.1. Data collection
Two 0.5-ha study plots (100 m x 50 m) were established in Truong Son Forest
enterprise, Quang Binh province, North-Central Vietnam. In this region, forests were
cut under different regimes such as conventional and reduced impact logging before
2010. Here, reduced impact logging was applied to meet requirements of Sustainable
Forest management certification. Elevation of the plots ranges from 134 to 160 m a.s.l,
with an average slope of 25 degrees.
Forests in these two plots have less human disturbance and representatives of
tropical broadleaves forests in Truong Son Forestry Enterprise according to field
surveys.
1)
All live trees with diameter at breast height (dbh) ≥ 2.5 cm were mapped, tree
positions and their characteristics (species and dbh) recorded. If trees were multistemmed, each stem was considered a separate tree if the branching occur below breast
height (1.3 m). The relative coordinates (x, y) of each tree were recorded via a grid
6
system of subplots (10 m × 10 m) by using a laser distance measurer (Leica Disto D5)
and compass. All tree individuals were then classified into life stages with Sapling
(dbh < 10 cm), Juvenile (dbh=10 – 30 cm), Adult (dbh >= 30 cm).
Data were authorized by Dr. Nguyen Hong Hai from his research project number
106-NN.06-2016.22
2.3.2. Data analysis
2.3.2.1. Forest stand properties
Several general information on forest structural we computed for each sample
plot, including: Number of tree per plot, DBH, volume and stem density per hectare,
mean total tree height, total basal area, number of tree species, number of families
where DBH is diameter at breast height, basal area is the number of units of basal area
per acre (or per hectare) represented by each tree, and density is total number of
individual in sample plot area.
+ DBH (cm) = perimeter/3.14
+ Basal area (g, m2) = 2*3.14(DBH/2)²= 0.00007854*DBH²
+ Volume (m3) = Basal area * height * form factor
= g*h*f
Where: g is basal area; h is height; f is actual stem volume or volume of a
cylinder over reference diameter (f = 0.45 for natural forest, f = 0.5 for plantation).
+ Density:
=
x 10.000
Where: n is total number of individuals in sample plot
S is sample plot area.
Frequency distributions: In the present study Microsoft Excel is used to draw
frequency graph of number of individual according to DBH classes.
2.3.2.2. Tree species composition
We quantified importance value index (IVI) for each species, relative density
and relative basal area following Curtis and Cottam (1956) where Important Value
Index (IVI%) is a measure of how dominant a species is in a given forest area,
Relative density (RD) is the number of individuals per area as a percent of the number
7
of individuals of all species, Relative basal area (RBA) is the total basal area of a
species as a percent of the total basal area of all species.
Relative density (N %)
=
×100
Relative basal area (G %) =
Important Value (IVI %)
=
=
According to Daniel Marmillod, the IVI % varies from 0% to 100%. The larger
the importance value is the more important a species is within one particular
community. Trees with IVI%
are important species. On the other hand,
according Thai Van Trung (1970) in a forest stand, the tree species groups occupy
50% of individual’s total of upper tree layer that is considered dominant species
groups.
Formula of structure composition: IV_spA + IV_spB + IV_spC +...
Where sp A is the name of tree species.
Microsoft Excel software is used to summary statistics.
2.3.2.3. Species diversity
The following diversity indices were used in this study.
Simpson index (D): a measure of species dominance. The Simpson index is defined as
(magurran, 1988):
D = 1− ∑
Where:
is the proportion of importance value of the
is the number of tree of
species.
species and N is the number of trees of all species.
As biodiversity increases, the Simpson indexes decrease.
Shannon diversity index (H’): as a measure of species abundance and richness to
quantify diversity of the tree species. This index takes both species abundance and
species richness into account:
∑
8
Where : s equals the number of species and pi equals the ration of individuals of
species i divided by all individuals N of all species the Shannon diversity index ranges
typically from 1.5 to 3.5 and rarely reaches 4.5 ( W.L Gaines et al., 1999).
Species evenness (J’): refers to how close in numbers each species in an environment
is mathematically it is defined as a diversity index, a measure of biodiversity which
quantifies how equal the community is numerically. We used Pielou’s evenness index
(Magurran, 1988):
J’=
Where H is the number derived from the Shannon diversity index and
is the
maximum possible value of (it every species was equally likely), equal to :
= −∑
J’ is constrained between 0 and 1. The less evenness in communities between the
species (and the presence of a dominant species), the lower J’ is, and vice versa.
All diversity indices are calculated by using PAST (Paleontological Statistics)
software version 3.20 and Microsoft Excel.
2.3.2.4. Spatial distribution
Structural and spatial patterns of forest trees important indicators to explain
which are processes govern the composition and association in species communities
(Wiegand et al. 2007). Based on spatial arrangement of individuals, ecological
hypotheses generated assuming to can be possible underlying processes controlling the
observed structure (Wiegand & Moloney 2004). Several ecological processes or
mechanisms have been Several proposed explaining species coexistence and
community structure, such as neutral theory, competition or facilitation, dispersal
limitation, habitat preference and the Janzen Connell hypothesis.
The Ripley’s K-function is the expected number of points in a circle of radius r
around an arbitrary point, divided by the intensity λ of the pattern (Ripley 1976). Thus,
Ripley’s K is cumulative up to distance r meaning that point intensity is calculated
within entire circle with radius r.
∫
9
λK(r) is the mean number of points within a distance r from an arbitrary point,
particularly K(r) = πr2 for a homogeneous Poisson process. Let L(r) = (K(r)/π)0.5 - r, r
≥ 0; thus L(r) = 0 for a homogeneous Poisson process; i.e., a straight line with slope 0
(Mateu 2000). Under Complete Spatial Randomness , L(r) = 0, under aggregation
L(r)> 0 and under regularity L(r) < 0.
The spatial distributions of forest trees based on life stage and followed the
dominant tree species are calculated using PAST (Paleontological Statistics) software
version 3.20.
10
CHAPTER 3 - NATUAL AND SOCIO-ECONOMIC CONDITION
OF THE STUDY REGION
3.1. Natural condition
Quang Binh province belongs to the North Central area of the country. The
province is bordered with Ha Tinh province to the north, with Quang Tri Province to
the south, with Laos to the west and with the East Sea to the east. The natural area of
Quang Binh is 9,065.27 km². The province has a pretty narrow and steep topography
from west to east. While 85% of the total area is mountains, there are also other types
of terrain such as hills, valleys, highlands, plains, etc. Quang Binh has a total area of
647,794.61 ha, of which 480,211.73 ha of natural forest, 59,778.96 ha of planted
forest, 107,803.92 ha of non-forested land (Quang Binh Provincial Forest Protection
Department, 2016). However, the management, protection, and development of forests
are still limited and weak. The situation of deforestation, forest land encroachment,
illegal exploitation of forest products, especially for natural forests continues to be
complicated; the area of protected forests has been continuously decreasing over the
years. Planning, protection, and development of forests are incompatible with land use
planning and socio-economic development planning. Many economic development
projects such as hydropower, mineral exploitation, and tourism services ... have not
focused on forest protection and development, especially natural forests.
Geography
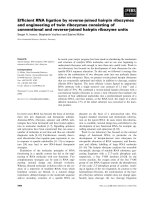
The study was carried out within the tropical broadleaves forest belonging to the
Truong Son Forestry Enterprise. The zone of study covers a total of 26,490.13 ha
natural forest. It lies between 17º10’00” and 17º40’00” N of northern latitude and
between 106º00’00” and 107º00’00” E of longitude. The North bordering with Phong
Nha-Ke Bang National Park, Bo Trach, and Bong Lai Forest Enterprise. The South
bordering with Dong Chau protective forest management broad and Quang Tri
province. The East bordering with Ho Chi Minh Highway and the West bordering with
Lao People's Democratic Republic and Phong Nha-Ke Bang National Park.
11
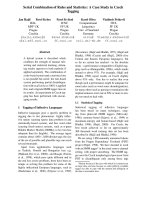
Figure 3.1 The location of the study site in Quang Binh Province
Truong Son Forest Enterprise is located on the Co Trang River in the upper part of
the Long Dai River and upstream of the Dinh River, with a river network spread over
the region. The streams are characterized by short and steep, narrow, many rapids.
Mountains can be divided into two areas as follows:
Mountain Land: accounts for 64,6% of the area, including medium and low
mountains, which are distributed mostly as natural forest land. This region consists of
many high ranges from 400 to 600 m, an average slope of 25°. In this type of
topography, most of the area is the natural forest; this is the area with the largest forest
resources of Truong Son SFE in particular and Long Dai Company in general.
Rocky Mountain: concentrated in the south and southwest of the forestry
enterprise. The terrain here is quite complicated, including many high slope heights
mixed with narrow valleys.
12
Weather
Truong Son Forest Enterprise belongs to the tropical monsoon zone. The annual
climate is divided into two distinct seasons: a dry season from March to August, rainy
seasons from September to February. This study site has a tropical climate. Rainfall is
significant most months of the year, and the short dry season has little effect. The
Köppen-Geiger climate classification is Am. The average temperature in Truong Son
is 25.4 °C. The rainfall here averages 2196 mm. (Figure.2)
Figure 3.2 Climate graph by month in Quang Ninh district, Quang Binh province
(Source: en.climate-data.org)
Annual rainfall is between 2500 and 3000 mm. The average number of rainy
days is about 152 days/year. The least amount of rainfall occurs in March. The average
in this month is 51 mm. Most of the precipitation here falls in October, averaging 559
mm. Rainfall is distributed unevenly in the year, mainly in October and November,
accounting for 60 –70% of the total annual rainfall. The average humidity is 86%,
lowest humidity is 70% when there is Southwest monsoon. In the study area effect by
two types of monsoon. The Northeast monsoon form October to March and Southwest
monsoon from April to September. The average wind speed is 2-4 m/s.
13
The temperatures are highest on average in June, at around 30.4°C. January is
the coldest month, with temperatures averaging 19.7°C, increasing from North to
South and decreasing from East to West. (Figure.3)
Figure 3.3 Average temperature Quang Ninh district, Quang Binh province
(Source: en.climate-data.org)
Soil
In the study area, soil can be divided into two main groups:
The lowland ferralitic soils develop on granite, sandstone, shale, and limestone;
The mountainous humus soils develop on granite, limestone.
In general, the soil in the area has the thickness of the soil layer from thin to medium
(30-80 cm), the average humus content. Particularly, low-mountain ferralitic soil
groups develop on clay stone, sandstone of thick soil layer (> 80 cm). The land in the
Forestry Enterprise is mainly formed by ferralitic process, with the material of clay
and granite. In addition, there are also slope soil, humus in limestone valleys and
alluvial soil along rivers and streams.
14
Forest resources
The forests of Long Dai are bordered with Phong Nha – Ke Bang NP and Laos
PDR, many ethnic minority communities (under the Van Kieu ethnic group) settled
their inhabited sites in the forests of Long Dai with their livelihoods depended on the
natural resources of the surrounding areas. The total forest area managed by the
company is 91,834.15 ha, of which the production forest is 82,058.85 ha and the
protection forest is 9,775.30 ha. The ethnic communities are still keeping their living
culture by their daily customary practices in the forest areas using the forest.
Therefore, the forest of Long Dai, particular those are located in Truong Son is
strongly considered as the foundation for the preservation and development of cultural
values of ethnic minority people. Furthermore, there was a very dense distribution of
Ho Chi Minh trails during wartime, where became national historical relicts, forests of
Long Dai are not only significant to the social values.
Flora of Truong Son Forest Enterprise has 663 species of 131 families and 480
genera of vascular plant phylum: Lycopodiophyta, Polypodiophyta, Pinophyta
(Gymnospermae), Magnoliophyta ( Angiospermae) (Source: Report on Flora Survey of
Truong Son Forest Company in Quang Binh by Vu Anh Tai, Ho Van Cu).
Fauna has 65 species of mammals, 162 species of birds, 53 species of reptiles
(Source: Introduction of Long Dai forest company and Truong Son forest enterprise).
There are many rare and endangered species recorded in the Truong Son natural
forests such as 27 plant species in the Forest Company, gaur, dhole (Cuon alpinus),
turtles, and primate species.
3.2. Socio-economical condition
The total number of households is 4,537 with a total of people is 14,912. There
are 2 ethnic groups living in the area: Kinh and Van Kieu ethnic groups, in which:
Kinh ethnic group have about 11,763 peoples, accounting for 78.8% of all peoples of
the region; Van Kieu ethnic group have about 3,149 peoples, accounting for 21.2% of
all peoples of the region. Total employees are 9,551 people, of which: 5.386 people for
Men, accounting for 56%; 4,165 women, accounting for 44%.
The condition of the terrain is divided greatly, there are many stream systems,
the climate is divided into 2 distinct rainy and sunny seasons and greatly influences
15
production and business activities. Especially in the rainy season, there are often
heavy storms and prolonged drought seasons.
Therefore, when developing a
production plan, it is necessary to select the plant species and arrange appropriate time
and place to avoid the negative effects of natural conditions. The area is mountainous,
highland, low educational level, poor life and many backward customs and practices
still exist. Although infrastructure has been invested by the state much more than
before, it is still poor compared to the social level, especially in some remote villages.
Local communities lack enough for agricultural production, food for daily life,
putting great pressure on natural forests. The idle labor force in the local community is
quite abundant, in which some labor sections do not take pains to work in production
but mainly rely on forests, which causes pressure on management and protection.
Forest protection in the study area. (Hai Truong Nguyen, 2017).
16
CHAPTER 4 - RESULTS AND DISCUSSIONS
4.1 Forest stand properties
4.1.1. Main characteristics of two forest stands
The results of the study synthesized statistics on species density, diameter, average
height of forest stands, and determine total basal area and volume of two plot stands
was shown in Table 4.1.
Table 4.1. Structural characteristics of tree species in LIL plot
No.
Species
N
DBH (cm)
H (m)
G (m²)
V (m³)
1 Endosperrmun sinensis
25 22.66 ± 9.06 15.24 ± 5.37
1.2663
10.542
2 Engelhardtia roxburghiana
26 32.06 ± 9.12 20.19 ± 5.32
2.3937
23.243
3 Symplocos laurina
42 14.58 ± 9.07 13.63 ± 5.32
0.9122
7.7061
4 Garuga pierrei
55 11.63 ± 9.10
8.34 ± 5.29
1.507
13.168
5 Litsea glutinosa
76
7.83 ±9.06
7.23 ± 5.28
0.5735
3.0213
6 Bursera tonkinensis
88
6.47 ± 9.09
5.18 ± 5.30
0.4153
1.6479
7 Tarrietia javanica
172
3.89 ± 9.04
4.00 ± 5.28
0.2713
1.0923
8 Other species
685 15.96 ± 9.05
6.23 ± 5.25
6.3497
46.601
7.35 ± 5.27
14.389
107.02
Grand Total
1124
9.02 ± 9.03
A total of 2079 individual trees representing 61 species were identified from two
plots. The density of the LIL plot was 1124 trees (2248 trees/ha) and conventional
impact was 955 trees (1910 trees/ha). The number of tree species of the LIL plot
varied from 43 species, and this number of CL plot was 50 species. The mean
diameter and height of LIL plot were 9.02 cm – 9.03 cm, 7.35 m – 5.27 m,
respectively, and these values for the CL plot were 8.86 cm – 8.61 cm, 7.19 m – 4.18
m. The total volume of the LIL plot was 107.02 m³ (214.04 m³/ha), whereas these
numbers of CL plot was 82.45 m³ (164.9 m³/ha). The total basal area of LIL plot was
17
14.38 m² (28.76 m²/ha) , whereas these numbers of CL plot was 11.45 m² (22.9
m²/ha).
Table 4.2. Structural characteristics of tree species in CL plot
No.
1
Species
Erythrophfloeum
N
H (m)
G (m²)
V (m³)
18.06 ± 8.66
12.23 ± 4.88
0.9218
8.5243
2 Ormosia balansae
40 15.57 ± 8.83
12.23 ± 4.89
1.1491
9.3136
3 Canarium album
48 13.56 ± 8.59
10.14 ± 4.82
1.0066
7.0379
4 Garuga pierrei
54
12.4 ± 8.85
8.62 ± 4.87
1.4439
12.379
5 Paviesia annamensis
65
8.89 ± 8.66
7.82 ± 4.88
0.7079
4.3367
6 Tarrietia javanica
71
5.56 ± 8.63
5.66 ± 4.82
0.3378
2.5372
7 Mallotus paniculatus
90
4.02 ± 8.63
4.72 ± 4.86
0.1202
0.2702
91
5.50 ± 8.61
4.12 ± 4.85
0.2505
0.6322
9 Other species
475
8.57 ± 8.87
6.78 ± 4.87
5.5209
37.429
Grand total
955
8.86 ± 8.61
7.19 ± 4.18
11.459
82.46
8
fordii
Polyalthia
cerasoides
21
DBH (cm)
The number of tree species of the logging is often higher than that of LIL plot
but is not significant. However, the density of trees per hectare of LIL plot is much
higher than CL plot was 169 trees/ha, and the total volume and basal area of LIL plot
were also higher. This shows that LIL plot should be less affected by logging; the
number of trees in LIL plot was ensured quality because this logging had a selection
of trees and a reduction of impact on sapling and juvenile. According to the circular
34/2009/TT-BNN&PTNT, if standing total volume is under 100 m³ so the type of
forest statue is poor forest (CL plot), and total volume form 101 - 200 m³ belongs to
the forest statue is medium forest (LIL plot).
18
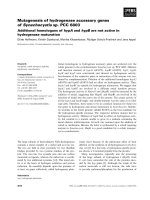
4.1.2. Diameter distribution
The frequency distribution of the tree diameter of the two forest stands was
reverse J-shape (Figure 4.1). The higher numbers of the trees were in the smaller
diameter classes. In other words, there was a decline in the number of stems with
increasing size class.
600
500
Number of individuals
400
300
200
100
0
5
10
15
20
25
30
35
40 45 50 55
DBH class (cm)
60
65
70
75
80 More
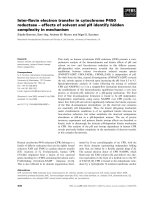
Figure 4.1 Frequency of tree individuals and tree DBH in LIL plot
There was virtually no difference in the frequency distributions of the diameter
between two forest states (Figure 4.1 and 4.2).
In LIL plot, the majority of stems were concentrated in the first DBH class (5
cm), which accounted for 500 stems in 0.5 hectare. Tree with a DBH greater than 80
cm was only found in the LIL plot forest (Figure 4.1)
In CL plot, the majority of stems were concentrated in the first DBH class (5
cm), which accounted for 420 stems in 0.5 hectare. Tree with a DBH was 70 cm less
than LIL plot (Figure 4.2)
19
450
400
Number of individuals
350
300
250
200
150
100
50
0
5
10
15
20
25
30
35
40
45
DBH class (cm)
50
55
60
65
70
More
Figure 4.2 Frequency tree individuals and tree DBH in CL plot
In general, those distributions were all skewed to the left of the diagram, with
the total number of stems dramatically declining with the ascending DBH classes,
suggesting that small size trees dominate the stand (which in turn indicates good
regeneration).
4.1.3. Characteristics of tree individuals at life stages
In the forest state after LIL plot, the number of trees per hectare gathers most
highly on sapling were 825 trees (1650 trees/ha). The total volume and basal area of
sapling were 4.7 m³ (10.4 m³/ha), 1.75 m² (3.5 m²/ha), respectively (Table 4,
appendix). The number of dominant tree species in the sapling with 6 out of 39 tree
species, they are T. javanica, B.
tonkinensis, P. cerasoides, P. annamensis, L.
glutinosa, G. pierrei.The number of trees per hectare was 242 trees (484 trees/ha). The
total volume and basal area of the juvenile were 37.16 m³ (74.32 m³/ha) and 5.56 m²
(11.12 m²/ha), respectively (Table 4, appendix). The number of dominant tree species
in the juvenile 6 out of 32 species, including S. laurina, C. bejolghota, O. balansae, C.
album, L. glutinosa, E. sinensis. The number of trees per hectare gathers lowest on
20