Tài liệu UNDERSTANDING STOCKS PART 3 pdf
Bạn đang xem bản rút gọn của tài liệu. Xem và tải ngay bản đầy đủ của tài liệu tại đây (482.64 KB, 60 trang )
PART THREE
FINDING
STOCKS TO BUY
AND SELL
10381_Sincere_03.c 7/18/03 10:58 AM Page 87
Copyright © 2004 by The McGraw-Hill Companies, Inc. Click here for Terms of Use.
This page intentionally left blank.
9
89
It’s Really
Fundamental:
Introduction to
Fundamental Analysis
The two main methods that people use to pick stocks are fundamental
analysis and technical analysis. Fundamental analysis is the study of
the underlying data that affect a corporation. Technical analysis, on the
other hand, is the study of a stock’s price.
Some of you may find that fundamental analysis is all you need in
order to be a successful investor. After all, understanding and applying
fundamental stock analysis helped make billionaire investor Warren
Buffett a very rich man. In addition, successful mutual fund managers,
such as Peter Lynch, Robert Rodriguez, and William Miller, to name a
few, have also used fundamental analysis to find stocks in high-quality
companies at bargain prices. If you want to learn about the stock mar-
ket, you must have at least a basic understanding of fundamental analy-
sis. It is worth your time to study it.
CHAPTER
10381_Sincere_03.c 7/18/03 10:58 AM Page 89
Copyright © 2004 by The McGraw-Hill Companies, Inc. Click here for Terms of Use.
Fundamental Analysis: An Overview
When you buy a stock on the basis of fundamental analysis, you are not
simply buying a piece of paper; rather, you are buying a piece of a cor-
poration. If you’re going to buy a stock, you should find out as much as
you can about the corporation. This is the essence of fundamental
analysis: You study the corporation to decide whether it is a worthwhile
investment.
This includes looking at a number of factors, including the com-
pany’s assets and liabilities, its earnings, the managers who are running
the company, the competition, the kind of business the company is in,
and the amount of debt it has. (You can find many of these items in the
balance sheet, a brief financial report of the corporation that will be
discussed shortly.) By using fundamental analysis, you should be able
to pick out stocks that offer you the best chance for profits. You want to
buy a stock whose price is reasonable when compared with its earn-
ings—what fundamental analysts call “fair value.”
You should know that fundamental analysis is one of the most popu-
lar methods of determining whether a stock is a good bargain or is better
left alone. If you have done your homework and closely studied all as-
pects of a corporation, you should be rewarded with a higher stock price.
Nevertheless, fundamental analysis is merely a tool to help you
find and evaluate which stocks offer good value. Like anything related
to the stock market, this method is more art than science. Just because
you use fundamental analysis doesn’t mean that you’ll make a lot of
money in the market. The more methods you learn, however, the better.
This will also give you a chance to determine whether fundamental
analysis is right for you.
The Concepts behind Fundamental Analysis
Learn Everything You Can about the Industry
The first thing an investor has to determine when engaging in funda-
mental analysis is what industry to look at. If we are in the middle of a
recession, when jobs are scarce and people are struggling to stay out of
90
U
NDERSTANDING
S
TOCKS
10381_Sincere_03.c 7/18/03 10:58 AM Page 90
debt, you might look at recession-proof industries like food, oil, and
retail. Once the country is out of the doldrums and jobs are plentiful, you
take a look at industries like technology that could take the market higher.
Peter Lynch, a successful fund manager of the 1980s and 1990s,
got many of his stock ideas by watching where his children shopped at
the mall. If you go to the mall and The Gap, Starbucks, Hott Topic, or
Victoria’s Secret is filled with shoppers, this is a clue that these stores
are making money. This doesn’t mean that you should run out and buy
stock in one of these companies—first you should use fundamental
analysis to find out everything you can about the company. You should
also take the time to read the annual report, call investor relations for an
investment packet, and log on to the company Web site. You don’t want
to invest a lot of money in a stock without finding out everything you
can about the company’s business. Ideally, the business will be simple
and understandable with good long-term prospects for the future.
Identify the Leading Company
Once you have identified the industry you want to invest in, you want
to choose companies that are stronger and more profitable than their
competition. Let’s say you want to invest in the retail sector because
you believe (after careful research) that people will flock to discount
stores that can save them money. What stores come to mind? Wal-
Mart? Home Depot? Walgreen’s? Exactly. Choose the stores that have
name brand recognition and that advertise heavily. These companies
are called industry leaders. If people are buying the company’s prod-
ucts, the company’s earnings will go up, which should cause the stock
price to rise. To find industry leaders, you want to look for companies
that have superior sales and earnings with little or no debt.
The financial newspaper Investor’s Business Daily rates the relative
strength of stocks in leading industries, giving them a score between 1
and 99. A relative strength rating higher than 90 is considered excellent.
You can also find information about industry leaders in the Value Line
Investment Survey, which can be found at the public library. (The Value
Line Investment Survey has loads of information about individual stocks
condensed on one page. Nearly all of the fundamental information you
need to know about a stock can be found in this periodical.)
IT
’
S REALLY FUNDAMENTAL
:
INTRODUCTION TO FUNDAMENTAL ANALYSIS
91
10381_Sincere_03.c 7/18/03 10:58 AM Page 91
Talk to the Managers
Many investors who use fundamental analysis believe in talking to the
CEO and company managers to get a feel for how the corporation is
being run. Ideally, when you speak to management, you can ask how
the business is doing, where it will be spending its money, and who its
competitors are; you can also get insights about the corporation. Ques-
tioning managers is something that many professional fund managers
do. They want to invest in companies with experienced, innovative
managers who have a vision for the future. They try to avoid companies
that have too much debt, are losing business to competitors, and have
other liabilities (like lawsuits) that can affect earnings.
As an individual investor, it is highly unlikely that you will be able
to sit down with the CEO or upper management to share a drink and a
game of golf and to try to find out exactly what is going on in the cor-
poration. And even if you could, it is doubtful that the CEO would say
anything negative about the corporation. That is why management
interviews are somewhat controversial and why some professional
investors would rather study the balance sheet than talk with managers.
Company Insiders: Watch Them Closely
According to the SEC, officers and directors of a corporation who have
access to proprietary information and people who own more than 10
percent of the corporation’s stock are considered corporate insiders.
You can get clues to how a stock will do by looking at whether insid-
ers are buying or selling the stock. To find what insiders are doing, log
onto Yahoo! Finance (finance.yahoo.com), CBS Marketwatch (www.
marketwatch.com), or Bloomberg (www.bloomberg.com). In addition,
the SEC’s Web site, www.sec.gov, manages the EDGAR (Electronic
Data Gathering Analysis and Retrieval) database, which contains many
fascinating financial documents about the actions of insiders.
Some investors have created strategies that involve copying insid-
ers. After all, insiders are more knowledgeable about the future
prospects of the company than others are. On the other hand, there are
problems with tracking insider transactions. Sometimes insiders buy or
sell for reasons that have nothing to do with what is happening at the
92
U
NDERSTANDING
S
TOCKS
10381_Sincere_03.c 7/18/03 10:58 AM Page 92
company. In addition, because of the way insider transactions are
reported, you may not find out what insiders are doing until it is too late.
For example, while the CEOs of Enron and WorldCom dumped millions
of shares of stock in their companies, their action wasn’t made public
until the stocks were trading for pennies a share (insider reports are
sometimes delayed by up to 3 months).
The Balance Sheet: Uncovering the Truth about a Company’s Finances
A balance sheet is a report of the financial condition of a business,
including items that only an accountant could love. And yet, to really
understand the company you have invested in, you should study its bal-
ance sheet.
Unfortunately, most people buy stocks without taking the time to
read the balance sheet. Just remember this: You shouldn’t waste thou-
sands of dollars investing in a company unless you know a few facts
about it, like how much the company earns, how much it spends, and
how much it owes. When you have found out the truth about a com-
pany’s earnings, expenses, and debt, you’ll have a better idea of
whether you should buy its stock.
The balance sheet is found at the back of a company’s annual
report. You can also find any company’s balance sheet by registering
free at www.businessweek.com. Type in the stock symbol and select
SEC filings. You can also log on to Edgar Online, a subscription-based
service that allows you access to all SEC filings, including the quar-
terly 10-Q filing and the annual 10-K filing.
Let’s take a quick look at some of the items on a balance sheet
(which by no means includes everything):
1. Assets (what the company owns, such as cash, property, equip-
ment, real estate, and accounts receivable)
2. Liabilities (what the company owes, such as declared and unpaid
dividends and accounts payable)
3. Shareholders’ equity, or net worth (assets minus liabilities)
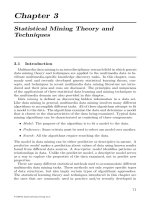
Let’s take a look at Bright Light’s consolidated balance sheet,
shown in Figure 9-1.
IT
’
S REALLY FUNDAMENTAL
:
INTRODUCTION TO FUNDAMENTAL ANALYSIS
93
10381_Sincere_03.c 7/18/03 10:58 AM Page 93
Simply put, a balance sheet is a list of everything a company owns
and everything it owes. This gives shareholders a snapshot of the com-
pany’s finances. The best way to study a balance sheet is to compare it
to the balance sheets of other companies in the same industry. In addi-
tion, you should look at the balance sheet for previous years to get a
better idea of where the company has been and where it might be going.
94
U
NDERSTANDING
S
TOCKS
Bright Light Balance Sheet
(in thousands)
December 31, December 31,
2002 2001
ASSETS
Current Assets
Cash and cash equivalents 1,196 1,098
Accounts receivables 1,637 1,367
Inventories 528 530
Deferred income taxes 158 120
Property and equipment 978 877
Other assets 325 103
—————— ——————
Total Current Assets: 4,822 4,095
LIABILITIES AND STOCKHOLDER’S EQUITY
Current Liabilities
Accounts Payable 879 525
Accrued Expenses 578 502
Income taxes payable 186 179
Current Portion of Long-Term Debt 98 75
—————— ——————
Total current liabilities: 1,741 1,281
Stockholder’s Equity
Common stock 1,567 1,567
Retained earnings 1,514 1,247
—————— ——————
Total stockholder’s equity: 3,081 2,814
Total liabilities and
stockholder’s equity: 4,822 4,095
Figure 9-1
10381_Sincere_03.c 7/18/03 10:58 AM Page 94
As long as the company is not hiding debt or liabilities, the balance
sheet gives you a glimpse of its financial condition. However, reading a
balance sheet takes skill because some companies are clever at hiding
their expenses and debt while exaggerating their earnings.
For example, only a handful of knowledgeable investors figured
out that the balance sheets of companies like Enron and WorldCom
didn’t add up. As it turned out, upper management at these two compa-
nies gave an extremely distorted view of the true financial picture. It
would have been difficult, if not impossible, for investors to uncover
the truth. Nevertheless, before Enron’s collapse, financial expert War-
ren Buffett reminded investors he never invested in a company in which
he didn’t understand how they made money. The lesson: If you’re still
confused after reading the balance sheet, invest your money elsewhere.
The Annual Report
For many people, there isn’t anything more boring than reading
the annual report, a financial report of large, publicly owned cor-
porations. These reports are often long, generally 30 or more
pages containing important financial statements such as the bal-
ance sheet and income statement. In addition, there might be a
letter from the CEO about the steps he or she is taking to make
the business more profitable, how the company has performed,
and business strategies. Unless you are an accountant or lawyer,
it could easily take you all day to wade through the entire report,
which often contains public relations fluff. Many pros have
learned to focus only on the information in the report they
believe is important and ignore the rest.
To cover themselves, many companies will mention all of the
risks you’ll take if you invest in the company. They also tend to
highlight the positive aspects of their business while minimizing
the negative. As mentioned before, a few companies purposely
deceived investors into believing they were more profitable than
they were, although a careful read of the annual report could pro-
vide clues that the company was not entirely truthful. Some of the
most fascinating tidbits can be found in the footnotes. This is per-
IT
’
S REALLY FUNDAMENTAL
:
INTRODUCTION TO FUNDAMENTAL ANALYSIS
95
10381_Sincere_03.c 7/18/03 10:58 AM Page 95
haps where you’ll learn about perceived risks, ongoing legal
issues, and other unforeseen problems.
Although it might be painful to read the entire annual report,
it’s worth your while to understand where you are putting your
hard-earned money. If you are a long-term investor, you want to
learn whether or not the company is making money, whether its
debt is rising or falling, and if management has a successful busi-
ness plan.
In the next chapter, you will learn the tools and tactics that funda-
mental analysts use to value stocks.
96
U
NDERSTANDING
S
TOCKS
10381_Sincere_03.c 7/18/03 10:58 AM Page 96
10
97
Fundamental Analysis:
Tools and Tactics
Fundamental analysts use a number of tools to evaluate and measure
stocks. After all, before you buy a stock, you want to be sure that the
company is of good quality and that it is a good value at the price.
Investors who primarily use fundamental analysis to choose stocks typ-
ically use a variety of tools to decide which stocks to pick. In this sec-
tion, I briefly describe some of the most popular.
Income Statement: Learning How
a Company Makes Money
One of the best ways to determine how much money a company is mak-
ing is by looking at its income statement. This contains a lot of useful
information, such as the company’s sales, operating expenses, and
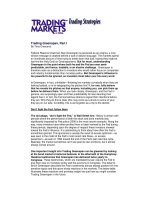
earnings. Figure 10-1 gives the income statement for Florida Star.
The top line of the income statement gives the company’s sales or
revenue (also referred to as the top line). Look to see if the company’s
CHAPTER
10381_Sincere_03.c 7/18/03 10:58 AM Page 97
Copyright © 2004 by The McGraw-Hill Companies, Inc. Click here for Terms of Use.
revenue is increasing when compared to that in earlier years. For exam-
ple, if you are a growth investor, look for companies whose revenue is
increasing by 15 percent or more each year.
The next section of the income statement gives operating expenses.
These are the costs of doing business, such as salaries, advertising,
training employees, and buying new computers, to name a few. There is
usually also a line for research and development (R&D), which is the
cost of developing and investing in new products.
The next three sections of the income statement describe the com-
pany’s income. Have you heard someone say, “What is the bottom
line?” This refers to a company’s net income (which happens to be on
98
U
NDERSTANDING
S
TOCKS
Florida Star Consolidated Income Statement
(in thousands)
2002 2001 2000
SALES REVENUES
Net Sales 2,895 2,682 1,654
Services 1,764 1,456 789
Hardware 1,591 1,101 961
Software 897 763 690
—————— —————— ——————
Total Sales Revenue: 7,147 6,002 4,094
OPERATING EXPENSES
Cost of sales 2,324 2,643 1,477
Advertising and promotion 987 877 654
Research and Development 104 91 58
Other operating expenses 78 65 29
—————— —————— ——————
Total Operating Expenses: 3,493 3,676 2,218
Earnings before income tax: 3,654 2,326 1,876
Provision for income tax: 78 67 43
—————— —————— ——————
Net Income: 3,576 2,259 1,833
EARNINGS PER SHARE
Earnings per share
of common stock .99 .87 .76
Figure 10-1
10381_Sincere_03.c 7/18/03 10:58 AM Page 98
the bottom line of the income statement). After paying all expenses,
how much money did the company make? This is net income.
Earnings per Share: Determining How Much Money
the Company Makes
No matter how good you think a corporation is or how much you love its
managers, if the company isn’t earning money, eventually its stock price
will fall. That’s where EPS comes in. You can find it at the bottom of the
company’s income statement, below net income. (You calculate EPS by
dividing a company’s after-tax profit by the company’s outstanding
shares.) You can also find the EPS in the company’s quarterly or annual
report, on any number of financial Web sites, such as Yahoo! Finance, or
in periodicals like Barron’s, the Financial Times, or the Wall Street Jour-
nal. The financial newspaper Investor’s Business Daily also ranks the
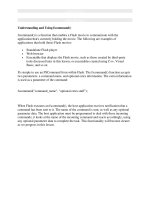
relative strength of EPS on a scale of 1 to 99. Figure 10-2 gives the EPS
for IBM.
If a company is earning more money, it obviously should be
rewarded with a higher stock price. That’s why it’s so useful to compare
the company’s earnings with those of the previous quarter or the previous
year to determine if earnings are going up. (Because some companies are
FUNDAMENTAL ANALYSIS
:
TOOLS AND TACTICS
99
Earnings Per Share: IBM
Earnings Per Share ($) for Fiscal Year Ending December
2002 2001 2000 1999 1998 1997
1Q 0.68 0.98 0.83 0.77 0.53 0.59
2Q 0.03 1.15 1.06 1.28 0.75 0.73
3Q 0.76 0.90 1.08 0.93 0.78 0.69
4Q 0.59 1.33 1.48 1.12 1.23 1.05
Year 2.06 4.35 4.44 4.12 3.28 3.00
Figure 10-2
10381_Sincere_03.c 7/18/03 10:58 AM Page 99
seasonal, quarter-to-quarter comparisons may not be as useful as year-to-
year comparisons.)
Unfortunately, finding out how much a company really earns is not
as easy as it appears. Some CEOs will play a number of accounting tricks
to make it appear that earnings are stronger than they really are. (To keep
stock prices artificially high, some CEOs “cooked the books,” or
changed the numbers so it appeared that the company was making more
money than it had in the past. In such cases, when the truth comes out, the
company is often forced to restate its earnings, causing the stock to plum-
met. For example, WorldCom restated its earnings by billions of dollars.)
It’s not enough to buy stocks in companies that grow by more than
15 percent a year—you must also understand how the company makes
that money. It sometimes takes a stock detective to find out the truth.
The Earnings Estimates Game
Adding to the confusion about EPS, stock analysts (people who are
paid to independently research corporations and make buy or sell rec-
ommendations on their stocks) make estimates or predictions of com-
panies’ future earnings. Often, a stock will rise on the expectation that
the company’s earnings will grow in the future. If a company beats ana-
lysts’ estimates, the stock price usually goes up. If a company misses
analysts’ estimates, even by as little as a penny, the stock price usually
falls. Sometimes a company will beat analysts’ published estimates but
not beat the “whisper number,” an unofficial earnings estimate that is
generally not made public. As noted earlier, CEOs are under extreme
pressure to beat the earnings estimates.
Looking at Stock Ratios
The Price/Earnings Ratio: The Granddaddy of Stock Ratios
Many people use the price/earnings ratio (P/E) to get a quick indica-
tion of whether the stock price is reasonable given the company’s earn-
100
U
NDERSTANDING
S
TOCKS
10381_Sincere_03.c 7/18/03 10:58 AM Page 100
ings. When you divide the stock price by the company’s earnings per
share, you end up with a P/E ratio (also known as the multiple), that
can help you determine whether a stock is fairly valued. Many people
think that the P/E is the most effective way to measure a stock. Actu-
ally, the P/E is just one of many tools you can use to decide what
stocks to buy.
For example, a stock that sells for $20 a share and earned $2 last
year has a trailing P/E of 10 ($20 divided by $2); the trailing P/E uses
earnings from the last year. If a $20 stock were expected to earn $4 next
year, it would have a forward P/E of 5 ($20 divided by $4). In this case,
you are using analysts’ estimates concerning what will happen in the
future. The great thing about the P/E is that you can easily and quickly
compare individual stocks with one another, with their sector, or with
the overall market.
Many investors decide whether to buy a stock based on its P/E. For
example, value investors (bargain hunters looking for stocks of high-
quality companies that are selling for a reasonable price) prefer to buy
stocks with low P/Es, ideally under 15. (Warren Buffett, for example,
buys only companies with trailing P/Es of 10 or less.) On the other
hand, growth investors (aggressive buyers looking for stocks in compa-
nies whose sales or earnings are growing rapidly) don’t mind buying
stocks with high P/Es because they expect the companies’ earnings to
improve in the future. If a stock has a P/E of 50 but is growing by 60
percent a year, the stock could be a bargain.
Nevertheless, basing your stock decisions on what a company’s
earnings might be in the future has backfired on many investors. In par-
ticular, analysts’ expectations concerning future earnings have often
been overly optimistic. For example, in the late 1990s, analyst Mary
Meeker continually urged investors to buy shares of Priceline, even
though its P/E was outrageously high (it had no earnings and an
extremely high stock price). She claimed that traditional fundamental
measurements like P/E didn’t matter anymore. That was a few months
before Priceline fell from hundreds of dollars per share to a couple of
dollars. The lesson: P/Es do matter.
Even now, misconceptions about the P/E are common. Just because
a stock’s P/E is low doesn’t mean that you should buy the stock. And
FUNDAMENTAL ANALYSIS
:
TOOLS AND TACTICS
101
10381_Sincere_03.c 7/18/03 10:58 AM Page 101
just because the P/E is high doesn’t mean that the stock should be
avoided (although the risk is higher). In general, you can use the P/E to
determine quickly if a stock is cheap or expensive when compared with
its peers and the overall market. (By the way, pay attention to the P/E of
the entire market. For years, the P/E of the S&P 500 was hovering
above 30, a clue that the market was overvalued. Some analysts believe
that the S&P 500 will have to drop to a P/E of 15, its historical average,
before it will be fairly priced.)
Price/Earnings/Growth: Taking the P/E One Step Farther
The P/E ratio is quite useful, but it doesn’t take into account future
earnings potential. That’s what the price/earnings/growth (PEG) ratio is
designed to do. To calculate the PEG, instead of simply dividing the
stock price by the earnings (as you do for the P/E), you divide the P/E
by the earnings growth of the company. For example, if a company has
a P/E of 20 and an annual earnings growth rate of 10 percent, the PEG
will be 2. This allows you to take into account both the P/E and the
company’s growth rate in determining the value of a company. Many
people feel that the PEG is more accurate than the P/E because it takes
future growth into account.
The guideline for PEG users is as follows:
A stock with a PEG of less than 0.50 is desirable (undervalued).
A stock with a PEG between 0.50 and 1 is good (fair value).
A stock with a PEG higher than 1 is not recommended, especially
if the PEG is over 2 (overvalued).
Warning: You should use the PEG as only one piece of a larger cal-
culation. Do not decide to buy a stock based solely on its PEG results.
For the most complete and accurate calculation, it is suggested that
you use the PEG to compare stocks within the same industry. The
problem with the PEG, like that with the forward P/E, is that you are
basing your information on earnings estimates, which have histori-
cally been unreliable. That is why it is so important that you use a vari-
ety of tools before deciding to buy or sell a stock.
102
U
NDERSTANDING
S
TOCKS
10381_Sincere_03.c 7/18/03 10:58 AM Page 102
Price-to-Sales Ratio: Effective for Uncovering Revenue
Because P/E ratios are generally useless with companies that have no
earnings, some investors use the price-to-sales ratio (P/S) to decide
whether to buy a stock. The reasoning is that although you can play
with earnings, you can’t play with revenue. With the P/S ratio, you
compare price to sales revenue. To calculate the price-to-sales ratio,
you divide the company’s total market value by the total sales revenue
booked for the previous year. Some people claim that the P/S is more
reliable than the P/E or the PEG. (By the way, before Enron filed for
bankruptcy, its P/S ratio reportedly rose to over 200! Typically, a P/S of
over 5 is considered high, so 200 was a clear warning sign. It basically
meant that investors were paying $200 for each dollar of Enron’s sales.)
Many value investors will look for stocks with a P/S ratio of less than 1.
Return on Equity: Measuring the Financial Health of a Company
Return on equity (ROE) is a tool that helps you to measure how effec-
tively the company is being managed. Some people consider ROE one
of the most important measures of a company’s overall financial per-
formance. (You calculate ROE by dividing net income by net worth,
although this ratio is not as clear-cut because you must rely on subjec-
tive variables to calculate manager efficiency.
In general, the higher the ROE, the more effective the company is
at using its resources and the more productive the management team. In
other words, ROE gives you an idea of how well the company is man-
aged. The goal is to look for companies with a rising ROE, greater than
15 percent and growing.
There are many other fundamental stock measurements, including
return on investment (ROI), debt-to-equity ratio, price-to-book ratio
(PB), and return on assets (ROA). The purpose of many of these funda-
mental tools is to determine whether a stock is a good value compared
to its price. Because this is an introductory book, my review of funda-
mental analysis ends here. For a more thorough examination of funda-
mental analysis, you’ll find dozens of books about this topic at the
bookstore or public library.
FUNDAMENTAL ANALYSIS
:
TOOLS AND TACTICS
103
10381_Sincere_03.c 7/18/03 10:58 AM Page 103
Problems with Fundamental Analysis
One of the problems with fundamental analysis is that you must rely on
the information that a corporation provides. If the corporation is fudg-
ing the numbers or is not entirely truthful, then the future earnings pro-
jections will be off base. As you know from the recent corporate
scandals, many companies, to prop up their stock price, were pressing
their accountants and banks to misrepresent expenses as income.
Some corporations were spending money or making loans to exec-
utives, but classifying these as income. And in a few cases, CEOs were
lying about the numbers. If a corporation gives out overly optimistic
earnings numbers or lies, then fundamental analysis by itself won’t
help you. You need the skill and knowledge of an accomplished
accountant to uncover accounting irregularities.
Another problem is that you are making assumptions about a com-
pany’s future prospects that are hard to prove. Furthermore, fundamen-
tal analysis doesn’t take into account the psychological reasons that
people drive stock prices up. For example, even though the fundamen-
tals showed that many stocks were overpriced during the 1990s, this
didn’t stop them from going obscenely higher.
A final problem with fundamental analysis is that it is extremely
time-consuming. Most individual investors don’t take the time or have
the knowledge to correctly value a company. Professional money man-
agers hire teams of analysts to do fundamental research on individual
companies before they make a stock purchase. Individual investors
have to rely on biased research that is passed down from Wall Street or
by word of mouth on the Internet.
Biography of Warren Buffett
If you ask professional investors to name the greatest investor of
all time, most of them will probably name billionaire Warren
Buffett. He is best known as the CEO of $70,000-a-share Berk-
shire Hathaway, a company involved in a number of businesses,
including insurance, publishing, and manufacturing.
104
U
NDERSTANDING
S
TOCKS
10381_Sincere_03.c 7/18/03 10:58 AM Page 104
Benjamin Graham, the author of two value investment clas-
sics, Security Analysis, first published in 1934, and Intelligent
Investor, influenced Buffett early in his life. Buffett later worked
for Graham at Graham’s brokerage firm, learning from the mas-
ter how to manage investment portfolios and pick value stocks.
Buffett made a number of successful modifications to Gra-
ham’s original strategies. He uses a stock’s book value, P/E, and
dividend yield, among other objective measurements, to calcu-
late the company’s fair value. He believes in buying a company
for less than it’s worth and patiently holding its stock for a life-
time.
One of the reasons Buffett avoided investing in Internet
stocks was that he couldn’t determine their true value. Buffett
strongly believes in buying stocks in companies that are simple
and understandable (so that he can calculate their future earnings
growth). Most Internet companies had little or no earnings and
sky-high P/E ratios. At the time, several pros derided Buffett for
avoiding investments in technology companies. In hindsight,
Buffett was right.
Buffett has earned a reputation for honesty and a sense of
humor. He was one of the first to point out that you should be
cautious about investing in companies that play accounting
games when they use stock options to compensate employees.
Many people have tried to emulate Buffett’s successful buy-
and-hold strategies. A number of excellent books have been writ-
ten about his strategies, most of which are based on common
sense. The difficult part for most investors is learning how to
value a business—something that Buffett has learned how to do
after a lifetime of investment success.
In the next chapter, you will learn how traders use technical analy-
sis to buy and sell stocks.
FUNDAMENTAL ANALYSIS
:
TOOLS AND TACTICS
105
10381_Sincere_03.c 7/18/03 10:58 AM Page 105
This page intentionally left blank.
11
107
Let’s Get Technical:
Introduction to
Technical Analysis
The ironic thing about technical analysis is that it’s sometimes not
technical at all. In fact, some people believe that technical analysis is
easier to understand than fundamental analysis (although not at first).
Have you ever heard the saying that one picture is worth a thousand
words? If you have, then you’ll appreciate technical analysis because it
relies on charts and graphs to help you determine what stocks to buy or
sell. When you rely on mechanical tools like indicators and oscillators,
you will be less inclined to trade on the basis of emotion.
Technical analysis is also used to forecast what could happen in the
future. By looking at how stocks have reacted in the past, you can make
assumptions about what they might do in the future. The shorter the
time frame, the more accurate your prediction can be. [Winston
Churchill once said, “The farther backward you can look, the farther
forward you can see.” Quoted by James C. Humes, Churchill: Speaker
of the Century (Scarborough Books, New York, 1982).]
CHAPTER
10381_Sincere_03.c 7/18/03 10:58 AM Page 107
Copyright © 2004 by The McGraw-Hill Companies, Inc. Click here for Terms of Use.
As you know, fundamental analysis is the study of the data that
affect a company. Technical analysis, on the other hand, is the study of
the stock price. Short-term traders primarily use technical analysis to
help them make buying and selling decisions, although some savvy
traders also use fundamental analysis. Conversely, it might help the port-
folios of many investors if they double-checked their stock picks using
technical analysis.
Nevertheless, keep in mind that technical indicators and charts are
simply tools—there is no guarantee that you will be profitable, no mat-
ter what method you use or how sophisticated your software or equip-
ment. It really depends on how much effort you put into understanding
these stock-picking methods.
The Stock Chart
The key to technical analysis is the stock chart. Technical analysts, as
they are called, believe that looking at a stock chart is similar to a sur-
geon’s looking at x-rays before operating on a patient. Although charts
are not perfect, in the hands of a skilled technician they do provide
important clues as to when people are buying or selling. You can use
them to help you make statistical assumptions about a stock, or at the
very least, to improve the odds that the trade you make will be success-
ful. By reading a stock chart, you can receive clues about how the mar-
ket will behave in the future and when you should buy or sell.
One of the best reasons for looking at a chart is that it keeps your
emotions out of the decision-making process. You may love the com-
pany and its CEO, but if the chart shows that the stock is weak and is
headed down, you’ll probably want to avoid buying it. The good news
is that it’s easy to find a stock chart on any company you’re interested
in. Every financial television program—CNBC, Bloomberg, and
CNNfn, to name a few—and most financial newspapers, show stock
charts. The media discovered a long time ago that one of the easiest
ways to show the public how a stock has performed is to display a chart.
The first decision you make when looking at a chart is which time
frame you’d like to see. You can select a short time frame—for example,
minutes, hours, or a daily chart. Others prefer a longer time frame—
108
U
NDERSTANDING
S
TOCKS
10381_Sincere_03.c 7/18/03 10:58 AM Page 108
weeks, months, or years. Some traders look at several charts at once,
each with a different time frame.
Line, Bar, and Candlestick Charts
Line Charts
A line chart basically plots the closing prices of a stock over a specific
period. A line connects the price points. Although line charts are easy
to read and understand, they are not as popular with experienced short-
term traders because they don’t provide very much information. They
are most useful when they are combined with other technical indica-
tors. However, many newspapers and television programs use line
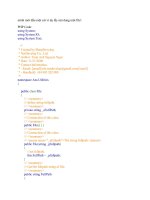
charts because they are so visually appealing. Figure 11-1 is an exam-
ple of a line chart.
LET
’
S GET TECHNICAL
:
INTRODUCTION TO TECHNICAL ANALYSIS
109
CSCO Daily
Volume
119 17 Oct 3 7 9 1513 19 23 25 27 11 21 23 2517 29 31Nov 5 7 11 13 15 19 21 25 27 4 6Dec
14.5
15.0
15.5
14.0
13.0
13.5
9.5
10.0
10.5
11.0
11.5
12.0
12.5
8.5
9.5
300
250
200
150
50
100
0
12/06/02
Millions
©Big Charts.com
Figure 11-1 Line chart
10381_Sincere_03.c 7/18/03 10:58 AM Page 109
In this example, you can see immediately that the stock is moving
higher. The volume bars are on the bottom. Notice that during the week
of October 3, Cisco fell by several points. On October 8, however, there
was a spike in volume, and the stock then began to move higher over
the next few weeks. More than likely, a large institution accumulated
(bought) shares of the stock.
Bar Charts
Bar charts are popular with some short-term traders because they are so
simple to use and understand. Figure 11-2 is an example of a bar chart.
The horizontal scale at the bottom of the chart indicates the specific
period (in Figure 11-2, a day). The vertical scale displays the prices the
stock can take on during the period. The bar is the range of prices for
the period. For example, the top of the bar represents the highest price
for the day, and the bottom represents the lowest price for the day. There
are also two “ticks” attached to the bar, one that extends to the left and
110
U
NDERSTANDING
S
TOCKS
CSCO Daily
12/06/02
15.5
15.0
14.5
14.0
13.5
13.0
12.5
12.0
11.5
11.0
10.5
10.0
9.5
9.0
8.5
8.0
300
250
200
150
100
50
0
Millons
10 14 16 18 22 24 28
30
Nov 5 7 11 13
15
19 21 25 27 Dec 4 68
Volume
©Big Charts.com
Figure 11-2 Bar chart
10381_Sincere_03.c 7/18/03 10:58 AM Page 110
one that extends to the right. The left tick stands for the opening price
for the trading day, and the right tic marks the closing price.
You can see at a glance, whether the stock closed above or below its
opening price. Generally, it is a good sign if a stock closes the day above
where it started, especially if there is strong volume right into the close.
Candlestick Charts
Candlestick charts are popular with many traders because they show so
much information, including the psychology of the market at any given
time. Many traders believe that understanding the emotions of the mar-
ket is helpful in determining future trends. (A 17th-century rice broker
in Japan created the candlestick chart to help him trade rice. As it
turned out, his charting methods enabled him to make a fortune in the
Japanese rice markets.)
Figure 11-3 is an example of a Candlestick chart. As you can see,
candlestick charts use two-dimensional bodies to show the range
between the opening and closing prices of a stock during any period.
The high and low prices are plotted as single lines and are referred to as
wicks (or shadows). The price range between the open and the close is
plotted as a narrow rectangle and is referred to as the body. If the stock
price ended the day above the opening price, the body of the rectangle
is white or clear. If the stock price ended the day below the opening
price, the body is black or solid.
Trend Lines
You could say that one of the main purposes of charting is to spot a
trend in its early stages. A trend is simply the direction in which a stock
is moving over a specific period. A stock usually doesn’t move in a
straight line, which is why spotting the trend direction is so important.
There are actually three types of trends: uptrend, downtrend, and
sideways trend. The goal is to participate in uptrends while avoiding
downtrends. A saying that technicians repeat is, “The trend is your
friend (until it ends).” The idea is to ride a trend for as long as possible
until it runs out of steam.
LET
’
S GET TECHNICAL
:
INTRODUCTION TO TECHNICAL ANALYSIS
111
10381_Sincere_03.c 7/18/03 10:58 AM Page 111