Tài liệu Quantitative aspects of ruminant digestion and metabolism - Phần 11 ppt
Bạn đang xem bản rút gọn của tài liệu. Xem và tải ngay bản đầy đủ của tài liệu tại đây (227.01 KB, 26 trang )
14
Protein Metabolism and Turnover
D. Attaix,
1
D. Re
´
mond
1
and I.C. Savary-Auzeloux
2
1
Institut National de la Recherche Agronomique, Unite
´
de Nutrition et
Me
´
tabolisme Prote
´
ique, Theix, 63122 Ceyrat, France;
2
Institut National
de la Recherche Agronomique, Unite
´
de Recherches sur les Herbivores,
Theix, 63122 Ceyrat, France
Introduction
All cellular proteins are in a continuous state of turnover in which they are
synthesized and degraded (Waterlow et al., 1978). Thus, the intracellular
concentration of any protein, and the tissue, organ or whole-body protein
mass, are determined by the relative synthetic and degradation rates. It should
be pointed out that a change in the size of a given protein pool only depends on
the imbalance between both processes of protein turnover. In other words, an
increase or a decrease in such a protein pool does not necessarily correlate with
only an enhanced rate of either protein synthesis or protein breakdown,
respectively. For example, the anabolic agent trenbolone acetate decreased
rates of both protein synthesis and breakdown and resulted in net muscle
protein gain (Vernon and Buttery, 1976).
The cyclical nature of protein turnover also implies that rates of protein
synthesis and degradation are considerably greater than the net flux (protein
deposition or loss) through the protein turnover cycle. For example, a large
proportion of free amino acids arising from protein breakdown is reutilized for
protein synthesis, so that the rate of whole-body protein synthesis is much
greater than the rate of dietary influx of amino acids.
Both protein synthesis and breakdown require energy (see below). How-
ever, the process of protein turnover provides the organism with several
adaptive mechanisms that clearly outweigh the metabolic costs:
1. Growth and mobilization of tissue/organ and whole-body protein mass is
easily achieved, depending on the physiological status.
2. Large amounts of free amino acids can be mobilized from skeletal muscle
and used to provide energy and precursors for protein synthesis in vital organs
(brain, heart, etc.) and synthesis of specific sets of proteins (e.g. acute phase
ß CAB International 2005. Quantitative Aspects of Ruminant Digestion
and Metabolism, 2nd edition (eds J. Dijkstra, J.M. Forbes and J. France)
373
proteins by the liver) in stress situations, even when dietary amino acid supply is
deficient.
3. Abnormal (e.g. miscoded or misfolded) proteins can be broken-down and
do not accumulate in cells.
4. Both endogenous and exogenous proteins, including bacterial and viral
proteins, are hydrolysed into peptides and presented on major histocompat-
ibility complexes to eventually activate the immune system.
5. The intracellular abundance of key proteins (e.g. enzymes, cyclins or
transcription factors) is tightly regulated so that major biological processes are
precisely controlled.
A major challenge is to understand both general and tissue/organ-specific
mechanisms, which are responsible for these adaptations. In vitro studies have
provided detailed information on the regulatory mechanisms of protein turn-
over. In vivo studies are inevitably more descriptive, and experiments in animal
production are mostly designed to optimize protein deposition efficiency in
skeletal muscle (meat) or milk production. Furthermore, the cost of research in
large animal species has clearly impeded our understanding of protein metab-
olism in ruminants, so that most available information remains fragmentary.
Mechanisms of Protein Turnover
The precise mechanisms of protein synthesis, which include transcription,
translation and post-translational modifications, have been extensively studied
and are detailed in many textbooks of biochemistry. The mechanisms that
regulate protein breakdown are much more obscure. First, there are several
proteolytic pathways within cells (e.g. lysosomal, Ca
2þ
-dependent, ubiquitin–
proteasome-dependent (see Fig. 14.1), etc.), and many proteases remain to
be discovered or characterized. In addition, the relative contribution of proteo-
lytic pathways to the rate of overall proteolysis is tissue specific. The lysosomal
pathway plays a prominent role in liver (Attaix et al., 1999), while the ubiqui-
tin–proteasome system has a major importance in skeletal muscle (Attaix and
Taillandier, 1998; Jagoe and Goldberg, 2001). Second, there are many alter-
native routes within a given proteolytic process (Attaix et al., 1999). Third,
in vivo, different proteolytic systems may either independently degrade a given
protein substrate (Attaix et al., 1999), or sequentially participate to its com-
plete hydrolysis into free amino acids (Attaix et al., 2002).
Protein synthesis requires the hydrolysis of both ATP and GTP. However,
the actual cost of protein synthesis is much higher than the theoretical cost of
peptide bond formation, presumably because many proteins involved in trans-
lational control are G-proteins, which are activated in the presence of GTP.
Direct measurements of oxygen consumption in the presence of cycloheximide
have yielded values of 5.4 and 7.5 kJ/g protein synthesis when measured
in vivo in chickens, and in vitro in sheep muscle, respectively (see Lobley,
1994). Protein breakdown also requires energy. For example, ATP hydrolysis
is required in many steps of ubiquitin–proteasome-dependent proteolysis
374 D. Attaix et al.
(Attaix et al., 2002). It has been suggested that 10% of the cellular energy
requirements are linked to proteolysis (Lobley, 1994). This estimation must be
taken with caution. The amount of energy required to degrade 1 g of protein is
unknown, cannot be assessed experimentally, and presumably largely depends
on numerous factors, which include the nature of the substrate, the proteolytic
system(s) involved in its breakdown, the site of proteolysis, etc.
Measurement of Protein Synthesis and Degradation
Whole-body protein turnover
The constant infusion technique has been widely used to estimate both com-
ponents of whole-body protein turnover. A labelled amino acid is infused
intravenously until the plasma specific radioactivity or enrichment (for a
radio- or a stable isotope, respectively) of the free amino acid used as a marker
reaches a plateau. This is achieved within a few hours (Fig. 14.2a). The ratio,
rate of isotope infusion/isotopic activity at the plateau, gives the flux or irre-
versible loss rate (ILR) of the amino acid from the plasma. If the labelled amino
acid infused into the blood/plasma free amino acid pool is an essential amino
acid, and if this pool has a constant size (steady state) the total input through
this pool is equal to the total output, so that:
Free Ub E1~Ub E2~Ub
E2
Protein-(Ub)
n
E3 +
DUB (4)
n Ub + protein
26S Proteasome (5)
nUb + peptides
E1 +
ATP
Protein
(1) (2) (3)
(6)
TPP II
Free AA
+ AP
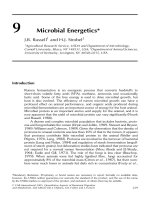
Fig. 14.1. Schematic representation of the ubiquitin (Ub)–proteasome-dependent proteolytic
pathway. Polyubiquitination of the substrate is achieved in sequential steps (1) to (3). (1) The
Ub-activating enzyme, E1, forms a thiol–ester bond with Ub. (2) The activated Ub is then
transferred to an Ub-conjugating enzyme, E2, which also forms a thiol–ester linkage with Ub.
(3) In the presence of an Ub–protein ligase, E3, that specifically recognizes the substrate, the E2
and / or E3 covalently binds a polyUb chain (Ub)
n
to the target protein. (4) A huge family of
deubiquitinating enzymes (DUB) can remove the polyUb degradation signal, so that the substrate is
not degraded and free ubiquitin is recycled. (5) More generally, the polyUb degradation signal is
recognized by the 26S proteasome, and the substrate is cut into peptides with recycling of free Ub.
(6) The peptides generated by the proteasome are finally hydrolysed into free amino acids (AA) by
the tri-peptidyl peptidase II (TPP II) and several associated aminopeptidases (AP) (see Attaix et al.,
2002 for more detailed information).
Protein Metabolism and Turnover 375
ILR ¼ Synthesis(S) þ Oxidation(O) ¼ Breakdown(B) þ Intake(I)
Amino acid oxidation (O) can be determined by using a 1-
14
Cor1-
13
C tracer
amino acid, and collecting expired
14
CO
2
or
13
CO
2
that should be corrected
for an apparent CO
2
fixation in the body. The whole-body protein synthesis
rate (S) is then deduced from S ¼ ILR À O. Alternatively, the whole-body rate
of protein breakdown (B) is equal to B ¼ ILR À I in the fed state, or to B ¼ ILR
Fig. 14.2. Schematic representation of
the specific activity of the tracer following
the administration of a constant infusion
(a) or of a flooding-dose (b) of a labelled
amino acid. In (a) the ratio of the isotopic
activity of the label at the end of the
infusion crucially depends on the rate of
protein turnover in the tissue (e.g. the
tissue homogenate/plasma isotopic activity
is high (0.9 to 0.7) in skeletal muscle,
where the intensity of protein turnover is
low, and is low (0.6 to 0.3) in tissues where
protein turnover is rapid (liver, gut)). In
(b), this problem is minimized over a short
period of time, and this ratio is usually over
0.7, including when protein turnover is a
rapid process (see Attaix and Arnal, 1987).
(b)
Plasma
Plasma
Muscle
Liver
Free label specific activity
Time after label administration
10 20 30
40
50 min
(a)
Muscle
Liver
1234 h5
Free AA Protein
(I)
(O)
(S)
(B)
Tracer
Fig. 14.3. Two-pool model used for the estimation of the whole-body irreversible loss rate (ILR)
and tissue protein fractional synthesis rate (FSR) in vivo, see text. Amino acid (AA) fluxes, which
are inputs into the free amino acid pool (e.g. intake (I) and protein breakdown (B)), and outputs
from this pool (e.g. protein synthesis (S) and amino acid oxidation (O)) are shown. The tracer,
usually an essential amino acid, is infused or injected into the blood/plasma free amino acid pool,
which is assumed to be the precursor pool for protein synthesis. A third pool (e.g. the intracellular
free amino acid pool in equilibrium with the blood/plasma free amino acid pool and the protein
pool) is often used to calculate the fractional rate of protein synthesis in a given tissue or organ
(see Waterlow et al., 1978 for detailed explanations).
376 D. Attaix et al.
in the fasted state. In ruminants I (absorption) is particularly difficult to estimate,
and fasting is not easily achieved.
The technique is simple, non-destructive, allows different measurements in
the same animal, but has some major flaws, which have been extensively
discussed elsewhere (Waterlow et al., 1978; Lobley, 1994). First, whole-body
data are difficult to interpret and the ILR technique totally obscures changes
in both rates of protein synthesis and breakdown in various tissues. Second, the
technique provides only a minimum estimate of the rates of protein turnover and
of amino acid oxidation since the isotopic activity is much higher in the plasma
than in tissues, where the tracer is diluted by unlabelled free amino acid from
protein degradation (Fig. 14.2a). Third, there is some recycling of the tracer
from tissues where protein turnover is rapid (e.g. liver, gastrointestinal tract
(GIT), see below), and this also causes underestimation of the ILR.
Regional estimations of protein turnover
Another closely related technique involves selective catheterization of an artery
and a vein draining a hind limb bed. An index of both the rates of protein
breakdown and synthesis is calculated by measuring the concentration of the
label and its isotopic activity in arterial and venous blood, and the blood flow.
Labelled phenylalanine (Barrett and Gelfand, 1989) and other amino acids can
be used (Hoskin et al., 2001). Amino acid oxidation can also be determined by
following the fate of the C-1 moiety of essential amino acids. The arteriovenous
approach has the same limitations as the ILR technique, and there is some
contamination from the other tissues within the hind limb, e.g. skin and bone.
Amino acid mass transfers have been also quantified by arteriovenous proced-
ures across the portal-drained viscera (PDV) and liver in sheep (Lobley et al.,
1996). Such procedures require extensive surgery, but they allow repeated
measurements within the same animal.
Tissue and organ protein turnover
Protein synthesis
To measure fractional rates of protein synthesis (FSR, usually expressed in %
per day) in vivo the specific radioactivity (or enrichment) of the labelled amino
acid must be measured in both the precursor and the protein pools (Waterlow
et al., 1978). Except for skeletal muscle and skin, in which biopsies can be
easily performed, slaughter is usually required to collect internal samples. Two
techniques have provided most of the data available in ruminants.
The most commonly used is the constant tracer infusion analysis, as in the
ILR technique (see above and Fig. 14.2a). The difficulty is to estimate the activity
of the precursor pool for protein synthesis. The activity of the actual pool, the
charged aminoacyl-tRNAs, is technically very difficult to determine. Based on
experiments performed in vitro and in vivo, it is generally assumed that ami-
noacyl-tRNAs are charged from both extracellular (plasma) and intracellular
Protein Metabolism and Turnover 377
(tissue homogenate) free amino acid pools (Waterlow et al., 1978). However, as
the label is diluted by the unlabelled amino acid used as a marker, which arises
from protein breakdown, there are large differences between the isotopic activ-
ities in these pools (Fig. 14.2a). This is especially true when protein turnover is
high (liver, GIT). Consequently there are also large differences between FSR
calculated by using the isotopic activity of the free label in the plasma and the
tissue homogenates. In addition, since the label is infused during several hours,
secreted or export proteins, which are for example synthesized in the liver and
the intestines, are not taken into account in the measurements.
To overcome all these problems, the label can be injected with a large or
flooding dose of the same unlabelled amino acid. This results in nearly constant
and close isotopic activity of the tracer, both in the plasma and in tissue hom-
ogenates within a short period of time (Fig. 14.2b). To meet these goals the large
dose of unlabelled amino acid should ideally represent several times the whole-
body free amino acid content. For example, when [
3
H]valine was used as a tracer
in 1-week-old lambs the flooding dose was very efficient with an unlabelled
amount of valine that represented about ten times the whole-body free valine
content (Attaix, 1988). In such conditions, FSR calculated from the isotopic
activity of the free label either in the plasma or the tissue homogenates are quite
similar. Although the technique is potentially interesting for measuring protein
synthesis in tissues where FSR are high, there are some potential problems. First,
the injection of a large amount of amino acid may affect amino acid transport
and/or hormonal secretions (e.g. insulin). Second, the procedure is rather ex-
pensive. Consequently, there are very few measurements in adult ruminants, and
all published data have been obtained for only the ovine species. Finally, the
procedure may favour the measurement of FSR in short-lived proteins.
Protein breakdown
Methodological problems associated with reliable measurements of in vivo
proteolysis impede the understanding of its regulation. In addition, all tech-
niques that can be used in vivo do not provide any information on proteolytic
systems that are responsible for changes in proteolysis.
In tissues and organs from growing animals, the fractional rate of protein
breakdown (FBR) can be calculated as the difference between FSR and the
fractional rate of protein deposition (FGR) (Waterlow et al., 1978). Such es-
timations are very imprecise because FGR must be estimated over several days,
FSR being measured over a few minutes or hours. However, FSR and FGR are
not necessarily constant over the period of measurements. For example, they
may fluctuate largely with the feeding pattern. In addition the technique requires
slaughter and cannot be used in tissues that secrete or export proteins.
3-Methylhistidine is formed by a post-translational methylation of histidine
residues in actin and in myosin heavy chains of fast-twitch glycolytic skeletal
muscles. In the rat and cattle, but not all species (see below), the urinary excretion
of 3-methylhistidine provides an index of myofibrillar protein breakdown.
Unfortunately, the visceral smooth muscles of the GIT and other tissues such
as skin contain significant amounts of actin. These tissues contribute dispropor-
tionately for their size to 3-methylhistidine urinary excretion, because of
378 D. Attaix et al.
their high rates of protein turnover. In addition, changes in renal clearance of 3-
methylhistidine may affect the interpretation of the data (see Attaix and Taillan-
dier, 1998). Finally, in some species (e.g. in pigs and to a lesser extent in sheep),
a high proportion of 3-methylhistidine is retained in muscle as a dipeptide,
balenine (Harris and Milne, 1987). A compartmental model of 3-methylhistidine
metabolism has been developed, which involves the assessment of muscle
proteolysis and 3-methylhistidine kinetics without the collection of urine (Rath-
macher and Nissen, 1998). However, due to the numerous limitations of the 3-
methylhistidine approach, caution must be exercised.
Non-quantitative approaches
Non-quantitative approaches may be of special interest in ruminant tissues, due
to the costs of experiments with isotopic amino acids. As a very crude rule, the
control of protein synthesis occurs mainly at the transcriptional level. Therefore
the quantification of the mRNA(s) of a given protein by molecular biology
techniques is often used as an index of protein synthesis. However, many
mRNAs are also subject to translational control, and the relative amount of
any mRNA depends on both rates of transcription and of mRNA breakdown.
Finally, there are frequent discrepancies between mRNA levels and the corre-
sponding protein levels and/or activities. Similarly, changes in mRNA levels for
many proteolytic genes, in particular within the muscle ubiquitin–proteasome-
dependent pathway, closely mimic variations of proteolytic rates measured with
incubated rodent muscles (see Attaix and Taillandier, 1998). These observa-
tions, together with the use of specific inhibitors of lysosomal and Ca
2þ
-
dependent proteases and of the proteasome, lead to the concept that most
muscle proteins, and in particular myofibrillar proteins, are degraded in an
ubiquitin–proteasome-dependent fashion (Attaix and Taillandier, 1998; Jagoe
and Goldberg, 2001). However and again, elevated mRNA levels for proteo-
lytic genes only reflect increased transcription in a few instances (see Attaix and
Taillandier, 1998), and do not always strictly correlate with rates of proteolysis
(see Combaret et al., 2002). Measuring proteolytic gene expression may be of
interest in small muscle biopsies from ruminants, with complementary ap-
proaches (e.g. measurements of protein levels for some enzymes of the ubiqui-
tination machinery and proteasomal subunits, of the rate of ubiquitination of
protein substrates, and of proteasome activities).
Whole-body Protein Metabolism
The age of animals and the level of nutrition are the best described factors that
regulate whole-body protein metabolism in ruminants. When expressed on a
metabolic liveweight basis, whole-body protein synthesis in lambs increases
during the first days following birth, declines very rapidly within 6 months
(without any major effect of weaning), and thereafter remains stable with
increasing age (Fig. 14.4).
Protein Metabolism and Turnover 379
Whole-body protein synthesis (g/day/kg BW
0:75
) increases with metaboliz-
able energy (ME) intake (kJ/day/kg BW
0:75
) (Fig. 14.5). This increase is linear in
sheep (Harris et al., 1992; Yu et al., 2000; Savary et al., 2001), but not in steers
(Dawson et al., 1998; Lapierre et al., 1999). In both species fed above mainten-
ance (based on an energy maintenance requirement of 400 and 500 kJ/day/kg
BW
0:75
for sheep and steers, respectively) the slope of the relationship is very
similar (e.g. 13–14 g of protein synthesized per MJ ME). However, below main-
tenance, protein synthesis decreases in sheep but is not altered in steers (Lapierre
et al., 1999). Above maintenance requirements, the calculated whole-body pro-
tein degradation rate (protein synthesis minus deposition) increases in both sheep
and steers (Harris et al., 1992; Lapierre et al., 1999). Below maintenance
protein breakdown decreases in sheep (Harris et al., 1992), but increases in steers
(Lapierre et al., 1999). Besides species differences, the duration of the under-
feeding period, the composition of the diet and the age of animals may account for
these discrepancies. Nevertheless, whole-body protein loss was similar (about
1g/day/kgBW
0:75
) in both underfed (0.6Â maintenance) steers and sheep.
Tissue Protein Metabolism
Portal-drained viscera
On average, the portal net release of essential amino acids accounts for only
two-thirds of their apparent disappearance from the small intestine (MacRae
0
10
20
30
40
50
60
70
−100 102030405060708090100
WB protein synthesis (g/day/kg BW
0.75
)
Age (weeks)
Birth Milk-fed Weaned
Fig. 14.4. Effect of age on whole-body (WB) protein synthesis in sheep. (Data from Patureau
Mirand et al., 1985; Attaix, 1988; Harris et al., 1992; Neutze et al., 1997; Adams et al., 2000;
Yu et al., 2000; Savary et al., 2001.)
380 D. Attaix et al.
et al., 1997b, Berthiaume et al., 2001). Moreover, the sequestration of indi-
vidual essential amino acids in the PDV may account from one- to two-thirds of
their whole-body flux, and the majority ($80%) of the amino acids sequestrated
arose from the arterial supply (MacRae et al., 1997a). Thus, first-pass PDV
5
10
15
20
25
30
0 200 400 600 800 1000 1200
Metabolizable energy (kJ/day/kg BW
0.75
)
Harris et al. (1992)
Neutze et al. (1997)
Savary et al. (2001)
Adams et al. (2000)
5
10
15
20
25
30
35
40
0 200
(a)
(b)
400 600 800 1000 1200
Metabolizable energy (kJ/day/kg BW
0.75
)
WB protein synthesis (g/day/kg BW
0.75
)WB protein synthesis (g/day/kg BW
0.75
)
Lobley et al. (1987)
Hammond et al. (1987)
Dawson et al. (1998)
Lapierre et al. (1999)
Lobley et al. (2000) (Angus)
Lobley et al. (2000) (Charolais)
Fig. 14.5. Effect of metabolizable energy intake on whole-body (WB) protein synthesis in cattle
(a) and sheep (b).
Protein Metabolism and Turnover 381
metabolism of dietary amino acids as well as PDV use of systemic amino acids
significantly impact the quantitative and qualitative supply of amino acids to
other tissues or organs. The portal vein drains heterogeneous tissues (GIT,
pancreas, spleen, omentum), but the GIT is by far the major contributor to
PDV protein synthesis. For this reason, only GIT protein metabolism is
reviewed below.
Gastrointestinal tract
The mass of the GIT increases with intake, and the importance of its different
compartments varies according to the composition of the diet. Protein mass of
the ruminant GIT accounts for 4–6% of whole-body proteins (Lobley et al.,
1980; Attaix, 1988; MacRae et al., 1993). However, because of the high FSR
in these tissues, the GIT contributes $25–35% of whole-body protein synthesis
(Lobley et al., 1980, 1994; Attaix, 1988) compared to $12% in pre-ruminant
animals (Attaix and Arnal, 1987). The large dose procedure is best suited for
measuring protein synthesis in the GIT (see above), and data reported in this
section are derived from studies using this technique (export proteins being
included in synthesis). Whatever the age, the pattern of FSR along the GIT is
very similar to the highest values in the small intestine (Fig. 14.6).
FORESTOMACHS
.
Rumen growth is rapid and stimulated by the initiation of solid
food intake and the concomitant establishment of microbial fermentation.
Thus, the reticulorumen represents $7% and 30% of the GIT protein mass
in 1-week-old milk-fed and 8-week-old weaned lambs, respectively (Attaix,
0
20
40
60
80
100
120
140
Rumen
Omasum
Abomasum
Duodenum
Jejunum
Ileum
Caecum
Colon
Protein fractional synthesis rate (% per day)
1-week-old 8-week-old 8-month-old
Fig. 14.6. Protein fractional synthesis rates in the gastrointestinal tract from milk-fed
(1-week-old) and weaned lambs. (Data from Attaix, 1988; Lobley et al., 1994.)
382 D. Attaix et al.