Tài liệu Quantitative aspects of ruminant digestion and metabolism - Phần 13 docx
Bạn đang xem bản rút gọn của tài liệu. Xem và tải ngay bản đầy đủ của tài liệu tại đây (205.24 KB, 26 trang )
17
Metabolic Regulation
R.G. Vernon
Hannah Research Institute, Ayr KA6 5HL, UK
Introduction
Ruminants, like other animals, have to meet the nutritional demands of the
many organs and cell types of the body. This has to be done against a
background of a varying, and not always adequate, supply of nutrients. Thus,
once absorbed there are a number of potential fates for a given nutrient and a
plethora of mechanisms and factors, which influence the probability of a given
fate. Such mechanisms operate within cells, between different cells and types
within a tissue, and between organs. Mechanisms may be brought into play to
deal with acute or chronic challenges: the former are important for homoeo-
stasis while the latter are critical for the homoeorrhetic adaptations needed for
different developmental, physiological, nutritional or pathological states. The
nature of these mechanisms and the various types of factors involved are
considered in subsequent sections. It will be obvious to those familiar with the
previous edition of this book that the flavour of the current chapter is very
different from that written by the late Bernard Crabtree. He focused on the
important but still rather specialized field of mathematical modelling of meta-
bolic pathways and their regulation; for those interested in this aspect I strongly
recommend Bernard’s chapter (Crabtree, 1993) and also articles by Brown
(1994), Kacser et al. (1995) and Hofmeyr and Cornish-Bowden (2000).
Levels of Metabolic Control
Within cells
Metabolic pathways
Within cells the fate of a nutrient is determined not only by the activity of relevant
enzymes but, in some cases at least, by: (i) translocases, reflecting the fact that the
ß CAB International 2005. Quantitative Aspects of Ruminant Digestion
and Metabolism, 2nd edition (eds J. Dijkstra, J.M. Forbes and J. France)
443
cell is highly structured and a metabolic pathway may be split between more than
one compartment, necessitating translocation of metabolites between compart-
ments; and (ii) binding proteins because some metabolites may have deleterious
effects at high concentration (e.g. long-chain fatty acids and their acyl-CoA
esters), hence binding proteins are used to protect against this.
In general terms a nutrient such as glucose, a fatty acid or an amino acid,
on entry into a cell, is first activated by a reaction involving ATP or another
nucleoside triphosphate. Subsequently the ‘activated’ nutrient will be further
metabolized, often by a branching metabolic pathway. Many studies have
focused on identifying and characterizing key rate-limiting enzymes of these
pathways. However, proponents of ‘metabolic control theory’ have made the
point that within a linear pathway the flux through each individual step will be
the same, and any step can be involved in determining the rate (Kacser et al.,
1995). Thinking has been coloured in part by studies of pathways of trypto-
phan synthesis and glycolysis in yeast and other microorganisms, which
showed that increasing the amount in individual compartments had little effect
on overall flux (Oliver, 2002). By contrast, studies with transgenic mice have
shown, for example, that increasing the amount of the glucose transporter,
Glut 4, in muscle and fat increased glucose uptake and subsequent rate of
metabolism (Wallberg-Henriksson and Zierath, 2001). While it is true that if
the activity of any component enzyme is reduced sufficiently it can constrain
the overall flux through a pathway, some enzymes are clearly more important
in this respect than others. Such enzymes catalyse essentially irreversible reac-
tions and are usually subject to complex control by covalent modification (e.g.
phosphorylation–dephosphorylation) and non-covalent control by metabolites
and other small molecules.
Enzyme phosphorylation most commonly involves key serine residues, and
can lead to activation (e.g. activation of hormone-sensitive lipase by protein
kinase A) (Yeaman et al., 1994) or inhibition (e.g. phosphorylation of acetyl-
CoA carboxylase (ACC) by AMP-stimulated kinase) (Barber et al., 1997).
Control can be complex: protein kinase A and AMP-stimulated kinase phos-
phorylate different serine residues of hormone-lipase which are separated by a
single amino acid; phosphorylation of one serine prevents phosphorylation of
the other (Yeaman et al., 1994). There are many examples of activity being
modulated by small molecules: in some cases a molecule interacts directly with
the catalytic site on the enzyme, in other cases the effector molecule interacts
with a distant site causing a conformational change which results in altered
activity (allosteric regulation). There can be simple product inhibition (e.g.
inhibition of hexokinases I and II by glucose-6-phosphate); inhibition by the
final product of a pathway (e.g. inhibition of ACC by fatty acids); inhibition by a
component of another pathway (e.g. inhibition of carnitine palmitoyl-CoA
transferase-1 by malonyl-CoA and methylmalonyl-CoA, intermediates of fatty
acid synthesis and propionate metabolism, respectively). It is not always inhib-
ition as glycogen synthase, for example, is activated by glucose-6-phosphate.
The complexity of control is illustrated by the fact that phosphofructokinase
is inhibited by both citrate and ATP (substrate) and activated by fructose-
6-phosphate (substrate), ADP (product) and AMP. In general, changes in
444 R.G. Vernon
phosphorylation are due to extracellular stimuli, whereas modulation by small
molecules is a response to intracellular stimuli.
Effective activity can also be modulated by translocation from one part of a
cell to another. For example, activation of hormone-sensitive lipase by cat-
echolamines in adipocytes results not only in increased enzyme activity, but also
a movement of the enzyme from the cytosol to the surface of the fat droplet
(Londos et al., 1999). Stimulation of glucose transport by insulin into adipo-
cytes and muscle cells involve a translocation of Glut 4-containing vesicles from
the interior of the cell to the plasma membrane (Mueckler, 1994).
The effective activity of an enzyme is also determined by the concentration
of the substrates. The importance of this depends on the concentration of
substrate relative to the affinity of the enzyme for the substrate. Thus for both
long-chain and short-chain (volatile) fatty acids, the K
m
of the activating en-
zymes is relatively high so flux varies with fatty acid concentration over the
normal physiological range (Bell, 1980). Similarly the K
m
of hepatic hexoki-
nase IV (glucokinase) is very high, so flux varies directly with glucose concen-
tration (Bollen et al., 1998). By contrast, the K
m
of muscle hexokinase for
glucose is very low; hence flux is less sensitive to glucose concentration.
The above mechanisms all provide for rapid changes in effective activity of
an enzyme and hence are of considerable importance for homoeostatic control
(see below). In addition there are changes in the amount of enzymes, translo-
cases and binding proteins, providing further, longer-term control. Amounts of
such proteins are determined both by synthesis and degradation, but in most
cases it is the former that is the key determinant.
Protein synthesis is regulated at the level of gene transcription and, in some
cases, translation of the corresponding mRNA. Gene expression is regulated by
promoters usually located upstream of the 5’ end of the coding region. The key
lipogenic enzyme ACC illustrates the complexity of control. This enzyme
occurs as two distinct isoforms, coded by different genes (Travers and Barber,
2001). ACC-a is the major isoform of the liver (in non-ruminants), adipocyte
and lactating mammary gland – all tissues with very high rates of lipogenesis.
ACC-b is found in a wider variety of tissues including heart and skeletal muscle;
ACC-b activity is lower than that of ACC-a, and is thought to have an import-
ant regulatory, rather than synthetic, role as its product, malonyl-CoA, is a key
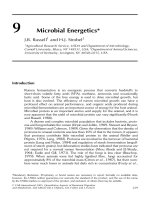
modulator of fatty acid oxidation (Zammit, 1999). ACC-a gene expression is
regulated by at least three promoters (Fig. 17.1), with expression by these
different promoters showing tissue specificity; PI is the major promoter of
adipocytes whereas PIII is important in lactating mammary tissue (Travers
and Barber, 2001). Most studies of this type have focused on non-ruminant
species, but in the case of ACC-a much of the data comes from work on sheep
tissue. Expression via the different promoters is under distinct physiological and
hormonal control. The decrease in ACC-a expression in sheep adipose tissue
during lactation, for example, is due mostly to a fall in expression via the PI
promoter with only a small decrease in expression via the PII promoter (Travers
and Barber, 2001). Regulation of gene expression via hormones and nutrients
is mediated by transcription factors, which bind to response elements in the
promoter regions of the gene.
Metabolic Regulation 445
Molecular biological approaches have not only revealed the complexity of
promoter systems, they have also shown that many proteins exist in more iso-
forms than previously thought. For example, a novel form of ACC-a was found in
sheep mammary gland, which has a missing sequence of eight amino acids prior
to a key serine that is thought to be important for control of ACC-a activity by
phosphorylation–dephosphorylation (Travers and Barber, 2001). Whether the
altered amino acid sequence influences the phosphorylation of this serine is not
known, but interestingly expression of this isoform of the enzyme in the mam-
mary gland is increased markedly by lactation (Travers and Barber, 2001).
Signal transduction pathways
As many hormones and growth factors have receptors in the plasma mem-
brane, signals have to be transmitted to sites within the cell via signalling
pathways. For some, e.g. catecholamine activation of lipolysis in adipocytes
and its antagonism by adenosine and prostaglandin E, the signalling pathway
appears to be well defined (Fig. 17.2).
However, for many hormones the pathways are only partly resolved. Thus
we know that insulin activates a series of branching pathways which mediate
effects on metabolism, protein synthesis, mitogenesis, etc. (Fig. 17.3), but
while early steps transmitting metabolic signals appear to be known, down-
stream effectors are still unresolved (Pessin and Saltiel, 2000; Litherland et al.,
2001). Furthermore, novel pathways continue to be identified. For example,
insulin stimulation of glucose transport in adipocyte and muscle cells is thought
to be mediated, in part at least, via the phosphoinositide-3 kinase/protein
AUG
AUG
Class 1
transcripts
Class 2
transcripts
Class 3
transcripts
5Ј untranslated region Exons represented in
5Ј untranslated region
Tissue distribution
Adipose tissue
Liver,
mammary
gland,
all other tissues
Mammary
gland
1,4,5
1,5
2,4,5
2,5
5A
10 20 30 40 50 60 70 kbp0
EXON 1
242 bp
EXON 2
96 bp
(EXON 3)
EXON 4
47 bp
EXON 5
250 bp
EXON 5A
422 bp
EXON 6
137 bp
P I P II P III
Fig. 17.1. Structure of the regulatory region of the ovine acetyl-CoA carboxylase-a gene
(adapted from Travers and Barber, 2001).
446 R.G. Vernon
kinase B pathway (Fig. 17.3), but recently a new pathway involving the proteins
TC10 and flotillin, which binds to lipid rafts in the plasma membrane, has been
implicated as well (Litherland et al., 2001).
For some important metabolic hormones, e.g. growth hormone, even
less is known. Frustratingly for this key hormone with its important chronic
homoeorrhetic metabolic effects (Bauman and Vernon, 1993; Etherton and
G
s
Catecholamines
G
i
PGE PGE
receptor
Adenosine Adenosine
receptor
Insulin Insulin
receptor
Cyclic AMP
phospho-
diesterase
Adenylate cyclase
Cyclic
AMP
ATP
AMP
A-kinase
(active)
Hormone sensitive lipase
(active, fat droplet)
Fatty acids,
glycerol
α
2
-receptor
β-receptor
A-kinase
(inactive)
Hormone sensitive lipase
(inactive, cytosol)
Triacylglycerol
Fig. 17.2. Lipolytic signalling cascade of adipocytes. PGE, prostaglandin E; G
s
, stimulatory GTP-
binding protein; G
i
, inhibitory GTP-binding protein.
Insulin
Insulin receptor
Insulin receptor substrate 1,2
shc
Phosphoinositide-3 kinase
MAP kinase
Protein kinase B
Protein kinase C zeta
Metabolic effects
Mitogenic effects
Fig. 17.3. Some of the insulin signal transduction system. MAP kinase, mitogen-activated
protein kinase; shc, src homology collagen-related protein.
Metabolic Regulation 447
Bauman, 1998) most research has focused on systems of questionable
physiological significance (a transient insulin-like effect seen in rodent tissue
after a period of abstinence from growth hormone, and a ‘commitment to
differentiation’ effect observed in a preadipocyte cell line) (Herrington and
Carter-Su, 2001). This reflects a tendency to study what is easy rather than
what is important!
To add to the complexity, we now know that many signal transduction
components exist in several isoforms; for example there are at least three iso-
forms of the b-adrenergic receptor (Carpene et al., 1998), two of the GTP-
binding protein G
s
, at least three isoforms of G
i
(Manning and Woolkalis, 1994)
and nine of adenylate cyclase (Simonds, 1999). The proportion of the different
isoforms varies with cell type and implies that the functions of the signal systems
will show subtle variations depending on the isoforms involved.
A confusing feature of signalling is that many hormones and related factors
appear to use the same intracellular signalling components, raising questions as
to how specificity of effect is achieved (Dumont et al., 2002). This could arise
from use of different isoforms or activation of components in different parts of
the cell. It may be that while a number of hormones may activate a similar
network of signalling pathways, the individual receptors may interact
slightly differently with the various components, thus achieving distinct, specific
outcomes (Dumont et al., 2002). As the various signalling pathways are
resolved, this problem of specificity should provide an interesting challenge
for modellers!
Within tissues
Tissues are composed of multiple cell types, which communicate with each
other via autocrine and paracrine signals that can influence the fate of nutrients
within a tissue. In addition, different cell types have different types and amounts
of transporters needed to move nutrients across the plasma membrane. Adi-
pose tissue, for example, comprises about 85% triacylglycerol by weight, but
adipocytes, while being very large cells, comprise only about 10% of the total
cell number of the tissue in the adipose tissue of adult sheep (Travers et al.,
1997). Other cell types include preadipocytes, endothelial cells and macro-
phages. The growing problem of obesity has focused much attention on
adipose tissue in recent years and we now know that it secretes a whole battery
of factors of various types (Table 17.1). Some substances are secreted by
adipocytes (e.g. leptin, adipsin), some by other cell types of the tissue (e.g.
interleukin-6, oestrone) and some by both (e.g. adenosine, prostaglandin E)
(Vernon and Houseknecht, 2000). Some (e.g. leptin, adiponectin, sex steroids)
are hormones and are released into the general circulation, influencing events
elsewhere in the body (Vernon, 2003). Many, however, are locally active and
may influence the fate of nutrients within the tissue. For example, there is an
apparent relationship between lipolysis in adipocytes and blood flow through
the tissue (Vernon and Clegg, 1985), and several locally produced factors
modulate both (Vernon and Houseknecht, 2000; Vernon, 2003).
448 R.G. Vernon
Fatty acids released from adipose tissue are transported in the blood bound
to serum albumin. Albumin has two high-affinity binding sites for fatty acids and
a further five low-affinity binding sites. The concentration of albumin in the
blood is about 0.5 mM, so 1 mM fatty acid will potentially saturate both high-
affinity binding sites; indeed a decreased release of fatty acids has been ob-
served when the concentration exceeded about 1 mM (Vernon and Clegg,
1985). The blood flow through sheep adipose tissue is about 50 ml=min=g
tissue before a meal (Barnes et al., 1983) and this will support a rate of fatty
acid release of about 50 nmol/min/g tissue. The limited amount of data
available suggests a rate of lipolysis of about 5 nmol fatty acid released per
min per g tissue in the fed state, rising to about 15 nmol/min/g tissue on
fasting in sheep (Vernon and Clegg, 1985). A substantial proportion of the
binding sites of albumin entering the tissue will already be occupied by fatty
acids in the fasted state, hence only a limited number will be free to accommo-
date newly released fatty acids. The various estimates come from a number of
different studies, but the general point is that blood flow, or to be precise free-
binding sites, has the potential to limit lipolysis.
Catecholamines both stimulate lipolysis and are vasoactive (Vernon and
Clegg, 1985). In addition, stimulation of lipolysis in sheep adipose tissue in vivo
by catecholamines resulted in a concomitant rise in prostaglandin E
2
(Doris
et al., 1996) which is vasodilatory and which also acts to attenuate lipolysis
(Crandall et al., 1997) (Fig. 17.4). The rise in prostaglandin E
2
production was
associated with a fall in glycerol output, due either to decreased lipolysis,
increased blood flow or both. Adenosine could have a similar role (Vernon,
1996a). It is also noteworthy that prostaglandin E
2
and adenosine are pro-
duced by the stromal-vascular cells of adipose tissue as well as adipocytes
(Vernon and Houseknecht, 2000). Indeed it has been suggested that prosta-
glandin production requires both adipocytes and stromal–vascular cells, arachi-
donic acid released from adipocytes being metabolized to prostaglandin by the
stromal–vascular cells (Richelsen, 1992).
Table 17.1. Some substances secreted by adipose tissue.
Metabolic modulators Hormones Complement system
Lipoprotein lipase Oestrone Factor B
Acylation-stimulating protein Oestradiol Factor C
Apoprotein E Testosterone Factor D (adipsin)
Fatty acids IGF-1
Prostaglandin E
2
Binding proteins
Adipocytokines IGF-binding proteins
Vasoactive factors Leptin Retinol-binding protein
Prostacyclin (prostaglandin I
2
) Tumour necrosis factor a Cholesterol ester transfer protein
Monobutryin Interleukin-6
Angiotensinogen/angiotensin II Resistin
Other
Atrial natriuretic peptide Adiponectin Plasminogen activator inhibitor-I
Metabolic Regulation 449
Between organs and tissues
Nutrients need to be apportioned appropriately between the various organs
and tissues of the body. Key factors are blood flow, metabolic capacity of cells
and hormonal and nervous signals.
Blood flow varies considerably from tissue to tissue (Table 17.2) and there
is even marked variation within some tissues such as skin (Bell et al., 1983;
Gregory and Christopherson, 1986). Differences in blood flow between organs
in general reflect the differences in metabolic activity (Table 17.3) (Rolfe and
Brown, 1997). A relationship between blood flow and metabolic activity within
an organ has been demonstrated for the mammary gland in lactating goats
(Linzell, 1974) and portal-drained viscera in sheep and cattle (see Chapter 12).
Blood flow, and hence nutrient supply, to a tissue varies with physiological and
nutritional state. For example, on feeding in sheep, blood flow increased to the
rumen epithelium and salivary glands, decreased to abdominal adipose tissue,
but did not change to heart, kidney and subcutaneous adipose tissue (Barnes
et al., 1983). The onset of lactation in goats results in a fivefold increase
compared to pregnancy in blood flow to the mammary gland (Linzell, 1974).
Exercise or stress induces marked changes in blood flow with a much greater
proportion of cardiac output going to skeletal muscle (Bell et al., 1983).
Blood flow is under complex control, involving paracrine and autocrine
factors (e.g. Fig. 17.4), hormones and the nervous system. Catecholamines are
vasoactive and can both accentuate and attenuate blood flow, depending on
which receptors are activated. Increased sympathetic activity during exercise,
for example, causes increased release of adrenalin from the adrenal medulla,
which increases blood flow through skeletal muscle. In adipose tissue increased
sympathetic activity can lead to initial vasoconstriction due to activation of
Nerve endings
Noradrenaline
(acute)
Noradrenaline
(chronic)
Angiotensinogen
Angiotensin II
Vasoconstriction
Blood flow
Adipocyte
Lipolysis
Stromal
vascular cells
Adenosine
Vasodilation
PGE
2
PGI
2
PGE
2
20:4
20:4
(+)
(−)
(−)
Fig. 17.4. Modulation of lipolysis and blood flow by local factors in adipose tissue. PGE
2
,
prostaglandin E
2
; PGI
2
, prostaglandin I
2
(prostacyclin); 20:4, arachidonic acid.
450 R.G. Vernon
a-adrenergic receptors, followed by vasodilatation due to activation of b-
adrenergic receptors (Vernon and Clegg, 1985).
Access by nutrients to most cells requires their passage from the blood to
the extracellular space. Endothelial cell permeability thus provides another
means of manipulating nutrient fate (Vernon and Peaker, 1983). The liver in
particular has a very ‘leaky’ endothelium, reflecting the important role of the
liver in the uptake and degradation of proteins and even larger structures such
Table 17.2. Blood flow of various tissues in sheep (data from Barnes
et al., 1983; Bell et al., 1983; Gregory and Christopherson, 1986;
Weaver et al., 1990).
Tissue Blood flow (ml/min/100 g)
Brain 69, 70
Heart 62, 95, 110, 154
Kidney 460, 550, 650
Lactating mammary gland 50
Gastrointestinal tract
Rumen 24, 112
Abomasum 67, 105, 204
Small intestine 60, 62, 130
Large intestine 48, 64, 80, 105
Liver – hepatic artery 4, 8, 13
Liver – hepatic portal vein 285
Skeletal muscle 2, 9, 10–65
Adipose tissue 0.3, 4, 8–23
Skin 1–13, 3, 2–20
Table 17.3. Tissue oxygen use as percentage of whole body oxygen use and blood flow as
percentage of cardiac output in sheep (data also from A.W. Bell, unpublished observations).
Tissue
Oxygen use
(per cent use by
whole body)
Blood flow
(per cent cardiac output)
Hales
(1973)
Weaver et al.
(1990)
Gastrointestinal tract 20 33 28
Liver 20 – 5.8
a
Brain 10 2.3 2.6
Heart 10 6.9 4.8
Kidney 8 16.5 19
Skeletal muscle 20 12 15.6
Bone 5 – 3.9
Skin 7 (skin and adipose
tissue combined)
13 7.5
Adipose tissue – 1.5
a
Via hepatic vein; liver also receives blood from gastrointestinal tract via hepatic portal vein.
Metabolic Regulation 451
as lipoprotein remnants. By contrast, the brain has a very tight endothelium,
creating the so-called ‘blood–brain barrier’.
The cellular distribution of translocases and the nature of the isoforms have
important roles in determining the partitioning of nutrient between organs/
tissues. For example, there are at least six well-characterized glucose trans-
porters involved in transport across the plasma membrane (Mueckler, 1994;
Hocquette et al., 1996) and new ones continue to be discovered. The Glut-4
transporter is insulin-sensitive and is found in adipocytes and myocytes – cells
with a high capacity for glucose metabolism (Mueckler, 1994; Hocquette et al.,
1996). Thus, if plasma glucose is increased, for example after a meal, the
concomitant rise in serum insulin will cause a preferential uptake of glucose by
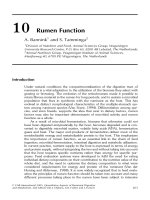
cell types expressing Glut-4. Even in ruminants, which are thought to be less
responsive to insulin than most non-ruminants, insulin-infusion induced a six-
fold increase in glucose uptake across the hind limb of mature sheep (Fig. 17.5).
The corollary, of course, is that when serum insulin and glucose concentrations
are low as during fasting, utilization of glucose by other tissues (e.g. brain) will
be favoured.
Fatty acids are mostly supplied to tissues either as non-esterified fatty acids
(NEFA) bound to albumin or as a part of triacylglycerols, which are transported
as part of very low-density lipoproteins (VLDL) secreted by the liver, and
chylomicrons secreted by the gastrointestinal cells. VLDL and chylomicrons
are too large to cross the endothelial cell barrier, so triacylglycerols are hydro-
lysed by the action of lipoprotein lipase, an enzyme secreted by a variety of cells
including adipocytes, myocytes and mammary epithelial cells (Barber et al.,
1997). Following secretion it is transported to the luminal surface of the
0 2 10 20 30 406
0.4
0.8
1.2
0
Blood insulin (µg/I)
Glucose uptake (mM)
Fig. 17.5. Effect of insulin on glucose arteriovenous difference across the hind limb of lactating
(*) and non-lactating (*) sheep (data from Vernon et al., 1990).
452 R.G. Vernon