Tài liệu Quantitative aspects of ruminant digestion and metabolism - Phần 14 docx
Bạn đang xem bản rút gọn của tài liệu. Xem và tải ngay bản đầy đủ của tài liệu tại đây (360.54 KB, 54 trang )
18
Mineral Metabolism
E. Kebreab
1
and D.M.S.S. Vitti
2
1
Centre for Nutrition Modelling, Department of Animal & Poultry Science,
University of Guelph, Guelph, Ontario, N1G 2W1, Canada;
2
Animal Nutrition
Laboratory, Centro de Energia Nuclear na Agricultura, Caixa Postal 96, CEP
13400-970, Piracicaba, SP, Brazil
Introduction
The number of mineral elements that have been shown to have essential
functions in the body has been increasing steadily since the 1950s. Major or
macrominerals are required in relatively larger quantities (>50 mg=(kg DM)) and
include calcium, phosphorus, potassium, sodium, sulphur, chlorine and mag-
nesium. Trace or microminerals include iron, zinc, copper, molybdenum, sel-
enium, iodine, manganese, cobalt, chromium, fluorine, arsenic, boron, lead,
lithium, nickel, silicon, tin and vanadium. Due to lack of space, all the minerals
and their quantitative aspects of metabolism cannot be discussed in detail here.
As in the previous edition of the book, we chose to focus on quantitative aspects
of two minerals. From the macro elements, phosphorus is taken as an example
mainly because it is the element which has been a subject of much research in
recent years due to concerns of overfeeding phosphorus to ruminants and the
contribution to environmental pollution. The principles outlined are also applic-
able to other macrominerals such as calcium. A model of magnesium metabol-
ism in sheep was developed by Robson et al. (1997) and modified by Bell et al.
(2005) which followed similar principles. Symonds and Forbes (1993) took
copper as an example of trace elements and discussed its metabolism. Although
research in trace elements has not had the progress of the 1970s and 1980s,
especially in terms of development of steady state (kinetic models) and dynamic
modelling, we have updated the information on copper metabolism.
Phosphorus
Phosphorus (P) is an essential nutrient involved not only with bone develop-
ment, growth and productivity, but also with most metabolic processes of the
body. Phosphorus and calcium (Ca) are the two most plentiful minerals in the
ß CAB International 2005. Quantitative Aspects of Ruminant Digestion
and Metabolism, 2nd edition (eds J. Dijkstra, J.M. Forbes and J. France)
469
mammalian body. These elements are closely related so that deficiency or
overabundance of one may interfere with the proper utilization of the other.
Phosphorus constitutes 1% of the total body weight, 80% of which is found in
the bones. The remaining 20% is distributed in body cells where it is involved in
maintaining the structural integrity of cells and in intracellular energy and
protein metabolism (McDowell, 1992). Most of the Ca in ruminants (99%) is
found in the bones and teeth and the remaining 1% is distributed in various soft
tissues of the body. In a 40 kg sheep there are approximately 400 g Ca and
220 g P, distributed between bones and teeth (CSIRO, 1990). Phosphorus is
present in bone in the hydroxy-apatite molecule, where it occurs as tricalcium
phosphate and magnesium phosphate. The Ca:P ratio in bone is almost
constant at 2:1.
Adequate P nutrition is dependent upon different interrelated factors: (i)
sufficient supply of the element is essential; (ii) suitable ratio of Ca:P, ideally
between 2:1 and 1:1; however adequate nutrition is possible outside these
limits (Thompson, 1978); and (iii) the presence of vitamin D. With sufficient
vitamin D in the diet, the Ca:P ratio becomes less important (Maynard and
Loosli, 1969). If P intake is marginal or inadequate a close ratio of Ca:P
becomes most critical (McDowell, 1992).
Types of models
Quantitative aspects of P metabolism in ruminants have been considered using
balance studies (e.g. Braithwaite, 1983), kinetic models based on experiments
in which radioactive tracers were used (e.g. Vitti et al., 2000), compartmental
(e.g. Schneider et al., 1987) and mechanistic models (Symonds and Forbes,
1993; Kebreab et al., 2001, 2004). These mathematical approaches used in
investigating P metabolism in ruminants can be broadly classified into empirical
and mechanistic types of modelling. For example, approaches based on re-
gression analysis (e.g. efficiencies of utilization of P as determined by
Braithwaite, 1983) are empirical while mechanistic approaches are process-
based such as the dynamic model presented in this chapter. Mechanistic models
can be of three types depending on the solutions of the equation statements
(see Dijkstra et al., 2002). In steady state, Type I models obtain solutions by
setting differentials to zero and manipulating to give algebraic expressions for
each process (e.g. model reported by Vitti et al., 2000). In non-steady state,
Type II models solve rate:state equations analytically. Type III models solve
complex cases of rate:state equations numerically in non-steady state (e.g.
model developed in this chapter). Most models used for P analysis in ruminants
are Type I and III. In the following paragraphs, examples of empirical models
are discussed first, followed by kinetic models and finally the mechanistic
P model of Kebreab et al. (2004) will be slightly modified and evaluated.
Empirical models
Most of the models for calculating P requirements are based on a factorial ap-
proach by adding requirements for various physiological processes such as main-
470 E. Kebreab and D.M.S.S. Vitti
tenance, growth, pregnancy and lactation. Such models compute the require-
ment of an animal for minerals for a predetermined level of production.
Most European and American national standards for requirements of P are
based on this approach. For example, in NRC (2001), absorbed P requirement
for maintenance for growing animals was calculated to be 0.8 g/kg DMI (with
0.002 g/kg W allowance for urinary P) based on P balance studies. AFRC
(1991) empirically calculated P requirements for growth (P
reqg
; g/day) in cattle
as follows:
P
reqg
¼ [1:6(À0:06 þ 0:693DMI)
þ WG(1:2 þ 4:635A
0:22
W
À0:22
)]=0:58
(18:1)
where DMI is dry matter intake (kg/day), WG is liveweight gain (kg/day), A is
mature body weight (kg) and W is the current liveweight (kg). For a 600 kg cow
producing 25 kg of milk, the recommended dietary P intake according to the
German feeding standards is 61 g/day (GfE, 2001) which is slightly lower than
that recommended by Kebreab et al. (2005a) (67 g/day) based on their ex-
perimental results.
Mechanistic models
STEADY-STATE (TYPE I) MODELS
.
Several approaches have been made to develop
steady-state models mainly using results of experiments carried out with
radioactive tracers (Schneider et al., 1985, 1987; Vitti et al., 2000). The
models are based on the kinetics of
32
P which is intravenously injected into the
ruminant and its distribution within the body traced. Schneider et al. (1987) used
eight compartments in the body to represent P pools in blood, soft tissues, bone,
rumen, abomasum and upper small intestine, lower small intestine, caecum and
colon and kidney. Analysis of
32
P tracer data was conducted using a
compartmental analysis computer program (Boston et al., 1981). Schneider
et al. (1987) reported that the main control site for P excretion was the
gastrointestinal tract and model predictions were sensitive to the parameters
describing absorption or salivation. In ruminants, a substantial amount of P is
recycled through saliva. Salivation rate was also found to be a major controlling
factor in urinary P excretion: decreasing salivation rate increased P
concentrations in plasma and resulted in more P being excreted via urine.
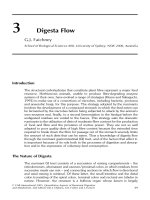
Using data from balance and kinetic studies, a model of P metabolism in
growing goats fed increasing levels of P was proposed by Vitti et al. (2000)
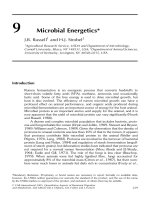
(Fig. 18.1). The model has four pools (gut (1), blood (2), bone (3) and soft
tissues (4)) and P enters the system via intake (F
10
) and exits via faeces (F
01
) and
urine (F
02
). The daily intake and loss of P in faeces and urine were measured by
chemical analysis. Endogenous P and P absorption were calculated from the
specific activities (Vitti, 1989). The gut lumen, bone and soft tissue pools
interchange bidirectionally with the blood pool, with fluxes F
21
and F
12
, F
23
and F
32
and F
24
and F
42
, respectively. Labelled
32
P was administered as a
single dose, D cpm, at time zero, and the size and specific activity of the blood,
bone and soft tissues pools were measured after 8 days. The scheme assumes
there is no re-entry of label from external sources.
Mineral Metabolism 471
Vitti et al. (2000) postulated that with P intakes insufficient to meet
maintenance requirements, the input of P to the blood pool is maintained
by an increased bone P resorption and by P mobilization from soft tissues.
Compared to goats fed high P diets, those on a low P diet had 74% more
P mobilized from bone to blood. Despite the low P intake leading to a negative
P balance, an inevitable endogenous faecal loss of P occurs. The minimum
endogenous loss of P from the goats was 67 mg/day which must be absorbed
to avoid being in negative balance. When P intake is increased to meet the
maintenance requirements (zero P balance), the rate of absorption is increased
in direct relation to P supply, so endogenous secretion in the tract is increased.
The maintenance requirement of Saanen goats for P was calculated to be
610 mg/day or 55 mg/kg W
0:75
/day. The model showed that bone resorp-
tion, faecal and endogenous P excretion and P absorption all play a part in
P homoeostasis in growing goats. Urinary P excretion did not significantly
influence the control of P metabolism even in goats fed relatively high P level
diets. At low P intakes, bone and tissue mobilization represented a vital process
to maintain P levels in blood. Vitti et al. (2002) also adapted the model to
illustrate the different processes that occur in goats fed various Ca levels and
showed that Ca intake influenced absorption, retention and excretion of Ca
(Vitti et al., 2002). The model could be used to investigate P metabolism not
only in goats but also in other ruminants as well.
Grace (1981) used a compartmental P model to represent P flow in sheep.
The model was comprised of four compartments which together represent the
total exchangeable P pool (M
T
), the gut and non-exchangeable bone and soft
tissues. Phosphorus flow to M
T
is from the gut and in a steady state is equal to
the outflow. The outflow of P from the total pool consists of the urinary P,
faecal endogenous loss of P, P deposition into non-exchangeable bone and the
4
1
2
3
F
10
F
01
F
12
F
21
F
23
F
32
F
42
F
24
F
02
Gut
Soft tissue
Blood
Fig. 18.1. Schematic representation of the model of P metabolism in goats. F
ij
is the total flux of
pool i from j, F
i0
is an external flux into pool i and F
0j
a flux from pool j out of the system. Circles
denote fluxes measured experimentally (Vitti et al., 2000).
472 E. Kebreab and D.M.S.S. Vitti
uptake by soft tissues. The total P inflow to the total exchangeable P pool is the
sum of the P absorbed from the digestive tract and the P removed from the
bone and soft tissues. P absorption from the gut is calculated as the difference
between P intake and faecal P output, after correcting for the faecal endogen-
ous P losses. Grace (1981) found that most of the P was excreted via faeces
with only small amounts excreted in urine. However, as P intake increased,
Grace (1981) found that proportionally more of the P lost from the body was
excreted in the urine rather than returned to the digestive tract via the saliva.
NON-STEADY-STATE (TYPE III) MODELS
.
A dynamic P model of Kebreab et al.
(2004) integrating information from various sources including the flow diagram
described by Symonds and Forbes (1993) and the state variables of Vitti et al.
(2000) is modified. The fluxes between pools and excretion parameters are
estimated based on a wide range of sources. Sensitivity of selected parameter
estimates were carried out and the model was then tested on independent data
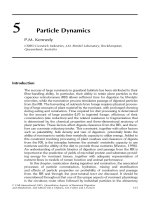
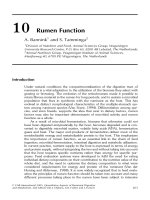
that were not used in the construction of the model. For clarity, the model can
be seen as having four P compartments: rumen, small intestine (including
duodenum), large intestine and extracellular fluid. In total, the model contains
11 state variables or pools, and arrows (Fig. 18.2) represent inputs and outputs
to and from the pools. The standard cow was assumed to weigh 600 kg with a
rumen volume of 90 l and non-pregnant. The input of P to the cow is via the
diet and the outputs are in faeces, urine and milk.
The simulation model uses the dynamic rumen model of Dijkstra et al.
(1992) and its subsequent modification (Dijkstra, 1994) to estimate rumen
microbial synthesis and microbial outflow to the duodenum. In the rumen,
two forms of P are represented based on digestibility. The digestible rumen P
pool has two inputs, from the diet and saliva. P is consumed by the animal as
organic (phytates, phospholipids and phosphoproteins) and inorganic P
(mono-, di- and triphosphates). Soluble forms, some insoluble forms and phos-
phoric acid are dissolved by digestive juices in the rumen. Phytate is dissolved in
the rumen by action of phytases produced by the microbes. The availability of P
in the diet has been the subject of many investigations (e.g. Koddebusch and
Pfeffer, 1988). ‘True absorption’ coefficients have been used to describe the
amount of dietary P absorbed but this does not show the potentially available
dietary P because true absorption coefficients decline with P intake. Wu et al.
(2000) use 85% as the maximum amount of digestible P, which is also used
here as the potentially available dietary P for microbial growth and passage to
the lower tract.
Kebreab et al. (2005b) reported that, on average, 45% of P entering the
rumen comes from saliva, as endogenous P, and plays a significant role as a
buffer and is also important as a nutrient source for rumen microbes (Care,
1994). The salivation rate is based on the equation of Dijkstra et al. (1992)
which was related to DMI and NDF content of the diet. Estimates of saliva
production based on experiments of Valk (2002) were within 10% of those
predicted by the equation. The concentration of P in the saliva depends on the
P status of the animal and at steady state, the model calculations were influ-
enced by P concentrations in the diet and extracellular fluid.
Mineral Metabolism 473
Phosphorus is an important component of the cell membrane and is essential
for microbial growth. The bacterial and protozoal P pools in the rumen have
an input from the digestible rumen P pool. Czerkawski (1976) estimated P
contents of protozoa, large and small bacteria in the rumen to be 13.8, 13.3
and 18.8 mg/g of polysaccharide-free microbial DM, respectively. These are at
the lower end of concentrations estimated by Hungate (1966) who reported that
rumen microbe cells contain 20–60 mg P/g DM, and are present as nucleic acids
(80%), phospholipids (10%) and other compounds. The values are closer to
Durand and Kawashima’s (1980) estimate of 1.44% for an average P content of
rumen bacteria. The rumen model of Dijkstra (1994) estimates protozoal and
bacterial polysaccharide-free DM, therefore, P contents of 13.8 and 17.9 mg/g
polysaccharide-free DM (assuming a ratio of 5:1 of small:large bacteria in
the rumen liquor (Czerkawski, 1976)) for protozoa and bacteria, respectively,
Salivary P
4
1
Extracellular fluid
Dietary P
Pregnancy
Faeces
Urine
Milk
2
3
Bone and
soft
tissue
Indigestible P
Protozoal P
LI
indigestible P
SI
indigestible P
Bacterial P
Bile P
Microbial P
SI
digestible P
LI
digestible P
Digestible
P
Fig. 18.2. Schematic representation of the model of P metabolism in the ruminant. The
compartments were rumen (1), small intestine (2), large intestine (3) and extracellular fluid (4).
474 E. Kebreab and D.M.S.S. Vitti
were used in the model. High P concentrations occur in the rumen, ranging from
200 to 600 mg/l (Witt and Owens, 1983).
Bacteria are assumed to pass to the small intestine at a rate of 5.1% per
hour but protozoa, due to their larger size and ability to adhere to particles in
the rumen, pass at 45% of the rate of bacteria (Dijkstra, 1994). The ruminal P
that was not incorporated into microbial cells is assumed to pass to the duode-
num at a fractional outflow rate of fluid of 8.3% per hour. Phosphorus from the
indigestible P pool in the rumen is assumed to pass to the small intestine at a
particulate fractional passage rate of 4.0% per hour.
Microbial P constitutes a major proportion of P entering the small intestine.
Pancreatic ribonuclease breaks down microbial RNA and P is released (Bar-
nard, 1969). It is generally accepted that the upper small intestine, where the
pH of the digesta is acid, is the major site for P absorption (Breves and
Schro
¨
der, 1991). Studies have been carried out to define how P is absorbed
in ruminants and it is suggested that two processes may be involved: one, a
passive process, related to intake, and the other, an active process, related to
demand (Braithwaite, 1984). It is suggested that a substantial portion of the
active transport consists of a sodium-dependent P transport mechanism
(Schro
¨
der et al., 1995). The small intestinal digestible P pool has inputs from
the rumen (microbial matter and free P) and endogenous P (mostly in bile). The
outputs of P from the digestible P pool in the small intestine are P absorbed into
the extracellular fluid pool and ‘regulated’ P excretion to the large intestine.
A Michaelis–Menten type saturation equation was used to describe the absorp-
tion of P from small intestine to the extracellular fluid (P
ab
) as follows:
P
ab
¼ 90:1=[1 þ (0:91=C
IP
)] (18:2)
where C
IP
is concentration of absorbable P in intestine (g/l). Maximum theor-
etical absorption through this process was 90 g/day and the parameters were
optimized by the model. Unabsorbed digestible P, which includes endogenous
P, is assumed to pass to the large intestinal digestible P pool at the same
fractional passage rate as for fluid. Endogenous faecal P is one of the most
important pathways responsible for almost 80% of P leaving the animal
(McCaskill, 1990). Undigested microbial P and indigestible dietary P in the
rumen are inputs to the indigestible P in small intestine and P from this pool
passes to the large intestine at a particulate matter passage rate of 4.0% per
hour.
The large intestine of sheep has the capacity to absorb significant quantities
of P (Milton and Ternouth, 1985), but this capacity does not appear to be used
due to the low concentration of ultrafiltrable P. Most of the P is present as
insoluble or nucleic acid (Poppi and Ternouth, 1979) in the large intestine.
Yano et al. (1991) concluded that in sheep, little absorption or secretion of P
appears to occur either in the rumen or large intestine. The potentially digest-
ible and indigestible P in large intestine are excreted in faeces at a fractional
passage rate of the large intestine (10.6%/h, Mills et al., 2001). Due to
selective retention of microbial matter within the caecum, microbial passage
rates were 85% of large intestinal digesta passage rate.
Mineral Metabolism 475
Inputs to the extracellular fluid pool are from P absorbed post-ruminally
and from bone resorption. The outputs are to the lower tract (via bile), bone
absorption, secretion in milk and excretion in urine. If a pregnant cow is
assumed, utilization by the pregnant uterus needs to be an output from this
pool. The volume of the pool was set at 20% of liveweight (Ternouth, 1968).
Digestible P in small intestine (microbial, dietary and salivary P) passed to the
small intestine, which is not excreted as ‘regulated P’ is assumed to have been
absorbed. Besides its structural function, bone represents a reserve of P.
According to Sevilla (1985), when P deficiency occurs more than 40% of
the animal requirement can be supplied by bone resorption depending on the
severity of P deficiency. As shown in the small intestine compartment, there is
secretion of P to the small intestine through bile, which was estimated by the
model. Milk P output is directly related to milk yield as milk P concentration is
constant (NRC, 2001). P secreted in milk was calculated as 0.9 g/kg of milk
(Fox and McSweeney, 1998). In the current study the cow is assumed to be
non-pregnant so there is no P deposition in the uterus. Ruminants usually
excrete very little P in their urine when they are fed roughage diets and it is
generally accepted that major variations in P balance are, in these circumstan-
ces, more dependent on the gut than on the kidney (Scott, 1988). Many studies
have shown that urinary P excretion is related to P concentration in extracel-
lular fluid (e.g. Challa and Braithwaite, 1988). Based on experiments of Challa
and Braithwaite (1988), urinary P excretion was described by an exponential
equation, where at lower levels of P concentration (<1:8 mmol=l) urinary P is
relatively unimportant but increases significantly as P concentration in extra-
cellular fluid rises.
Phosphorus in tissue can be present as lecithin, cephalin and sphingomye-
lin and in blood as phospholipids (Cohen, 1975). Blood is the central pool of
minerals that can be promptly available. Total blood contains 350–450 mg
P/l, mostly present in the cells. Plasma P is present mainly as organic com-
pounds and the remainder is in inorganic form, as PO
4
,HPO
4
and H
2
PO
4
(Georgievskii, 1982). Normal levels for sheep are between 40 and 90 mg P/l
and values lower than 40 mg are indicative of deficiency (Underwood and
Suttle, 1999). There is a correlation between inorganic P in plasma and P
intake for animals fed deficient to moderate P levels (Ternouth and Sevilla,
1990; Scott et al., 1995). However, at high P intakes, inorganic P plasma
levels begin to stabilize. For sheep, levels of 27, 64 and 101 mg P/kg LW are
considered deficient, moderate and adequate, respectively (Braithwaite, 1985).
In cattle, P intake varying from 27.1 to 62.5 mg P/kg LW resulted in P plasma
levels of 47 and 77 mg/l, respectively. In contrast, some authors did not
observe a clear correlation between P intake and plasma levels (Louvandini
and Vitti, 1994; Louvandini, 1995).
Homoeostatic mechanisms in ruminants depend mainly on the reabsorp-
tion of P in the kidney and P secreted in saliva. A substantial amount of P
recycling takes place through saliva. The rate is influenced by the quantity and
physical form of the diet and by P intake (Scott et al., 1995).
Saliva normally contains 200–600 mg P/l but a variation of 50 to
1000 mg/l can occur (Thompson, 1978). The amount of P secreted in saliva
476 E. Kebreab and D.M.S.S. Vitti
has been reported to be directly related to blood inorganic P concentration.
Salivary P secretion was found to increase in direct relation to P intake and P
absorption (Challa and Braithwaite, 1988). Salivary P, because it is in inorganic
form, is easily available to rumen microbes. On average, salivary P inputs
represented 45–50% of the total P flow at the duodenum assuming no net
absorption of P from the rumen (Ternouth, 1997; Shah, 1999). It has been
reported that the salivary P secretion accounts for about 70% of total endogen-
ous P entering the alimentary tract of sheep (Annenkov, 1982) and represents
a major route of P excretion (Young et al., 1966).
P homoeostasis is normally maintained by control of absorption, excretion,
secretion into the gut and accretion in or resorption from bone. Homoeostasis
is simulated in the model by estimating key parameters that control movement
of P in the different pools of the body of the animal. Sensitivity analysis was
conducted to investigate how variations in these parameters affect model
predictions.
When the extracellular fluid volume was set at þ/À 50% of the model value
(i.e. 0:2Âlive weight), initially there were changes in P concentrations in
extracellular fluid and saliva but, as the model reached steady state, there
were no changes in the predictions of the model. The saliva production per
kg DMI was also varied by þ/À 50% of the model value. Reduction of saliva
production resulted in lower amounts of P getting into the rumen and P
concentrations in saliva increased by about 40% to facilitate the removal of P
from extracellular fluid and compensate for the volume of saliva produced. On
the other hand, when saliva production per kg DMI was increased, P concen-
tration in saliva decreased by about 36% and saliva P entering the rumen
increased slightly. Reducing saliva production slightly decreased faecal P (be-
cause of less P of endogenous origin entering the duodenum) and P concen-
tration in extracellular fluid. Urinary P excretion was unaffected because the
increase in extracellular fluid P concentration did not reach the threshold.
Increasing saliva production also did not affect urinary P excretion because P
concentration in extracellular fluid was slightly reduced.
Information from published reports was used to simulate P mobilization
in the cow and comparison of predicted and observed values are shown in
Table 18.1. The report by Wu et al. (2000) was chosen because it illustrated
P partition in the animal based on experimental results. Spiekers et al.
(1993) suggested that faecal P may be partitioned into three fractions: (i) the
unavailable part of dietary P which is not absorbed; (ii) the inevitable loss or
endogenous P fraction which is excreted as a consequence of normal physio-
logical and metabolic events in the animal; and (iii) the regulatory part, that
depends on the extent to which actual supply of potentially available dietary P
exceeds requirement. The simulation results are reported in such a way that it is
possible to identify the various factors that contribute to faecal P excretion
(Table 18.1).
Estimated P secretion in milk and unavailable P excretion in faeces are the
same in both models because the parameters were set as constants based on
milk yield and P intake, respectively. Although Wu et al. (2000) estimated
higher faecal P at higher P intakes, there was a general agreement in the
Mineral Metabolism 477
total faecal P excreted. The differences at higher intakes were possibly because
urinary P was underestimated by the predictions of Wu et al. (2000).
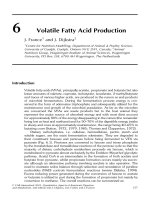
Experiments of Wu et al. (2000) and Morse et al. (1992) were used to
provide inputs for model simulation. Figure 18.3 shows that there was a close
agreement between model predictions and experimental results. Separate lines
for model predictions were required because the experiments had different DMI
and milk production, which modified the way the model predictions work.
The model can be extended to other ruminants by adjusting key param-
eters such as rumen and blood volume. There could be considerable intraspe-
cies differences in P metabolism, which could be influenced by a number of
factors. P interacts with other minerals, especially calcium, and responds to
levels of vitamin D and endocrine factors. These issues need to be addressed to
improve our understanding of P metabolism and better predict differences in P
responses within species.
We anticipate that the dynamic model will help to a better understanding of
P metabolism and lead to formulation of diets which will reduce environmental
pollution of P without compromising animal performance or health. This can
be done by matching the ruminant’s requirement for various physiological
Table 18.1. Comparison of model predictions for P in different pools with values reported by
Wu et al. (2000).
Faeces (g P per day)
Intake Saliva
a
Urine Mbl
b
Milk MblMt
c
UnAv
d
Reg
e
Total
Model simulation
60 38.8 0.96 39.3 40.0 20.8 9.00 0.33 30.1
72 57.9 2.18 39.3 40.0 20.9 10.8 3.07 34.8
84 69.1 3.50 39.3 40.0 21.4 12.6 8.79 42.8
96 75.8 4.68 39.3 40.0 21.8 14.4 15.8 51.9
108 81.1 5.91 39.3 40.0 22.7 16.2 23.8 62.6
120 86.7 7.51 39.3 40.0 23.9 18.0 29.8 71.7
132 93.0 9.83 39.3 40.0 25.0 19.8 35.5 80.3
Wu et al. (2000)
60 ND
f
1.00 40.0 21.5 9.00 0.00 30.5
72 ND 1.00 40.0 21.5 10.8 3.50 35.8
84 ND 1.00 40.0 21.5 12.6 8.90 43.0
96 ND 2.00 40.0 21.5 14.4 18.6 54.0
108 ND 2.00 40.0 21.5 16.2 28.3 66.0
120 ND 3.00 40.0 21.5 18.0 37.4 77.0
132 ND 5.00 40.0 21.5 19.8 45.6 87.0
a
Saliva, salivary P incorporated in the rumen (g/day).
b
Mbl, total microbial P outflow to the duodenum (g/day).
c
MblMt, microbial and metabolic P output to faeces (g/day).
d
UnAv, unavailable dietary P (g/day).
e
Reg, regulated P (g/day).
f
ND, not determined.
478 E. Kebreab and D.M.S.S. Vitti
processes with dietary P intake, which can be simulated using the dynamic
model.
Copper
Copper (Cu) is an essential trace element required for enzyme systems, iron
metabolism, connective tissue metabolism and mobilization, plus integrity of
the central nervous and immune systems. The essentiality of Cu in ruminants
had long been established when evidence was found that Cu is required for
growth and prevention of disease (McDowell, 1992). Copper has also been
reported to affect lipid metabolism in high-producing dairy cows and beef cattle
(Engle et al., 2000, 2001). In many parts of the world, Cu deficiency has been
identified as a serious problem for grazing ruminants under a wide range of soil
and climatic conditions (Ammerman et al., 1995).
Copper requirements and absorption
Dietary Cu requirements vary greatly among species. Dairy cattle can toler-
ate higher dietary levels of Cu than can safely be fed to sheep. Copper
Phosphorus intake (g/day)
0 50 60 70 80 90 100 110 120
Faecal phosphorus excretion (g/day)
0
30
40
50
60
70
80
Fig. 18.3. Comparison of faecal P excretion in relation to P intake between experimentally
observed values (symbols) and model predictions (lines). Solid and broken lines are model
predictions based on experiments conducted by Wu et al. (2000) (*) and Morse et al. (1992) (&),
respectively.
Mineral Metabolism 479
requirements for an adult lactating cow (producing 30 kg milk per day) accord-
ing to ARC (1980) were estimated to be 163 mg/day or 8 to 11 mg Cu/kg
DM. In NRC (2001), the requirement for the same animal was 200 mg/day of
dietary Cu. The higher requirement in NRC (2001) was an extra 50% allow-
ance in milk Cu content. The requirement for adult sheep (50 kg) was 3.7 mg/
day or 4.6 to 7.4 mg Cu/kg DM. Copper requirement for goats was suggested
to be 10 to 20 mg/kg diet DM (TCORN, 1998). Copper toxicity has been
reported to be a problem if animals ingest quantities that cannot be cleared by
the liver. The levels at which toxicity occur depend on species. Non-ruminants
are more tolerant while cattle and goats are less tolerant than sheep (Under-
wood and Suttle, 1999). There appears to be a delicate balance and narrow
differential between Cu requirement and toxicity in sheep (Kellems and Church,
2002).
Copper requirements of ruminants depend on the absorbability rather than
the concentration of Cu in the diet (Underwood and Suttle, 1999). The pre-
ruminant animal absorbs Cu with an efficiency of 50–70% (ARC, 1980).
However, with the development of the rumen, Cu absorption drops to less
than 10%. This is mainly due to digestive processes in the rumen and the
presence of sulphide that binds Cu and precipitates it as Cu sulphide, which is
not absorbable (Suttle, 1991). The extent of Cu absorption is largely influenced
by interactions with molybdenum (Mo), sulphur (S) and iron, which form
complex chemicals and limit absorption in the gastrointestinal tract. The ab-
sorbability of Cu also depends on the sources of Cu for ruminants. In silages,
Mo has a small and little studied effect on absorbability. Absorbable Cu (A,%)in
ruminants fed fresh grass was described by the equation:
A ¼ 5:7 À 1:3S À 2:785ln (Mo) þ 0:227(Mo  S) (18:3)
where Mo is given in mg/kg DM and S in g/kg DM (Underwood and Suttle,
1999).
Modelling copper metabolism
Quantitative descriptions of Cu metabolism available in the literature are largely
dependent on empirical modelling and limited mechanistic modelling based on
kinetic studies. The main kinetic models were those of Weber et al. (1980,
1983) using
64
Cu in sheep, Gooneratne et al. (1989) using
67
Cu in sheep, and
Buckley (1991) using the stable isotope
65
Cu in lactating dairy cows. Symonds
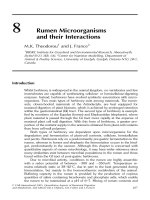
and Forbes (1993) developed a framework of a mechanistic model of the
possible routes of movements of Cu in the ruminant body based on kinetic
models of Cu metabolism in sheep (Weber et al., 1980; Gooneratne et al.,
1989) (Fig. 18.4). The boxes in Fig. 18.4 represent pool sizes and input,
output and between-pool fluxes can be estimated from balance trials or injec-
tion of radioactive markers and sampling of tissues over time.
Homoeostasis of Cu in ruminants is achieved predominantly by hepatic
storage and biliary secretion (Underwood and Suttle, 1999). Copper metabol-
ism in the liver has been represented by more than one compartment based on
the information available to resolve Cu mobility and the species under study.
480 E. Kebreab and D.M.S.S. Vitti
Weber et al. (1980) used two compartments for liver Cu metabolism in sheep
but Buckley (1991) restricted the liver compartment to just one because of
insufficient data and lesser significance of clearing tracer Cu from blood over
the longer term. In the model of Buckley (1991) the liver took up most of the
direct reacting Cu (92%) and the rest was distributed to the body (2.9%), milk
(3.5%) and urine (1.5%). The efficiency with which Cu accumulates in the liver
(0.7% of dietary Cu) seem to be constant in cows supplemented with 10 or
40 mg Cu/kg DM (Engle et al., 2001). Genetic differences in Cu metabolism
and especially liver storage were shown in Holstein and Jersey cows. In cows
supplemented with 80 mg Cu/kg DM, Cu was accumulated in the liver at a rate
of about 6.4 mg/g DM/day in Holsteins compared to 7.5 mg/g DM/day in
Jerseys which indicates Jersey cows’ susceptibility to Cu toxicity relative to
Holsteins. Plasma Cu concentrations in both breeds remained constant (Du
et al., 1996).
In non-ruminants, Cu excretion in bile is a major route of Cu homoeostasis.
Ruminants, however, have a poor ability to excrete Cu in bile but Cu excretion
increases as liver Cu concentrations increase. Buckley (1991) reported that
0.87% + 0.41% of liver Cu was excreted per day in bile. Urinary Cu excretion
is about 1% of absorbed Cu and unaffected by dietary Cu intake.
Symonds and Forbes (1993) reviewed quantitative aspects of Cu metabol-
ism. Since then, most of the studies on Cu have been focused more on
Milk
Fetus
(iii)
(ii)
Bile
Faecal
copper
(unabsorbed
dietary and
endogenous)
Dietary
copper
Absorbed
Endogenous
loss
(i)
Liver
A
Liver
B
Liver
C
Blood
Tissue
Kidney
Urine
Fig. 18.4. Diagram of the possible routes of movement of copper in the ruminant body.
A represents a temporary storage compartment for copper in the liver destined for exchange
with blood and excretion into bile (ii), B represents a temporary storage for incorporation into
caeruloplasmin and C represents a long-term storage compartment from which excretion into
bile (iii) and secretion into blood are thought to be operative following tetrathiomolybdate
administration. Excretion into bile was from the blood (i), temporary (ii) and long-term
(iii) Cu storage compartments in the liver (Symonds and Forbes, 1993).
Mineral Metabolism 481
requirements, absorption, sources of Cu and effect of Cu on lipid metabolism.
Therefore, in this chapter, only a limited update of quantitative aspects of Cu
metabolism has been possible.
Conclusions
In this chapter, a similar approach was adopted to that taken by Symonds and
Forbes (1993). Representative mineral elements P and Cu were used to de-
scribe quantitative aspects of mineral metabolism. However, in this case, P was
handled in more detail as it is fast becoming a major environmental concern
due to excessive use of P in feed. A new dynamic model based on various
experiments is proposed which can be integrated with other extant models to
provide a decision support tool that can lead to assessment of diets for their
pollution impact and suggest mitigation options.
References
AFRC (1991) A reappraisal of the calcium and phosphorus requirements of sheep and
cattle. Nutrition Abstracts and Reviews (Series B) 61, 573–612.
Ammerman, C.B., Baker, D.H. and Lewis, A.J. (1995) Bioavailability of Nutrients for
Animals: Amino Acids, Minerals, Vitamins. Academic Press, San Diego, Califor-
nia, 436 pp.
Annenkov, B.N. (1982) Kinetics of mineral metabolism in blood. In: Georgievskii, V.I.,
Annenkov, B.N. and Samokhin, V.I. (eds) Mineral Nutrition of Animals. Butter-
worths, London, pp. 243–256.
ARC (1980) The Nutrient Requirements of Ruminant Livestock. CAB International,
Wallingford, UK, 351 pp.
Barnard, E.A. (1969) Biological functions of pancreatic ribo-nuclease. Nature 221,
340–344.
Bell, S.T., McKinnon, A.E. and Sykes, A.R. (2005) Estimating the risk of hypomagne-
saemic tetany in dairy herds. In: Kebreab, E., Dijkstra, J., Bannink, A., Gerrits,
W.J.J. and France, J. (eds) Nutrient Utilization in Farm Animals: Modelling
Approaches. CAB International, Wallingford, UK, (in press).
Boston, R.C., Greif, P.C. and Berman, M. (1981) Conversational SAAM – an inter-
active program for kinetic analysis of biological systems. Computer Programs in
Biomedicine 13, 111–119.
Braithwaite, G.D. (1983) Calcium and phosphorus requirements of the ewe during
pregnancy and lactation. 2. Phosphorus. British Journal of Nutrition 50,
723–736.
Braithwaite, G.D. (1984) Some observations on phosphorus homoeostasis and require-
ments of sheep. Journal of Agricultural Science, Cambridge 102, 295–306.
Braithwaite, G.D. (1985) Endogenous faecal loss of phosphorus in growing lambs and
the calculation of phosphorus requirements. Journal of Agricultural Science,
Cambridge 105, 67–72.
Breves, G. and Schro
¨
der, B. (1991) Comparative aspects of gastrointestinal phosphorus
metabolism. Nutrition Research Reviews 4, 125–140.
482 E. Kebreab and D.M.S.S. Vitti
Buckley, W.T. (1991) A kinetic model of copper metabolism in lactating dairy cows.
Canadian Journal of Animal Science 71, 155–166.
Care, A.D. (1994) The absorption of phosphate from the digestive tract of ruminant
animals. British Veterinary Journal 150, 197–205.
Challa, J. and Braithwaite, G.D. (1988) Phosphorus and calcium metabolism in growing
calves with special emphasis on phosphorus homoeostasis. 3. Studies of the effect
of continuous intravenous infusion of different levels of phosphorus in ruminating
calves receiving adequate dietary phosphorus. Journal of Agricultural Science,
Cambridge 110, 591–595.
Cohen, R.D.H. (1975) Phosphorus and the grazing ruminant. An examination of the
role of phosphorus in ruminant nutrition with particular reference to the beef cattle
industry in Australia. Animal Production 11, 27–43.
CSIRO (1990) Feeding Standards for Australian Livestock: Ruminants. CSIRO
Publishing, Victoria, Australia, 288 pp.
Czerkawski, J.W. (1976) Chemical composition of microbial matter in the rumen.
Journal of the Science of Food and Agriculture 27, 621–632.
Dijkstra, J. (1994) Simulation of the dynamics of protozoa in the rumen. British
Journal of Nutrition 72, 679–699.
Dijkstra, J., Neal, H.D.St.C., Beever, D.E. and France, J. (1992) Simulation of nutrient
digestion, absorption and outflow in the rumen: model description. Journal of
Nutrition 122, 2239–2256.
Dijkstra, J., Mills, J.A.N. and France, J. (2002) The role of dynamic modelling in
understanding the microbial contribution to rumen function. Nutrition Research
Reviews 15, 67–90.
Du, Z., Hemken, R.W. and Harmon, R.J. (1996) Copper metabolism of Holstein and
Jersey cows and heifers fed diets high in cupric sulphate or copper proteinate.
Journal of Dairy Science 79, 1873–1880.
Durand, M. and Kawashima, R. (1980) Influence of minerals in rumen microbial
digestion. In: Ruckebusch, Y. and Thivend, P. (eds) Digestive Physiology and
Metabolism in Ruminants. MTP Press, London, pp. 375–408.
Engle, T.E., Spears, J.W., Armstrong, T.A., Wright, C.L. and Odle, J. (2000) Effects of
dietary copper source and concentration on carcass characteristics and lipid and
cholesterol metabolism in growing and finishing steers. Journal of Animal Science
78, 1053–1059.
Engle, T.E., Fellner, V. and Spears, J.W. (2001) Copper status, serum cholesterol, and
milk fatty acid profile in Holstein cows fed varying concentrations of copper.
Journal of Dairy Science 84, 2308–2313.
Fox, P.F. and McSweeney, L.R. (1998) Dairy Chemistry and Biochemistry. Blackie
Academic and Professional, London.
Georgievskii, V.I. (1982) The physiological role of macro elements. In: Georgievskii,
V.I., Annenkov, B.N. and Samokhin, V.I. (eds) Mineral Nutrition of Animals.
Butterworths, London, pp. 91–170.
GFE (Ausschuss fu
¨
r Bedarfsnormen der Gesellschaft fu
¨
r Erna
¨
hrungsphysiologie) (2001)
Enpfehlungen zur Energie-und Na¨hrstoffuersorgurg der Milchku¨he and Auf-
zuchtrider. DLG-Verlag, Frankfurt/Main, Germany.
Gooneratne, S.R., Laarveld, B., Chaplin, R.K. and Christensen, D.A. (1989) Profiles of
67
Cu in blood, bile, urine and faeces from
67
Cu primed lambs: effect of 99Mo-
labelled tetrathiomolybdate on the metabolism of
67
Cu long term storage. British
Journal of Nutrition 61, 373–385.
Grace, N.D. (1981) Phosphorus kinetics in the sheep. British Journal of Nutrition 45,
367–374.
Mineral Metabolism 483
Hungate, R.E. (1966) The Rumen and its Microbes. Academic Press, New York,
pp. 346–347.
Kebreab, E., Crompton, L.A., Mills, J.A.N. and France, J. (2001) Phosphorus pollution
by dairy cows and its mitigation by dietary manipulation. Proceedings of the
British Society of Animal Science. BSAS, Penicuik, UK, p. 138.
Kebreab, E., Mills, J.A.N., Crompton, L.A., Bannink, A., Dijkstra, J., Gerrits, W.J.J.
and France, J. (2004) An integrated mathematical model to evaluate nutrient
partition in dairy cattle between the animal and its environment. Animal Feed
Science and Technology 112, 131–154.
Kebreab, E., France, J., Sutton, J.D., Crompton, L.A. and Beever, D.E. (2005a) Effect
of energy and protein supplementation on phosphorus utilization in lactating dairy
cows. Journal of Animal and Feed Sciences 14, 63–77.
Kebreab, E., Shah, M.A., Beever, D.E., Humphries, D.J., Sutton, J.D., France, J. and
Mueller-Harvey, I. (2005b) Effects of contrasting forage diets on phosphorus util-
isation in lactating dairy cows. Livestock Production Science 93, 125–135.
Kellems, R.O. and Church, D.C. (2002) Livestock Feeds and Feeding, 5th edn.
Prentice-Hall, New Jersey, 654pp.
Koddebusch, L. and Pfeffer, E. (1988) Untersuchungen zur verwertbarkeit von phos-
phor verschiedener herkunfte an laktierenden ziegen. Journal of Animal Physi-
ology and Animal Nutrition 60, 269–275.
Louvandini, H. (1995) Perda endo
´
gena de fo
´
sforo em ovinos suplementados com
diferentes nı
´
veis do elemento na dieta. PhD thesis, Instituto de Pesquisas Energe
´
-
ticas e Nucleares, Sa
˜
o Paulo, Brazil.
Louvandini, H. and Vitti, D.M.S.S. (1994) Perda endo
´
gena de fo
´
sforo em ovinos com
diferentes nı
´
veis do elemento na dieta. Pesquisa Agropecua
´
ria Brasileira 29,
145–149.
Maynard, L.A. and Loosli, J.K. (1969) The inorganic element and their metabolism. In:
Animal Nutrition, 5th edn. McGraw-Hill, New Delhi, India, pp. 154–228.
McCaskill, M.R. (1990) Phosphorus and beef production in northern Australia: model-
ing phosphorus requirements of beef cattle. Tropical Grassland 24, 231–238.
McDowell, L.R. (1992) Minerals in Animal and Human Nutrition. Academic Press,
New York, 524 pp.
Mills, J.A.N., Dijkstra, J., Bannink, A., Cammell, S.B., Kebreab, E. and France,
J. (2001) A mechanistic model of whole-tract digestion and methanogenesis in
the lactating dairy cow: model development, evaluation, and application. Journal
of Animal Science 79, 1584–1597.
Milton, J.T.B. and Ternouth, J.H. (1985) Phosphorus metabolism in ruminants. II.
Effects of inorganic phosphorus concentration upon food intake and digestibility.
Australian Journal of Agricultural Research 36, 647–654.
Morse, D., Head, H.H. and Wilcox, C.J. (1992) Disappearance of phosphorus in
phytate from concentrates in vitro and from rations fed to lactating dairy cows.
Journal of Dairy Science 75, 1979–1986.
NRC (2001) Nutrient Requirement of Dairy Cattle, 7th edn. National Academy Press,
Washington, DC 381 pp.
Poppi, D.P. and Ternouth, J.H. (1979) Secretion and absorption of phosphorus in the
gastrointestinal tract of sheep fed on four diets. Australian Journal of Agricultural
Research 30, 503–512.
Robson, A.B., Field, A.C., Sykes, A.R. and McKinnon, A.E. (1997) A model of
magnesium metabolism in young sheep. Magnesium absorption and excretion.
British Journal of Nutrition 78, 975–992.
484 E. Kebreab and D.M.S.S. Vitti
Schneider, K.N., Ternouth, J.H., Sevilla, C.C. and Boston, R.C. (1985) A short-term
study of calcium and phosphorus absorption in sheep fed on diets high and low
in calcium and phosphorus. Australian Journal of Agricultural Research 36,
91–105.
Schneider, K.M., Boston, R.C. and Leaver, D.D. (1987) Quantitation of phosphorus
excretion in sheep by compartmental analysis. American Journal of Physiology
252, R720–R731.
Schro
¨
der, B., Happner, H., Failing, K., Pfeffer, E. and Breves, G. (1995) Mechanisms
of intestinal phosphate transport in small ruminants. British Journal of Nutrition
74, 635–648.
Scott, D. (1988) Control of phosphorus balance in ruminants. In: Proceedings of the
Satellite Symposium of the International Congress of the International Union
of Physiological Sciences, 30, Aspects of Digestive Physiology in Ruminants.
Comstock Publishing Associates, Ithaca, New York, pp. 156–174.
Scott, D., Rajaratne, A.A.J. and Buchan, W. (1995) Factors affecting faecal endogen-
ous phosphorus loss in the sheep. Journal of Agricultural Science, Cambridge
124, 145–151.
Sevilla, C.C. (1985) Phosphorus deficiency in lambs. PhD thesis, University of Queens-
land, Brisbane, Australia.
Shah, M.A. (1999) The effect of forage and concentrate type on phosphorus utilisation
in lactating dairy cows. PhD thesis, University of Reading, UK.
Spiekers, H., Brintrup, R., Balmelli, M. and Pfeffer, E. (1993) Influence of dry matter
intake on faecal phosphorus losses in dairy cows fed rations low in phosphorus.
Journal of Animal Physiology and Animal Nutrition 69, 37–43.
Suttle, N.F. (1991) The interactions between copper, molybdenum and sulphur in
ruminant nutrition. Annual Review of Nutrition 11, 121–140.
Symonds, H.W. and Forbes, J.M. (1993) Mineral metabolism. In: Forbes, J.M. and
France, J. (eds) Quantitative Aspects of Ruminant Digestion and Metabolism.
CAB International, Wallingford, UK, pp. 363–379.
Technical Committee on Responses to Nutrients (TCORN) (1998) The Nutrition of
Goats. CAB International, Wallingford, UK.
Ternouth, J.H. (1968) Changes in the thiosulphate space and some constituents of the
blood after feeding. Research in Veterinary Science 9, 345–349.
Ternouth, J.H. (1997) Phosphorus metabolism in ruminant animals. In: Onodera, R.,
Itabashi, H., Ushida, K., Yano, H. and Sasaki, Y. (eds) Rumen Microbes and
Digestive Physiology in Ruminants. Japan Scientific Society Press, Tokyo,
pp. 167–177.
Ternouth, J.H. and Sevilla, C.C. (1990) The effects of low levels of dietary phosphorus
upon the dry matter intake and metabolism of lambs. Australian Journal of
Agricultural Research 41, 175–184.
Thompson, W.R. (1978) Phosphorus in animal nutrition. In: Phosphorus for Agricul-
ture – a Situation Analysis. Potash/Phosphate Institute, Atlanta, Georgia
pp. 126–158.
Underwood, B.J. and Suttle, N.F. (1999) The Mineral Nutrition of Livestock, 3rd edn.
CAB International, Wallingford, UK, 614 pp.
Valk, H. (2002) Nitrogen and phosphorus supply of dairy cows. PhD thesis, University
of Utrecht, The Netherlands, 204 pp.
Vitti, D.M.S.S. (1989) Avaliac¸a
˜
o da disponibilidade biolo
´
gica do fo
´
sforo dos fosfatos
bica
´
lcico, Patos de Minas, Tapira e finos de Tapira para ovinos pela te
´
cnica da
diluic¸a
˜
o isoto
´
pica. PhD Thesis, Instituto de Pesquisas Energe
´
ticas e Nucleares, Sa
˜
o
Paulo, Brazil, 87 pp.
Mineral Metabolism 485
Vitti, D.M.S.S., Kebreab, E., Abdalla, A.L., De Carvalho, F.F.R., De Resende, K.,
Crompton, L.A. and France, J. (2000) A kinetic model of phosphorus metabolism
in growing goats. Journal of Animal Science 78, 2706–2712.
Vitti, D.M.S.S., Kebreab, E., Lopes, J.B., Dorigan, C.J., De Resende, K.T., Abdalla,
A.L., Crompton, L.A. and France, J. (2002) Calcium metabolism in Saanen goats
– a kinetic model. Proceedings of the British Society of Animal Science. BSAS,
Penicuik, UK, p. 105.
Weber, K.M., Boston, R.C. and Leaver, D.D. (1980) A kinetic model of copper
metabolism in sheep. Australian Journal of Agricultural Research 31, 773–790.
Weber, K.M., Boston, R.C. and Leaver, D.D. (1983) The effect of molybdenum and
sulphur on the kinetics of copper metabolism in sheep. Australian Journal of
Agricultural Research 34, 295–306.
Witt, K.E. and Owens, F.M. (1983) Phosphorus ruminal availability and effects on
digestion. Journal of Animal Science 56, 930–937.
Wu, Z., Satter, L.D. and Sojo, R. (2000) Milk production, reproductive performance,
and fecal excretion of phosphorus by dairy cows fed three amounts of phosphorus.
Journal of Dairy Science 83, 1028–1041.
Yano, F., Yano, H. and Breves, G. (1991) Calcium and phosphorus metabolism in
ruminants. In: Tsuda, T., Sasaki, Y. and Kawashima, R. (eds) Physiological As-
pects of Digestion and Metabolism in Ruminants. Proceedings of the Seventh
International Symposium on Ruminant Physiology. Academic Press, San Diego,
California, pp. 277–295.
Young, V.R., Lofgreen, G.P. and Luick, J.R. (1966) The effects of phosphorus deple-
tion and of calcium and phosphorus intake on the endogenous excretion of these
elements by sheep. British Journal of Nutrition 20, 795–805.
486 E. Kebreab and D.M.S.S. Vitti
The Whole Animal
This page intentionally left blank
19
Growth
G.K. Murdoch,
1
E.K. Okine,
1
W.T. Dixon,
1
J.D. Nkrumah,
1
J.A. Basarab
2
and R.J. Christopherson
1
1
Department of Agricultural, Food and Nutritional Science, University of
Alberta, Edmonton, Alberta T6G 2P5, Canada;
2
Western Forage/Beef Group,
Lacombe Research Centre, 6000 C&E Trail, Lacombe, Alberta T4L 1W1,
Canada
Introduction
Growth of the whole animal involves an increase in mass as a result of changes
in the size, development and structure of its various organs and tissues. Growth
involves increases in both cell numbers (hyperplasia) and cell size (hypertrophy),
and includes the deposition of substantial amounts of extracellular matrix
material (e.g. collagen and mineral) in cartilage and bone, extracellular fluids
and electrolytes and accumulation of structural or energy storage molecules
(e.g. proteins and lipids) in intracellular locations. Although growth is thought of
primarily as an increase in size of components, there is much remodelling of
organ systems throughout life. For example, the size of visceral tissues fluctu-
ates with diet and feeding level, as does lipid storage in adipose tissue, which
fluctuates with nutrient availability and energy demand. All body components
are subject to turnover with growth occurring when synthesis rates exceed
degradation rates.
A detailed consideration of animal growth functions may be found in France
and Thornley (1984) and, in a previous edition of this book, the chapter by Gill
and Oldham (1993) provided a brief coverage of some of the models used to
describe growth, how the environment and management systems impact growth
and also of the impact of variations in an animal’s ability to extract dietary
nutrients on the growth process. Oldham (1999) suggested the need to incorp-
orate knowledge of genotype and gene expression into the development of
nutritional programmes for herbivores. We have chosen to focus on a review
of certain regulatory systems, including components of the endocrine system
and gene expression profiles as these relate to growth and energy balance and
on linkages between energy utilization and growth of ruminant livestock. For our
consideration of regulatory mechanisms, we have drawn upon published contri-
butions based on a wide range of species, including non-ruminant animals, but
have attempted to present the discussion in the context of ruminant livestock.
ß CAB International 2005. Quantitative Aspects of Ruminant Digestion
and Metabolism, 2nd edition (eds J. Dijkstra, J.M. Forbes and J. France)
489
Regulators
Growth hormone
Growth hormone (GH) is a single-chain polypeptide of about 200 residues with
two or three disulphide bridges (Conde et al., 1973). GH is secreted from the
anterior pituitary into the blood stream in a pulsatile manner. Plasma GH is
positively regulated by hypothalamic growth hormone releasing hormone
(GHRH) and negatively regulated by inhibitory feedback of GH itself and
insulin-like growth factor I (IGF-I) on GHRH-producing cells in the hypothal-
amus, as well as somatostatin (SS), which inhibits the release of GH (Veldhuis
et al., 1991). GH acts as a systemic anabolic hormone on tissues expressing its
specific receptor such as epiphyseal growth plates, skeletal and cardiac muscle,
placenta, liver, kidney, brain and cartilage but is catabolic in function on
adipose tissue. Somatic growth in vertebrates is dependent on growth hor-
mone, and insufficiency or insensitivity results in dwarfism (Jorgensen, 1991)
while hypersecretion induces gigantism, acromegaly and insulin insensitivity
accompanied by hyperglycaemia. Of extreme importance to livestock produc-
tion is the fact that normal, and slightly elevated, serum GH promotes depos-
ition of lean body mass with associated reduction of adiposity.
GH binds to GH receptor as a homodimer and initiates signal transduction
mechanisms affecting metabolism and growth (Breier, 1995). Activation of GH
receptor in the liver induces an increase in production of IGF-I, which mediates
many of the anabolic effects (Thiessen et al., 1994). Growth hormone is also
involved in modulating other processes such as lipid, nitrogen, mineral and
carbohydrate metabolism (e.g. Luft et al., 1958).
In adipose tissue, GH decreases lipogenesis, increases lipolysis and fatty
acid mobilization and oxidation, and inhibits insulin-mediated lipogenesis, prob-
ably by direct action on GH receptors (O’Connor et al., 1999). Other roles of
GH include elevation of plasma glucose levels and decreased glucose oxidation,
mainly through insulin antagonism (Campbell et al., 1985; Wurzburger et al.,
1993). Treatment of ruminant livestock with growth hormone results in in-
creased average daily gain (ADG) and feed efficiency, decreased fat accretion
and increased protein accretion (e.g. Hayden et al., 1993). Gladysz et al.
(2001) reported that mean concentrations and amplitudes of GH in blood
plasma of sheep were higher in feed-restricted compared to control animals,
possibly due to reduced somatostatin release. The increase in circulating GH
with feed restriction serves to mobilize lipid and glycogen stores for immediate
use by tissues for maintenance rather than growth. In fact there is evidence for
uncoupling of GH and IGF-I during feed restriction, whereby plasma IGF-I is
reduced while GH is increased (Yambayamba et al., 1996). This may contribute
to the process of compensatory growth. Figure 19.1 describes the response
of cattle to being switched from a low- to a high-energy intake or vice versa,
when roughage or concentrate diets were on offer. Note that switching from a
low- to a high-energy intake appeared to result in an accelerated weight change.
The reduced energy expenditure associated with feed restriction could
490 G.K. Murdoch et al.
have been linked to reduced proteolysis and both might carry-over into the
period immediately following the restriction (Murdoch et al., 2003). However,
Amstalden et al. (2000) found no significant effects of short-term fasting on
plasma concentration, pulse amplitude and frequency of GH in heifers, which
(a) Roughage
190
210
230
250
270
290
310
02
4 6 8 10 12
Weeks
02
4 6 8 10 12
Weeks
Body weight (kg)
190
210
230
250
270
290
310
Body weight (kg)
1.2−2.2ϫM
2.2−1.2ϫM
1.2−2.2ϫM
2.2−1.2ϫM
(b) Concentrate
Fig. 19.1. Examples of compensatory growth in beef steers as they are switched, at 6 weeks,
either from a restricted level (1.2 Â maintenance) to a higher (2.2 Â maintenance) level of feeding
or vice versa. Data are presented for animals fed either high roughage (a) or high concentrate diets
(b). (G.K. Murdoch et al., unpublished observations.)
Growth 491
suggests that there may be a threshold effect in terms of degree of nutrient
restriction, and/or involvement of other endocrine processes.
Insulin-like growth factors and IGF-binding proteins
Insulin-like growth factors (IGF) and IGF-binding proteins (IGFBP) are part of a
family of polypeptides structurally related to proinsulin and which are synthe-
sized by the liver in response to GH stimulus (Thiessen et al., 1994). IGF-I acts
in an autocrine and/or paracrine manner (Louveau et al., 2000) to influence
growth. After release, IGFs bind mainly to IGFBPs, but also other plasma
proteins, which serve to stabilize and increase the half-life of circulating IGF,
and also modulate delivery of IGF to target tissues. For example, in sheep, the
half-life of IGF-I in plasma increased from 10 min in the free form to 545 min
when it was bound to IGFBP-3 (Gatford et al., 1997). Thus IGFBP-3 has been
suggested as the major carrier of IGF-I in adult sheep plasma whilst in the fetal
sheep IGFBP-3, IGFBP-2 and a soluble form of the IGF-II receptor each appear
to carry about a third of the circulating IGF. The extended half-life of IGF bound
to its carriers allows for the maintenance of GH-induced, IGF-mediated ana-
bolic effects beyond GH stimulation.
The plasma concentrations of IGFs increase with age until puberty. IGFs
increase mitosis in immature chondrocytes within cartilage, which develop into
bone and also increases cellular protein synthesis and amino acid uptake in
muscle tissues (Thiessen et al., 1994). IGFs have their own specific receptors,
but they are also insulin receptor agonists and activate these receptors in both
adipose and muscle tissues (Breier, 1995). Plasma IGF-I concentration de-
creased in response to fasting and undernutrition in heifers (Amstalden et al.,
2000) and both IGF-I and IGFBPs were altered by nutritional status in sheep
(e.g. Gatford et al., 1997). In addition, a study by Luna-Pinto and Cronje
(2000) indicated that plasma IGF-I and IGFBP-3 concentrations were higher
during a compensatory growth phase in dairy heifers, which followed a period
of previous feed restriction, than in control animals. This indicated that IGF-I
and IGFBP-3 had a role in adaptation of growth rates in response to both
nutrient restriction and subsequent repletion and compensatory growth in
cattle.
Concentrations of IGF receptors decrease as the animal matures (Thiessen
et al., 1994), but plasma IGF-I increases with growth until puberty. Studies also
indicate an association between serum leptin concentration and IGF-I, IGF-II
and IGFBP-3 concentrations in lean but not in fat subjects (Baile et al., 2000).
In sheep it was found that sustained high concentrations of GH and IGF-I might
reduce adipose tissue mass and thereby, albeit indirectly, inhibit leptin expres-
sion (Kadokawa et al., 2003). The presence of leptin receptors in several
hypothalamic nuclei containing GHRH has led to the suggestion that leptin
acts on GHRH or somatostatin to regulate GH secretion and action (Baile et al.,
2000). Administration of neuropeptide Y (NPY) appears to cause a dose-
dependent inhibition of GH release from pituitary cells and decreases plasma
GH concentrations in sheep (Gladysz et al., 2001). These observations suggest
492 G.K. Murdoch et al.
a complex interaction between the growth hormone system and other path-
ways in the regulation of growth and energy homoeostasis in animals.
Insulin
The main function of insulin is the promotion of nutrient storage. It plays a
major role in lipogenesis, liver and muscle glycogenesis and protein synthesis
(Davis et al., 1998). In the liver, insulin regulates Glut-4 mediated hepatic
glucose uptake and is also essential for the production of IGFs. Peripheral
administration of insulin inhibits lipolysis, and it opposes the action of GH in
fat cells (Woods et al., 1998). Fasting in heifers causes parallel reductions in
circulating insulin and leptin levels (Amstalden et al., 2000), the flip side of the
fact that both are upregulated by elevated plasma nutrient levels, especially
glucose for insulin and free fatty acids for leptin. Heat production in sheep is
also positively related to plasma insulin concentration (Table 19.1), probably as
a result of anabolic responses to the hormone.
Leptin
Leptin, a 146-amino acid peptide is expressed primarily in adipose tissues
(Zhang et al., 1994). Leptin crosses the blood–brain barrier through a saturable
specific transport mechanism involving two short isoforms of its receptor, Ob-
Ra and Ob-Re (Heska and Jones, 2001). Inside the central nervous system,
leptin binds to cells expressing the leptin receptor in the arcuate, ventromedial,
paraventricular and dorsomedial hypothalamus (Tartaglia et al., 1995). It
serves as an indicator of energy status especially adipose stores and is a
postprandial satiety signaller (Houseknecht et al., 1998). Leptin receptors
(long form; Ob-Rb) are single transmembrane proteins belonging to the
Table 19.1. Relationship between heat production and the density of beta-adrenergic
receptors (fmol/mg protein) in different tissues of sheep. Data from Ekpe and Christopherson
(2000) and Ekpe et al. (2000a,b).
Independent variable Intercept Regression coefficient r-value Probability
Heart BAR density 2.12 0.008 0.55 0.01
Biceps femoris BAR density 4.01 À0.019 À0.34 0.05
Semitendinosus BAR density 4.21 À0.032 À0.40 0.05
Gastrocnemius BAR density 5.11 À0.055 À0.47 0.05
Liver BAR density 4.52 À0.081 À0.38 0.05
Kidney BAR density 4.45 À0.034 À0.31 NS
Plasma T3 conc. (ng/dl) 2.42 0.005 0.32 NS
Plasma insulin conc. (mIU/ml) 2.28 0.070 0.54 0.01
Regression of heat production (W/kg) on tissue beta-adrenergic receptor (BAR) density or plasma T3 or
insulin concentrations.
Growth 493