Tài liệu Quantitative aspects of ruminant digestion and metabolism - Phần 17 pdf
Bạn đang xem bản rút gọn của tài liệu. Xem và tải ngay bản đầy đủ của tài liệu tại đây (401.67 KB, 44 trang )
22
Mathematical Modelling of Wool
Growth at the Cellular and Whole
Animal Level
B.N. Nagorcka
1
and M. Freer
2
1
CSIRO Livestock Industries, GPO Box 1600, Canberra, ACT 2601, Australia;
2
CSIRO Plant Industry, GPO Box 1600, Canberra, ACT 2601, Australia
Introduction
Large variation exists both between and within sheep in the rate of growth,
composition and physical characteristics of wool fibres. The rate of clean wool
growth can range from less than 1 to greater than 30 g per animal per day. The
mean diameter of fibres in the fleece from sheep of ultra-fine wool Merino
strains can be as low as 13 mm whereas it is greater than 40 mm for some carpet
wool breeds, and the diameter of individual fibres can range from less than
10 mm to greater than 100 mm. Diameter can also vary considerably along the
length of individual fibres reducing the strength of the wool, causing it to become
‘tender’ and decreasing the commercial value of the fleece. Many fleece staples
are highly crimped whereas some have little or no crimp (Reis, 1992). The
amino acid composition of wool may also vary; in particular, the sulphur-
containing amino acid cystine (usually quoted in units of half-cystine so that it
is equivalent to the amino acid cysteine) may vary considerably (Reis, 1979).
This variation in wool characteristics is due to both genetic and environ-
mental factors. For each animal, the potential rate of wool growth and the
morphology and chemical composition of wool fibres growing at their max-
imum rate are controlled by several genetically determined factors and mech-
anisms. These were outlined in an earlier publication (Black and Nagorcka,
1993). The actual rate of wool growth and the characteristics of the wool fibres
are the result of the interaction between the genetic factors and the supply of
nutrients to the wool follicles (Black, 1987). The latter is influenced by the
quantity and type of nutrients absorbed from the digestive tract and the com-
petition for nutrients between wool growth and the growth of other body
tissues. Thus, the stage of growth and the reproductive status of an animal,
the amount and composition of the diet eaten, the climatic environment, the
presence of parasites and disease may all influence the amount and quality of
the wool grown.
ß CAB International 2005. Quantitative Aspects of Ruminant Digestion
and Metabolism, 2nd edition (eds J. Dijkstra, J.M. Forbes and J. France)
583
In this chapter we describe our current capacity to quantitatively predict
wool growth. The mathematical models of wool growth presented here have
been developed at two levels: for use in research to understand the factors
controlling wool growth at a cellular level and for use by managers of wool
production enterprises to optimize the quality and quantity of the wool pro-
duced. Presenting models at both these levels emphasizes the relationship
between the whole animal level and the cellular level and assists readers to
gain an appreciation of the approximations used at the higher level.
Equations Describing Fibre Growth in a Mature Wool Follicle
Cell division and differentiation in a mature wool follicle
Wool fibres are produced in primary and secondary wool follicles in the skin
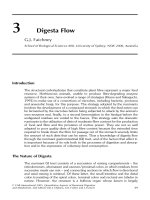
(Hardy and Lyne, 1956). Primary follicles (Fig. 22.1) are so-called because they
are the earliest follicles to initiate in the skin during fetal development, and they
develop with a sebaceous gland as well as an arrector pili musculature and a
sweat gland attached to them. Secondary follicles initiate later in fetal develop-
ment and only have a sebaceous gland attached to them. Both primary and
Fig. 22.1. A primary wool
follicle is illustrated showing the
arrector pili muscle, the sweat
gland and the sebaceous gland
attached to the follicle. The cells
forming the fibre originate in the
follicle bulb and migrate up the
follicle towards the skin surface,
undergoing various changes that
are classified into the different
zones depicted here (Hardy and
Lyne, 1956; Chapman and Ward,
1979).
Epidermis
Pilary canal
Zone of
sloughing
Zone of final
hardening
Keratogenous
zone
Cell division
Dermal papilla
Fibre
Sebaceous
gland
Sweat gland
Arrector pili
muscle
Follicle bulb
584 B.N. Nagorcka and M. Freer
secondary follicles normally produce only one fibre and this originates at the
site of highest mitotic activity in the follicle, i.e. in the follicle bulb. Cell division
is concentrated in the lower part of the follicle bulb (Fig. 22.1) in a region
surrounding the dermal papilla.
It has been proposed (Nagorcka and Mooney, 1982; Nagorcka, 1984) that
epithelial stem cells (i.e. epithelial cells that are totipotent and divide indefin-
itely) are located in contact with the basement membrane that surrounds the
follicle and also separates the epithelium from the dermal papilla. As the stem
cells divide, a fraction of them are forced out of contact with the basement and
so become committed to a path of differentiation that terminates in cell death.
Once committed, the cells may undergo a limited number of further cell
divisions as they differentiate. The age of a cell is defined to be the time since
its commitment. A scheme for the differentiation of these cells has been
proposed (Nagorcka, 1984) in which the path of differentiation chosen by
committed cells depends on the concentration of two chemical factors that
they experience at specific cellular ages as they migrate up and out of the
follicle bulb in response to the pressure in the follicle bulb. One of the chem-
icals, Z, is produced in the dermal papilla and diffuses radially away from the
papilla through the follicle bulb. The second chemical factor is a component, X,
of a reaction–diffusion (RD) system which has been described by Nagorcka and
Mooney (1982).
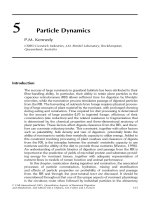
It has been observed that initially cells migrate up from the basement
membrane at the base of the follicle bulb at different rates depending on their
distance away from the dermal papilla (Fig. 22.2) (Chapman et al., 1980).
According to the differentiation scheme referenced above, cells at an early age,
i.e. while they are still low in the bulb, differentiate as presumptive fibre cells,
inner root sheath (IRS) cells or outer root sheath (ORS) cells (Fig. 22.2). At later
ages and slightly higher in the bulb further differentiation occurs, which in the
case of the presumptive fibre cells leads to formation of a single cell layer
surrounding the fibre cortex called the fibre cuticle. The fibre cortex also
differentiates into orthocortical and paracortical cells (and under some circum-
stances the cortex may also include mesocortical and/or metacortical cells)
(Ahmad and Lang, 1957). In large diameter fibres, cells arising from the apex
of the dermal papilla may also differentiate to form medullary cells, which then
act as a central core to the fibre. Once IRS and fibre cells reach the apex of the
bulb they migrate up at the same rate. Some migration of ORS cells also occurs
but at a lower rate.
The proteins that form the fibre and IRS are synthesized mainly in the zone
just above the apex of the dermal papilla called the keratogenous zone. In this
zone macro- and microfibrils form in the cortical cells and are surrounded by a
proteinaceous matrix that acts as a binding material. Further up the follicle, the
cells reach the zone of hardening where, catalysed by copper, the thiol residues
of cysteine undergo oxidative closure to form the hard disulphide linkages of
keratin.
The contents of IRS cells that migrate up the follicle are resorbed to some
extent and the remains are sloughed into the pilary canal in the upper part of
the follicle. Wax and suint are also secreted into the pilary canal by the
Mathematical Modelling of Wool Growth at the Cellular and Whole Animal Level 585
sebaceous and sweat glands. Finally the fibre emerges from the pilary canal at
the skin surface partially coated with ‘grease’ consisting of wax, suint and other
contents of the pilary canal.
Equations describing the cell dynamics in the follicle bulb
A number of researchers have studied the cell division rate in wool follicle bulbs
(Fraser, 1965; Wilson and Short, 1979; Hynd, 1989; Hocking-Edwards and
Hynd, 1992). Their observations have recently been summarized and com-
pared by Hynd and Masters (2002). At a maintenance level of nutrition in a
medium-wool Merino a typical follicle bulb contains about 600 cells. The bulb
cells have a radius r
cell
$ 4---5 mm and hence a cell volume of about 400 mm
3
.It
follows that the volume of the follicle bulb is $ 2:3 Â 10
5
mm
3
. Assuming a
hemispherical shape, the bulb has a radius R
Bulb
$ 50 mm. If the dermal papilla
has cylindrical shape with a radius r
Derpap
% (1=3)R
Bulb
then the surface area of
the membrane is approximately A
Membrane
¼ 2pR
2
Bulb
þ 2pr
Derpap
R
Bulb
¼
2pR
2
Bulb
(1 þ 1=3), and the number of cells expected to be in contact with the
membrane is 2pR
2
Bulb
(1 þ 1=3)=pr
2
cell
% 300, i.e. approximately half of the
600 bulb cells. If we regard the number of cells in contact with the membrane
Fig. 22.2. A schematic diagram showing the
migration paths of cells out of the follicle bulb.
According to the differentiation scheme of Nagorcka
and Mooney (1982) and Nagorcka (1984), cells aged
T
1
days that have reached the level in the bulb
indicated undergo the first stage of differentiation
becoming either presumptive fibre, inner root sheath
(IRS) or outer root sheath (ORS) cells. According to
the scheme this is largely controlled by a chemical
factor produced in the dermal papilla that diffuses
radially away to produce a concentration gradient
shown here by the plot of [Z ] with distance from the
centre of the dermal papilla.
Z
ORS
IRS
FIBRE
T
1
IRS
ORS
586 B.N. Nagorcka and M. Freer
as stem cells, denoted here as N
Stem
, then the stem cell density on the basement
membrane is given by d
Stem
¼ N
Stem
=A
Membrane
( % 0:016cells=mm
2
).
The equation describing the rate of change in the number of stem cells on
the basement membrane in the follicle bulb is:
dN
Stem
(t)
dt
¼ f
StemDiv
N
Stem
(t) À f
Commitment
N
Stem
(t) (22:1)
where f
Commitment
is the fraction of stem cells committed per day (i.e. breaking
attachment with and migrating away from the membrane) and f
StemDiv
is the
fraction of stem cells dividing per day. If the follicle is in equilibrium all rate
equations are equal to zero. As a first approximation both f
StemDiv
and
f
Commitment
are considered to be constants determined by genotype, i.e. by
factors such as growth hormones with little dependence on diet. f
Commitment
is
set to a constant value of 1/7, i.e. one in seven stem cells become detached
from the basement membrane per day (Potten and Lajtha, 1982). f
StemDiv
is
given by:
f
StemDiv
¼ f
Commitment
k
StemDensity
(22:2)
where
k
StemDensity
¼ 0:016=d
Stem
(22:3)
It follows that Eq. (22.1) can also be written as follows:
dN
Stem
(t)
dt
¼ f
Commitment
N
Stem
(t)(0:016=d
Stem
À 1) (22:4)
Since d
Stem
varies with N
Stem
, Eq. (22.4) will build up a population of stem cells
that tends to maintain d
Stem
on the basement membrane at the level of
0:016cells=mm
2
.
Commitment of stem cells provides an input into the number of differen-
tiating cells in the follicle bulb, N
Diff
. These cells are not attached to the
membrane. The number of committed or differentiating cells in the follicle
bulb is assumed to divide at the fixed rate f
DiffDiv
. If the number of differentiating
cells migrating out of the bulb per day is
_
NN
Mig
(t) ¼ dN
Mig
(t)=dt,thenN
Diff
is
given by:
dN
Diff
(t)
dt
¼ f
Commitment
N
Stem
(t) þ f
DiffDiv
Photo(t) À
_
NN
Mig
(t) (22:5)
where f
DiffDiv
is considered to be a constant (i.e. genetically determined and
independent of diet) and is set to a value of 1 (per day), i.e. each cell undergoes
one division per day on average.
_
NN
Mig
is considered to be a proportion f
MigBulb
of the unattached cells in the bulb, i.e.
Mathematical Modelling of Wool Growth at the Cellular and Whole Animal Level 587
_
NN
Mig
(t) ¼ f
MigBulb
N
Diff
(t) (22:6)
f
MigBulb
is defined below in Eq. (22.7). Eq. (22.5) includes an additional function
Photo(t) multiplying the division rate of differentiating cells. This is included to
represent the effect of photoperiod on the rate of wool growth, which is
discussed in a later section (see Eqs (22.18) and (22.19)). Current evidence
suggests that photoperiod acts through the release of melatonin by the pineal
gland, and influences the skin through prolactin (Lincoln et al., 1998). Prolac-
tin and prolactin receptors have been found distributed in the dermal papilla,
the wool follicle bulb and the ORS (Choy et al., 1997; Nixon et al., 2002). We
are assuming that prolactin regulates the division rate of the differentiating cells
in the follicle bulb. If this is correct then the amplitude A
Photo
in Eqs (22.18) and
(22.19) should be reduced by the order of a factor of 10 because of the
feedback occurring between the keratogenous zone and the follicle bulb, as
discussed in relation to Figs 22.3 and 22.4.
The number of cells migrating out of the follicle bulb,
_
NN
Mig
(t) (Eq. (22.5)) is
expressed as a fraction, f
MigBulb
, of the number of differentiating cells in the
bulb. The fraction of cells migrating out of the bulb is expected to increase with
the pressure in the follicle bulb, P
Bulb
, and to decrease as the resistance to flow
of cells up the follicle, R
Mig
, increases. f
MigBulb
is therefore defined by:
f
MigBulb
¼ f
0
MigBulb
P
Bulb
(t)
P
0
Bulb
!
Ã
R
0
Mig
R
Mig
(t)
!
(22:7)
where P
0
Bulb
and R
0
Mig
are normalizing constants set at a maintenance level of
nutrition. The average time taken for cells to migrate out of the follicle bulb has
been observed to be approximately 1 day (Chapman et al., 1980). Therefore
f
0
MigBulb
is considered to be genetically determined, i.e. largely independent of
diet, and is set to a constant value of 1 (per day).
The follicle, including the follicle bulb, is surrounded and contained by a net
of collagenous fibres so that the pressure in the follicle bulb will increase as the
number of cells in the follicle bulb, and hence the volume of the bulb, V
Bulb
,
increases. A functional form for this dependence has not been measured. It is
assumed here to be of the form
P
Bulb
(t) / (V
Bulb
(t))
a
(22:8)
where a is a constant.
The resistance to cellular flow up the follicle is another aspect of follicle
function that has never been studied experimentally. In the upper three-fifths of
the follicle, corresponding to the zone of final hardening (Fig. 22.1), ‘degrad-
ation of the IRS begins with presumed resorption of some cell contents’ (Chap-
man and Ward, 1979). In fact, in the upper half of this region, corresponding to
588 B.N. Nagorcka and M. Freer
the zone of sloughing and the pilary canal, the fibre becomes separated
from the IRS. Therefore the main restriction to cellular flow occurs in the
keratogenous zone and it is assumed here to be dependent on the total volume,
i.e. the total mass of follicular material, M
Ker
, in this zone defined by the
relationship:
R
Mig
(t) / (M
Ker
(t))
b
(22:9)
where b is a constant.
The keratogenous zone corresponds to approximately 3 days of cellular
migration (Chapman et al., 1980). M
Ker
may be calculated as follows:
M
Ker
(t)
¼
ð
Protein synthesis in
the keratogenous zone
"#
þ
Migration of cells into
the keratogenous zone
"#(
À
Migration of cells out of
the keratogenous zone
"#)
dt
0
¼
ð
t
tÀ3
_
PProt
Cell
(t
0
)N
Ker
(t
0
) þ M
BulbCell
_
NN
Mig
(t
0
) À M
KerCell
(t
0
)
_
NN
Mig
(t
0
À 3)
no
dt
0
(22:10)
where
N
ker
(t) ¼
Z
t
t
-
3
_
NN
Mig
(t
0
) dt
0
(22:11)
and
M
KerCell
(t) ¼ M
BulbCell
þ
ð
t
tÀ3
_
PProt
Cell
(t
0
)dt
0
(22:12)
where
_
PProt
Cell
(t
0
) is the rate of material (protein) synthesis in migrating cells that
are differentiating (see Eq. (22.15)). M
KerCell
(t) is the weight of a cell at the upper
limit of the keratogenous zone, and M
BulbCell
is the mass of a cell aged 1 day,
i.e. a cell at the apex of the bulb that is about to migrate into the keratogenous
zone. M
BulbCell
has been set to a constant value since there is no clear evidence
that volume of bulb cells ($ 400 mm
3
) changes significantly in response to a
change in the level of nutrition (Wilson and Short, 1979; Hynd and Masters,
2002). Cell volumes are observed to increase from $ 400 to $ 1500 mm
3
as
Mathematical Modelling of Wool Growth at the Cellular and Whole Animal Level 589
they migrate up the follicle through the keratogenous zone (Hynd, 1994). As a
first approximation these volumes are taken to reflect the changes in the
contents or mass of the cells.
Average rate of cell division in the wool follicle bulb
In the cellular model described above the average rate of cell division in the follicle
bulb, C
Div
, can be calculated by summing the cell division of both stem cells and
differentiating cells and dividing it by the total number of cells in the bulb, i.e.
C
Div
(t) ¼ ( f
StemDiv
N
Stem
(t) þ f
DiffDiv
N
Diff
(t))=N
Bulb
(t) (22:13)
where
N
Bulb
(t) ¼ N
Stem
(t) þ N
Diff
(t) (22:14)
In equilibrium at a maintenance level of nutrition we can substitute
f
StemDiv
¼ 1=7, f
DiffDiv
¼ 1 and N
Stem
=N
Bulb
¼ N
Diff
=N
Bulb
¼ 0:5 to obtain
C
Div
¼ (1=7) Â 0:5 þ 1 Â 0:5 $ 0:57 consistent with observations at ‘medium’
nutrition levels (Hynd and Masters, 2002).
Protein synthesis in the wool fibre
Variations in the amino acid composition of wool are known to occur between
breeds and between animals within a breed; variations are also known to occur in
response to changes in nutrition (see reviews by Reis (1979), Black and Reis
(1979), Rogers et al. (1989) and Hynd and Masters (2002)). To characterize
these variations wool keratins are often classed into four groups. Those in the
main group are the low-sulphur (LS) keratins comprising about two-thirds of the
proteins and providing the structural components of the microfibrils. A second
group contains the high-sulphur (HS) proteins, which are rich in cystine, proline
and serine. These proteins form the matrix surrounding the microfibrils. The
proportion of the HS proteins in wool varies between 18% and 35%. The ultra-
high-sulphur (UHS) proteins in a third group are especially rich in cystine. They
are often considered as a sub-group of the HS proteins. The fourth group
contains the high-glycine/tyrosine (HGT) proteins that make up between 1%
and 12% of the total. The HGT proteins are found primarily in the matrix.
A part of the observed amino acid variation in wool is due to variations in
cortical cell type determined in the follicle bulb. For example, there is more
matrix in paracortical cells than in orthocortical cells. The scheme for cellular
differentiation in the follicle bulb proposed by Nagorcka and Mooney (1982) and
Nagorcka (1984) produces a complicated relationship between follicle bulb size
and shape, and the spatial pattern of cortical cell type in the fibre cross-section.
Both genotype and nutrition determine the size and shape of the follicle bulb.
Since the relationship is complex we will not attempt to describe it here but rather
direct readers to an earlier review (Black and Nagorcka, 1993). The predominant
590 B.N. Nagorcka and M. Freer
cortical cell pattern in the finer wool animals is expected to be bilateral, although
the proportions of ortho- and paracortex may still vary with follicle bulb size and
shape. It is emphasized that variations in composition caused by changes in the
size and shape of the follicle bulb are not considered in the following discussion.
A significant part of the variation in wool composition is also due to
variations in wool protein synthesis caused by changes in the amount and
profile of the amino acids digested and absorbed. Some of the variation in
composition is, therefore, the result of competing biochemical reactions con-
trolling the utilization of nutrients by wool follicles and other tissues. One model
that has explored the effect of competition for nutrients on wool competition is
that by Black and Reis (1979) (see also Black and Nagorcka (1993)), who
demonstrate that it is possible to use Michaelis–Menton kinetics to quantify
the rate of protein deposition, d Prot
j
(t)=dt, in several protein groups in wool
denoted by j. A similar approach is adopted here for each of the four protein
groups in wool (discussed above) specified by j ¼ LS, HS, UHS, HGT. The
equation used here is given by:
d Prot
j
(t)
dt
¼
MIN
i¼1
,
n
AA
d
~
PProt
ij
(t)
dt
()
d
~
PProt
ij
(t)
dt
¼
V
ij
1 þ
K
ij
C
i
þ
K
MEj
C
ME
f
ij
(22:15)
where i ¼ 1, n
AA
specifies a particular amino acid in a set of n
AA
amino acids.
d
~
PProt
ij
(t)=dt is the calculated rate of synthesis of group j proteins determined
by the concentration, C
i
, of amino acid i, and the concentration of metaboliz-
able energy in plasma C
ME
, given that the fraction of amino acid i in group j
protein is f
ij
. Each reaction rate d
~
PProt
ij
(t)=dt is characterized by a maximum
velocity V
ij
and a binding affinity K
ij
.
Attempts to directly measure the size (i.e. maximum diameter and length)
of cortical cells forming the mature fibre (Williams and Winston, 1987; Hynd,
1994; Hynd and Masters, 2002) suggest that the size may remain unchanged
even in response to significant nutritional variation. If this is true it implies that
cortical cells grow to synthesize approximately the same total weight of protein
(keratins), Prot
Ker
, so that a cell reaches a maximum volume ($ 1500 mm
3
,
Hynd, 1994) and weight M
KerCell
(t) ¼ M
BulbCell
(t) þ Prot
Ker
$ 1500 (mm
3
)
 density of wool(g=mm
3
) (Eq. (22.9)). In fact, the total weight of protein
synthesized in cortical cells, Prot
Cell
is expressed as:
dProt
Cell
(t)
dt
¼
P
j
d Prot
j
(t)
dt
, if Prot
Cell
(t ) < Prot
Ker
0 if Prot
Cell
(t ) ! Prot
Ker
(
(22:16)
Mathematical Modelling of Wool Growth at the Cellular and Whole Animal Level 591
Since each cortical cell grows to its maximum weight in the follicle, Eq.
(22.16) is used only to calculate the protein composition of wool, and to
estimate M
KerCell
(t) in Eq. (22.10). In principle they are also required to calculate
the rate at which wool is produced in the follicle as measured at the skin surface
at time t. Wool growth rate of the fibre, WGR
Fibre
, is given by:
WGR
Fibre
(t) ¼ F
Fibre
_
NN
Mig
(t À t
Fibre
)M
KerCell
(t À t
Fibre
þ 3) (22:17)
where t
Fibre
is the time taken for the cells to migrate from just above the follicle
bulb to the skin surface. If it takes approximately 7 days for cells to migrate the
full length of the follicle (Downes and Sharry, 1971), then t
Fibre
% (7 À 1) ¼ 6
days. During the first 3 days of the migration the cells grow in size in the
keratogenous zone. Observations to date (Hynd, 1994; Hynd and Masters,
2002) appear to be consistent with M
KerCell
(t) remaining at or close to its
maximum value as discussed above. F
Fibre
is the fraction of cells migrating out
of the bulb that form part of the fibre. This fraction has been measured (Hynd,
1989) and found to vary between sheep, but not to vary with the level of
nutrition. F
Fibre
is therefore considered to be genetically determined and set to
a fixed value; a typical value is F
Fibre
¼ 0:25.
The Effect of Photoperiod
It has been observed in experiments where sheep are fed a uniform diet at a
constant level of intake that the wool growth rate varies from a maximum in
summer to a minimum in winter. Although this was initially attributed to
temperature, it has since been shown to be caused by photoperiod
(Hart, 01955, 1961; Morris, 1961). Photoperiod appears to have a direct
effect on the wool growth rate that in some breeds of sheep causes the fleece to
shed. In domestic breeds of sheep the annual rhythm of fleece shedding does
not occur but a significant variation in the rate of wool growth remains.
In a review of the observations of the effect of photoperiod on wool growth
Nagorcka (1979) showed that a sinusoidal function of the form:
Photo(t) ¼ 1 þ 0:5A
Photo
cos (vt) (22:18)
where v ¼ 2p=365, is sufficient to capture most of the variation in the growth
rate of the fleece. The amplitude of the variation, A
Photo
, is the difference
between the maximum and the minimum growth rate expressed as a fraction
of the mean. A
Photo
was found to vary between 0.15 and 0.70 depending on
breed. Examples of values for A
Photo
are: Merinos 0.15; Southdown, Ryeland
0.45; Corriedale, Romney 0.30; Dorset, Suffolk, Border Leicester 0.55; Bor-
der Leicester  Merino 0.35. Eq. (22.18) can also be expressed in terms of
daylength, DL(t), as follows:
592 B.N. Nagorcka and M. Freer
Photo(t) ¼ 1 þ 0:1A
Photo
(DL(t) À 12) (22:19)
Variability in Fibre Diameter and Length
Fibre diameter is a major factor determining the price of wool. It has been well
established that there is a relationship between fibre diameter, D
Fibre
, and the
diameter of the wool follicle bulb (and dermal papilla) (Hynd, 1994), which
accounts for most of the observed variability whether caused by nutrition or
genotype. A linear relationship of the form:
D
Fibre
(t) ¼ D
0
Fibre
þ F
Bulb
D
Bulb
(t) (22:20)
is often used (e.g. Henderson (1965)), where D
0
Fibre
and F
Bulb
are constants, and
D
Bulb
is the diameter of the follicle bulb. Assuming the shape of the bulb is
hemispherical:
D
Fibre
(t) ¼ D
0
Fibre
þ F
Bulb
2
3V
Bulb
(t)
2p
1=3
(22:21)
In fact, D
Fibre
should be calculated using a differentiation scheme such as that
proposed by Nagorcka and Mooney (1982), however, in general this is much
too complex. Once D
Fibre
is calculated the fibre length growth rate can also be
determined since:
L
Fibre
(t) ¼
g
Wool
WGR
Fibre
(t)
p(D
Fibre
(t)=2)
2
(22:22)
given that the density of wool is g
Wool
¼ 0:35 Â 10
3
kg=m
3
. Since WGR
Fibre
is
calculated independently of D
Fibre
, L
Fibre
may vary at least to some extent
independently of D
Fibre
.
Staple Strength
To produce yarn, wool is processed through many stages, for example, wash-
ing, combing, carding and spinning. Fibre breakages can occur during each of
these stages of processing leading to losses of wool, called noil, and slowing of
the rate of processing; both will cause the cost of fabric production to increase.
An objective measure called staple strength was introduced to help buyers
assess the potential for fibre breakages. Staple strength is second only to
fibre diameter in determining the price of wool. Factors that influence staple
strength have been reviewed by Reis (1992).
It is known that staple strength is dependent on both the coefficient of
variation in fibre diameter between fibres in the staple, a characteristic that is
Mathematical Modelling of Wool Growth at the Cellular and Whole Animal Level 593
largely genetically determined, and on the variation in fibre diameter along the
length of the fibres, i.e. D
Fibre
, a characteristic that is largely determined by
environmental factors (Petersen et al., 1998). It may be possible to use the
existing information to develop equations to account for the relationship
between staple strength and the variation in diameter along and between fibres.
Unfortunately no satisfactory model for staple strength has yet been derived
from the observations. A mathematical model incorporating all the major
factors contributing to staple strength still remains a missing component of
our capacity to model wool growth.
Fibre Shape
Wool fibres have a characteristic shape referred to as crimp. Crimp was originally
used as a visual indicator of the diameter of the fibre. However, this has now been
replaced by direct measurements of fibre diameter. Recent research (Michael
Haigh and Gary Robinson, personal communication) has shown that crimp
frequency is still a factor in determining fabric attributes such as pilling and
shrinkage, which are less with high-crimp frequency wools, and topmaking
performance, handle and softness, which are better with low-crimp frequency
wools. Thereforecrimp is still a factor in assessing ‘wool quality’ and influences the
price of wool, but it is less important than either fibre diameter or staple strength.
A mechanism explaining the formation of crimp which depends on the
movement of cells out of the follicle bulb and on their migration up the follicle
has been proposed by Nagorcka (1981). This mechanism is based on the
capacity of the fibre to bend and twist while still in the follicle and the way in
which this can affect the spatial distribution of cortical cell type within the fibre
cross-section. It is entirely complementary to the cellular kinetics described
in Eqs (22.1) to (22.22). The mechanism for crimp establishes a causal
relationship between crimp frequency and follicle length consistent with obser-
vations (Nay and Johnson, 1967), and confirms that there is no direct relation-
ship between crimp frequency and fibre diameter.
Performance of the Model of Cell Dynamics in the Wool Follicle
Equations (22.1) to (22.22) describing cell division and fibre growth in a mature
follicle have been solved for a situation where the level of intake is doubled from
a maintenance level after 30 days. The immediate effect is to cause protein
synthesis in the keratogenous zone to increase. The increased protein synthesis
then causes M
Ker
(Eq. (22.10)), the total cell mass in the keratogenous zone,
to increase steadily. This also causes an increase in the resistance to cell
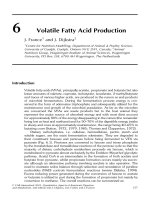
migration up the follicle. As shown in Fig. 22.3, the increased resistance
causes N
Diff
(the number of differentiating cells) and the pressure in the follicle
bulb to increase, leading to an increase in the volume and surface area of the
bulb so that N
Stem
also increases. An increase in N
Diff
and N
Stem
causes an
increase in the mitotic activity in the follicle bulb and an increase in
_
NN
Mig
,
594 B.N. Nagorcka and M. Freer
leading to a further increase in M
Ker
. This causes another sequence of
changes leading to a further increase in M
Ker
. This demonstrates that the
mechanisms now represented in Eqs (22.1) to (22.22) constitute a feedback
mechanism between the keratogenous zone and the follicle bulb. The effect of
the feedback mechanism is to cause increases in cell numbers in the follicle bulb
that are clearly lagged by approximately 20 days behind the changed level of
intake as can be seen in Fig. 22.3 (a lag is defined as the time taken for a
quantity to move two-thirds of the way towards its new equilibrium).
Such a lag in the response of cell number in the bulb is also seen in the
number of cells migrating out of the bulb per day
_
NN
Mig
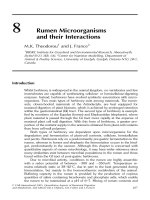
as is evident in the fibre
growth rate, WGR
Fibre
(Fig. 22.4, Eq. (22.17)). Wool growth as observed at the
skin surface WGR
Fibre
(t À t
Fibre
) lags even further behind any change in nutrition
because of the time required, t
Fibre
, for the fibre cells to migrate up the follicle to
the skin surface (Fig. 22.4).
It has been known for some time that the rate of wool growth lags $26 days
behind any change in intake (Nagorcka, 1977). The model of fibre growth in
Eqs (22.1) to (22.22) is the first biological explanation for the occurrence of such
a substantial lag in the response of the wool growth rate to variations in nutrition.
The response in changes of fibre diameter is also lagged (Fig. 22.4), as is the
length growth rate (not shown).
The rate of protein synthesis into the four protein groups LS, HS, UHS
and HGT is regulated by Eq. (22.15). The most limiting amino acids in the case
of wool growth are normally the sulphur-containing amino acids (SAA). The
HS and UHS groups are much more sensitive to the availability of SAA than
are the LS and HGT groups, causing the proportions of HS and UHS groups to
be more variable. This has been discussed by Black and Reis (1979) and
demonstrated by them using equations similar to those in Eq. (22.15). Since
similar results are obtained here using Eqs (22.1) to (22.22) readers are referred
to Black and Reis (1979) and the review by Black and Nagorcka (1993) where
these aspects of wool growth are discussed in detail.
Equations Describing Wool Production in a Fleece
Wool follicle density and distribution
The fleece is made up of millions of fibres. The actual number of fibres in a
fleece is dependent on breed. For example, in Merinos this number has been
estimated to be between 40 and 80 million, although extremes of $170 million
have also been observed. In coarser wool breeds, such as English longwools
(e.g. Lincoln), the number is more like 10 million.
The millions of wool follicles in an animal that produces these fibres have
been classified into a number of types depending on their position in the
observed time sequence of events seen in the initiation of these follicles (Carter
and Hardy, 1947; Hardy and Lyne, 1956). Nagorcka and Mooney have used
a model based on a reaction–diffusion (RD) mechanism to predict a time
Mathematical Modelling of Wool Growth at the Cellular and Whole Animal Level 595
Time (days)
0 20 40 60 80 100 120
Intake level
0.5
1.0
1.5
2.0
Number of cells
200
300
400
500
600
700
Number of
differentiating cells
Intake level
Number of stem cells
Fig. 22.3. The response predicted in the number of differentiating cells in the follicle bulb, N
Diff
,
and the number of stem cells in the follicle bulb, N
Stem
, when the level of intake is doubled
at 30 days. The predictions are made by solving Eqs (22.1) to (22.22) that define the cellular
model.
Time (days)
0 20 40 60 80 100 120
Intake level
0.5
1.0
1.5
2.0
Fibre diameter (micron)
18
20
22
24
26
28
30
32
Fibre growth rate(cells/day)
200
300
400
500
600
700
800
900
Fibre growth rate
in follicle
Intake level
Fibre growth rate at
skin surface
Fibre diameter
Fig. 22.4. The response predicted in the fibre growth rate in the follicle, WGR
Fibre
(t þ t
Fibre
), and
at the skin surface, WGR
Fibre
(t), as well as the fibre diameter when the level of intake is doubled
at 30 days. The predictions are made by solving Eqs (22.1) to (22.22) that define the cellular
model.
596 B.N. Nagorcka and M. Freer
sequence of spatial patterns to control follicle initiation and development
(Mooney and Nagorcka, 1985; Nagorcka and Mooney, 1985; Nagorcka,
1995a,b). The mechanism used is, in fact, basically the same as that used to
account for many aspects of fibre formation in the follicle bulb (Nagorcka and
Mooney, 1982; Nagorcka, 1984). The follicle initiation model is important
in the context of modelling wool production in that it provides a causal
link between the follicle size distribution and follicle density. Such a causal link
appears to be consistent with the strong genetic correlation observed between
mean fibre diameter and follicle density (Davis and McGuirk, 1987), and hence
between the mean fibre diameter and the total follicle density of an animal. On
the basis of this causal link it is reasonable to characterize the fleece of an animal
(or of a breed or strain) by the total skin surface area (containing follicles), A
Sur
,
the total follicle density, N
Fol
, and a size distribution of the follicles. The size
distribution of the follicles may itself be characterized by the distribution of fibre
diameters specified by the mean diameter,
"
DD
Fibre
, and the coefficient of variation,
CV
Fibre
, at a maintenance level of nutrition. The specified or input value of
"
DD
Fibre
is required to initialize the fibre model defined above by Eqs (22.20) and (22.21)
in order to calculate WGR
Fibre
(t). The expression for rate of wool growth in the
fleece, WGR
Fleece
, is then given by:
WGR
Fleece
(t) ¼ A
Sur
N
Fol
WGR
Fibre
(t) (22:23)
Predictions of Wool Production using Current Models
Simplified models currently used in decision support tools
The most advanced model of wool growth currently used as a component of a
ruminant model to analyse the performance of wool production enterprises is
available in a decision support tool called
GRASSGRO
, designed for the strategic
management of grazing animals (Moore et al., 1997). The wool growth
component of
GRASSGRO
does not attempt to model growth at the level of the
cell as in Eqs (22.1) to (22.22). Therefore it does not attempt to model cell
kinetics in the follicle, or to relate fibre diameter to the changing follicle bulb
size, or to make wool growth directly dependent on the profile of amino acids.
GRASSGRO
does, however, express the wool growth rate as a function of the total
amount of absorbed amino acids. It also incorporates a lag in the wool growth
rate, to represent the kinetics of cells migrating out of the follicle, and calculates
the fibre diameter and length as functions of the wool growth rate.
In
GRASSGRO
the growth of wool is predicted on a daily time step. In the
animal model within this tool (Freer et al., 1997) intakes of digestible dry
matter and crude protein by the sheep are predicted from the changing pattern
of available pasture (driven by daily climatic data) and from supplementary feeds
that may be offered to the animals. From these intakes, the metabolizable
energy, ME (MJ), rumen-degraded protein, undegraded dietary true protein
and microbial true protein are computed. The truly digestible fractions of the
Mathematical Modelling of Wool Growth at the Cellular and Whole Animal Level 597
last two components make up the digestible protein leaving the stomach
(DPLS), which represents the total amount of amino acids available for syn-
thetic processes. No attempt is made to predict the proportions of individual
amino acids in the DPLS, a large part of which is usually derived from the
microbial protein. The genetic potential of the sheep with respect to the growth
and diameter of the fibres is deduced from the animal specification provided by
the user: the standard reference weight, SRW (kg), being the weight of the
shorn mature sheep in average body condition, the standard fleece weight,
SFW (kg), being the average annual weight of greasy fleece and the average
diameter, D
mean
(mm), of fibres in the fleece. The yield, Y, of clean wool
expected from the greasy fleece must also be supplied by the user.
Daily wool growth in the fleece, Wool
Fleece
(t) (g), is obtained by integrating
the wool growth rate of the fleece (Eq. (22.24)). WGR
Fleece
(t) estimated as a 25-
day running mean (Eq. (22.25)) to allow for the lag (25 days) discussed above (Figs
22.3 and 22.4). The daily increment to this function, Prot
Wool
(t) (g), (Eq. (22.26))
is predicted either from the DPLS, DPLS
Wool
(t) (g), that is available for wool
production, i.e. after deducting the needs for gestation or milk production (Eq.
(22.28)) (see Corbett, 1979), or from the intake of ME, ME
Wool
(t), similarly
adjusted (Eq. (22.27)), whichever is limiting. Protein that is mobilized from
body tissue in sheep that are losing weight contributes to the DPLS available for
wool growth, an assumption supported by the recent work of Revell et al.
(1999). The weight of protein, PG (g), mobilized per kg of loss of empty body
weight in mature sheep is predicted from the relative body condition, BC¼W/
SRW, where W is the current liveweight of the sheep, by the relationship
PG ¼ 207 À 115BC, derived from the results of Wright and Russel (1984)
with cattle. In immature sheep, the protein content of weight loss is predicted
as a function of the degree of maturity of the animal (Freer et al., 1997).
dWool
Fleece
(t)
dt
¼ WGR
Fleece
(t) (22:24)
d WGR
Fleece
(t)
dt
¼
Prot
Wool
(t) À WGR
Fleece
(t)
WLAG
(22:25)
where WLAG ¼ 25 days.
Prot
Wool
(t) ¼ min 10 Â 0:116DPLS
Wool
(t), 10 Â 1:4ME
Wool
(t)ðÞ
Â
SFW
SRW
Fol
Dev
(t)Photo(t) (22:26)
where
ME
Wool
(t) ¼ max 0, MEI(t) À ME
Conceptus
þ ME
Lactation
ÀÁÀÁ
(22:27)
DPLS
Wool
(t) ¼ max 0, DPLS(t) À Prot
Conceptus
þ Prot
Lactation
ÀÁÀÁ
(22:28)
and
598 B.N. Nagorcka and M. Freer
Fol
Dev
(t) ¼ 1 À 0:75 exp (À0:025Age(t)) (22:29)
Hogan et al. (1979) estimated that, for a wide range of Merino strains, the
mean gross efficiency of conversion to wool of amino acids absorbed from
roughage-based diets was 0.116, with most values lying between 0.103 and
0.133. Data analysed by Kempton (1979) suggested that synthesis of wool is
limited by DPLS
Wool
(t) until the ratio of DPLS
Wool
(t): ME
Wool
(t) exceeds 12.
Above this point, wool synthesis is limited to 0:116 Â 12 g=MJ ME
Wool
(t), i.e.
1:4g=MJ ME
Wool
(t) (Eq. (22.26) and Fig. 22.5). This efficiency of conversion of
DPLS
Wool
(t) applies to mature Merinos in which the ratio of SFW to SRW is
approximately 0.1 (Hogan et al., 1979).
The ratio SFW:SRW scales Prot
Wool
(t) and changes made by the user adjust
the efficiency of wool growth for other types of sheep or for other diets that are
known to provide absorbed protein with a higher proportion of sulphur-con-
taining amino acids than would be expected from diets in which the DPLS is
derived mainly from microbial crude protein.
Prot
Wool
(t) (Eq. (22.26)) also includes a dependence on daylength, DL(t) (h)
given by the function Photo(t) defined in Eq. (22.19). Photo(t) describes the
effect of photoperiod on wool growth and is specific to the breed (Nagorcka,
1979).
Secondary wool follicles are still developing during the first few months of
life and take some time to reach their full fibre-growing potential. Consequently
Prot
Wool
(t) in Eq. (22.26) includes the factor Fol
Dev
(t) (Eq. (22.29)) that
quantifies the rate of maturation of secondary follicles with age, Age(t) (days)
(Lyne, 1961).
No estimate is made of the number of cells in the follicle bulb, and hence
the volume of the bulb. Therefore Eqs (22.20) to (22.22) cannot be used to
calculate the fibre diameter and the length growth rate. Instead it is assumed
here that the ratio of the diameter of new wool to its length is constant
(Downes, 1971; Reis, 1991), and the diameter of the day’s new growth,
D
Fib
(t), is estimated (Eq. (22.30)) as a proportion of the average fibre diameter
specified for the animal type, D
Mean
. This proportion is determined by the ratio
of predicted wool growth to the specified average daily growth of clean wool,
Wool
Mean
, adjusted for the age of the sheep.
D
Fib
(t) ¼ D
Mean
Wool
Fleece
(t)
Wool
Mean
(t)
1=3
(22:30)
where
Wool
Mean
(t) ¼ SFW Y Fol
Dev
(t)=365 (22:31)
The predicted value of fibre length growth rate, L
Fib
(t) (cm) (Eq. (22.32)) is
derived from the day’s growth, assuming that mean follicle density is
N
Fol
¼ 6 Â 10
7
=m
2
over the predicted surface area of the sheep (Eq. (22.33)).
Mathematical Modelling of Wool Growth at the Cellular and Whole Animal Level 599