Tài liệu Microeconomics for MBAs 13 doc
Bạn đang xem bản rút gọn của tài liệu. Xem và tải ngay bản đầy đủ của tài liệu tại đây (61.47 KB, 10 trang )
Chapter 4 Government Controls: How Management
Incentives Are Affected
14
14
Both sides to the heated debate that is also unavoidable will once again restate old
and tired arguments, and they both will be off course in their arguments. In considering a
new round of minimum wage increases, both minimum wage proponents and opponents
need to reconsider how a minimum-wage hikes will affect labor market incentives and
manager reactions to what Congress legislates. By the same token, managers in markets
affected by any new minimum-wage increase need to be mindful of the competitive
forces afoot that will cause them to react to an increase in ways that they might not
always like.
The History of the Minimum Wage in
Current and Constant Dollars
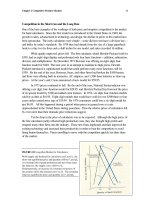
In emerging debate, much will likely be made of how the current federal
minimum wage of $5.15 an hour has no more purchasing power than the minimum wage
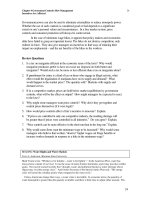
of the early 1950s, a fact that can be seen in Figure 4.7. The chart shows that the
minimum wage in current dollars has risen in a series of nineteen steps from 25 cents an
hour when the first federal minimum wage took effect in October 1938 to $5.15
currently. However, in constant, (February) 1999 dollars the minimum wage rose
irregularly from $2.92 an hour in October 1938 to $7.70 an hour in 1968, only to fall
irregularly from the 1968 peak to its current level of $5.15, which is a third less than the
1968 peak. As can also be seen, the real value of the 1999 minimum wage was slightly
below the real minimum wage when it was raised at the start of 1950 (at which time it
was $5.25 in 1999 dollars). In recent years, the real minimum wage has fallen only
slightly in real terms from $5.25 in October 1997, at which time the minimum wage was
last raised, to $5.15.
4
The Two Sides to an Old Debate
When the next minimum-wage bill reaches the floor of Congress, it is all but
certain that many opponents and proponents in and out of Congress will once again lock
political horns over the proposal, no matter what the proposed increase is. While the
political partisans can be expected to repeat past claims in earnest, they all will once
again be off base on the likely employment consequences of the minimum-wage increase.
1999, p. A1. Quinn’s bill would delay the full $1 increase until September 1, 2001, but it would go one step
further and raise the minimum wage annually by the consumer price index after September 1, 2002 [House,
U.S. Congress, 106
th
Cong., 1
st
Sess. “Long Term Minimum Wage Adjustment Act of 1999,” H.R. 964
(March 3, 1999).
4
Over the past six decades, the percent of nonsupervisory workers covered by the federal minimum wage
has risen from 57 percent in 1950 to 87 percent in 1988 (the latest year of available data). This rise in the
coverage of the minimum wage should have led to any increase in the minimum wage to have a
progressively greater negative employment effect over the years, which is what economist Marvin Kosters
has found [Marvin H. Kosters, Jobs and the Minimum Wage: The Effect of Changes in the Level and
Pattern (Washington, D.C.: American Enterprise Institute, 1989), p. A-13].
Chapter 4 Government Controls: How Management
Incentives Are Affected
15
15
House Majority Leader Dick Armey, a long-time opponent of the minimum wage,
has already declared that the proposed $1 increase in the minimum wage is the “wrong
thing” to do, mainly because the increase would significantly reduce employment of the
country’s low skilled workers.
5
No doubt, Armey is thinking in terms of a supply-and-
demand model that he once taught in his economics classes at North Texas State
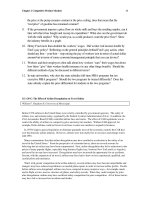
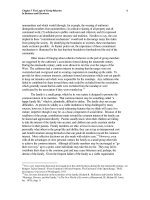
University. Consider Figure 4.8. If the market is competitive and free of government
intervention, the wage rate will settle at W
1
. Suppose, however, that politicians consider
that market wage too low to provide a decent living. They pass a law requiring
employers to pay no less than W
2
. The effect of the law will be to reduce employment.
Employers will not be able to afford to employ as many people, and the quantity of labor
demanded will fall from Q
2
to Q
1
. Those who manage to keep their jobs at the minimum
wage will be better off; their take-home pay will increase. Other workers may no longer
have a job. The will either become permanently unemployed or settle for work in a
different, less desirable labor market. If the minimum wage displaces them from their
preferred employment to their next-best alternative, their full wage rate—that is, their
money wage plus the nonmonetary benefits of their job—will have been reduced. If they
become permanently unemployed, their money wage will have been reduced from a level
judged politically unacceptable to zero.
_________________________________________
Figure 4.7 The History of the Minimum Wage in
Current and Real Dollar Terms
The minimum wage rose in current dollars from
$.25 an hour in 1938 to $5.15 until late 1999.
However, in real (1999) dollars, the minimum
wage rose from $2.92 in 1938 to $7.70 in 1968,
only to fall back to $5.15 an hour in 1999.
__________________________________
To make matters worse, the introduction of a minimum wage increases the
number of laborers willing to work (see Figure 4.8). Thus the workers who would have
had a job at W
1
, and who have fewer employment opportunities at W
2
, must now compete
5
“U.S. Republicans Concede GOP Support for Minimum Wage Boost,” Dow Jones News Service, 1999
(as found on the Dow Jones Interactive Publication Library, April 28, 1999).
0
2
4
6
8
40 45 50 55 60 65 70 75 80 85 90 95
The Minimum Wage in Current and Constant (1999) Dollars,
Monthly, October 1938-February 1999
Years
$2.92
$6.12
$7.70
$6.33
$5.15
$.25
$1.00
$1.60
$3.35
Minimum Wage in
Constant Dollars
Minimum Wage in
Current Dollars
$5.25
Chapter 4 Government Controls: How Management
Incentives Are Affected
16
16
with a larger number of workers. Indeed, many of these new arrivals to the market will
take jobs once held by menial workers at the market-clearing wage, W
1
.
On the other side of the argument, Bob Herbert, a columnist for the New York
Times and a minimum-wage supporter, approvingly quotes a study from the Economic
Policy Institute, a Washington, D.C.-based think tank, that found the last approved
minimum-wage hike raised the incomes of 10 million Americans.
6
Herbert writes, “The
benefits of the increase disproportionately help those working households at the bottom
of the income scale. Although households in the bottom 20 percent (whose average
income was $15,728 in 1996) received only 5 percent of total national income, 35 percent
of the benefits from the minimum wage increase went to these workers. In this regard,
the increase had the intended effect of raising the earnings and incomes of low-wage
workers and their households.’’
7
Moreover, in the growing debate proponents like
Herbert will continue to cite statistical studies that show that a minimum wage hike will
have no (or minimal) impact on the count of low-wage jobs, which is what the Economic
Policy Institute study found.
8
_________________________________________
Figure 4.8 The Standard View of the Minimum
Wage
When Congress raises the minimum wage from W
1
to W
2
, the number of workers hired goes from Q
1
to
Q
2
, while the number of workers who are willing to
work goes from Q
1
to Q
3
. The result is a “surplus”
of workers equal to Q
3
– Q
1
. Some workers gain at
the expense of others.
__________________________________
_
Herbert is convinced that such findings should give minimum-wage critics reason
to eat their words. Herbert reminds his readers of Cato Institute’s chairman William
Niskanen (and former acting chairman of President Reagan’s Council of Economic
Advisors and opponent of minimum-wage increases) comments made in the middle of
the previous debate over increasing the minimum wage, ‘‘It is hard to explain the
continued support for increasing the minimum wage by those interested in helping the
working poor.’’
9
Herbert and other minimum-wage supporters will point once again to
6
Jared Bernstein and John Schmitt, “Making Work Pay” (Washington, D.C.: Economic Policy Institute,
1998, mimeographed).
7
Bob Herbert, “In America; The Sky Didn’t Fall,” New York Times, June 4, 1998, p. A27.
8
Bernstein and Schmitt, “Making Work Pay.”
9
Ibid.
Chapter 4 Government Controls: How Management
Incentives Are Affected
17
17
the empirical work of Princeton University economists David Card and Alan Krueger
who concluded in 1994 that the minimum-wage increases in the federal minimum wage
in the early 1990s had no measurable negative effect on employment in New Jersey fast-
food restaurants (and may have actually increased employment slightly).
10
They also
insisted in 1998 insisted that more recent employment data from the Bureau of Labor
Statistics corroborate their earlier findings.
11
Nevertheless, opponents will continue to argue, as they have in the past, that if
Congress raises the cost of low-skill labor, less than a fifth of the wage gains will go to
households with incomes below the poverty level and more than half of the wage gains
will go to households with more than twice the poverty income threshold.
12
They will
also stress that several hundred thousand jobs are bound to be lost. Some employers will
not be able to afford as many workers, and other employers can be expected to automate
low-skill jobs out of existence. The opponents will back up their claims with their own
statistical studies that will show that some low-skilled workers will be made better off
(those who keep their jobs) but only because other low-skilled workers will be made
worse off (those who are unemployed).
13
For example, the Employment Policies
Institute, another Washington, D.C. based think tank, commissioned a study of the labor
market impact of a $1.35 increase in the minimum-wage in the State of Washington and
found that by 2000, the increase can be expected to destroy 7,431 jobs in the state,
causing the affected workers to lose $64 million in annual income.
14
Both sides to the debate will once again be wrong in their assessments of the
minimum-wage increase because they have both failed to recognize that employers are a
lot smarter and are pressed far more by the forces of their labor markets than the political
combatants seem to think. Neither side seems to realize that Washington simply doesn’t
have the requisite power over markets to significantly improve worker welfare by wage
decrees, no matter how well intended the legislation may be. This is why so many
10
David Card and Alan B. Krueger, “Minimum Wages and Employment: A Case Study of the Fast-Food
Industry in New Jersey and Pennsylvania,” American Economic Review, vol. 84 (1994), pp. 772-793; or
David Card and Alan B. Krueger, Myth and Measurement: The New Economics of the Minimum Wage
(Princeton, N.J: Princeton University Press, 1995).
11
David Card and Alan B. Krueger, “Unemployment Chimera,” Washington Post, March 6, 1998, p. A25.
12
As reported by Kenneth A. Couch, “Distribution and Employment Impacts of Raising the Minimum
Wage,” FRBSF Economic Letter (San Francisco: Economic Research, Federal Reserve Bank, February 19,
1999, no. 99-06), p. 1. Couch cites Richard V. Burkhauser, Kenneth A. Couch, and Andrew J. Glenn,
“Public Policies for the Working Poor: The Earned Income Tax Credit Versus Minimum Wage
Legislation,” Research in Labor Economics, edited by Sol Polacheck, pp. 65-110.
13
Several recent statistical studies on the negative employment and income impacts of state and federal
minimum wage hikes can be found on the Employment Policies Institute web site
(
14
David A. Macpherson, “The Effects of the 1999-2000 Washington Minimum-Wage Increase”
(Washington, D.C.: Employment Policies Institute, May 1998, as found at
Chapter 4 Government Controls: How Management
Incentives Are Affected
18
18
empirical studies show minimum wage increases have had a relatively small impact on
employment. Indeed, most studies undertaken over the past three or four decades have
found that a 10 percent increase in the minimum wage will lower the employment of
teenagers (the group of workers most likely to be adversely affected by the minimum
wage) by a surprisingly small percentage, anywhere from .5 to 3 percent,
15
and tight labor
markets, which exist currently in the United States, imply relatively smaller reductions in
the count of lost jobs with any given percentage increase in the minimum wage.
16
When
labor economists were asked to give their personal estimate of the employment effect of a
10 percent increase in the minimum wage, researchers found that the surveyed
economists estimate that teenage employment would fall by 2.1 percent.
17
Why Minimum-Wage Hikes Don’t Seem to
Affect Employment Very Much
Why have the percentage estimates of job losses been so low? The simple answer is the
labor markets for low-skilled workers are highly competitive, which explains the low
wages paid workers with limited skills in the first place. Many employers of low-skilled
workers would love to be able to pay their workers more, but they have to face a market
reality: if they paid more, then their competitors would have a cost advantage in pricing
their products.
When Congress forces employers to pay more in money wages, it also forces
them to pay less in other forms, most notably in fringe benefits. If there are few fringes
to take away, the employers can always increase work demands.
Why would employers curb benefits and increase work demands? There are three
reasons:
15
For reviews of the minimum-wage literature, see Charles Brown, Curtis Gilroy, and Andrew Kohen,
“The Effect of the Minimum Wage on Employment and Unemployment,” Journal of Economic Literature,
vol. 20 (1982), pp. 487-528; and Charles Brown, “Minimum Wage Laws: Are They Overrated?” Journal of
Economic Perspectives, vol. 2 (1988), pp. 133-147. In more recent studies in the 1990s, the reported
employment effects among teenagers continue to be relatively small [Richard V. Burkhauser and David
Whittenberg, “A Reassessment of the New Economics of the Minimum Wage Literature Using Monthly
Data from the SIPP and CPS” (Syracuse, N.Y.: Center for Policy Research, Syracuse University, 1998).
16
These estimates of the responsiveness of labor markets to minimum wage hikes are independent of the
tightness of labor markets. If the country’s labor markets remain relatively tight over the next year or so,
the number of low-skill workers covered by the minimum wage can be expected to fall as market-
determined wage rates for low-skill workers rise past the proposed new levels for the minimum wage.
(Currently, only about 4 million Americans work at the federal minimum wage.) Hence, while the
percentage reduction in the number of minimum wage jobs may remain more or less in line with past
studies, it stands to reason that the actual number of minimum wage jobs will fall as the count of covered
workers shrinks.
17
Victor R. Fuchs, Alan B. Krueger, and James M. Poterba, “Economists’ Views about Parameters, Values,
and Policies: Survey Results in Labor and Public Economics,” Journal of Economic Literature, vol. 36
(September 1998), pp. 1387-1425.