Tài liệu Memory Dump Analysis Anthology- P5 doc
Bạn đang xem bản rút gọn của tài liệu. Xem và tải ngay bản đầy đủ của tài liệu tại đây (643.14 KB, 30 trang )
Interrupts and Exceptions Explained 121
0012f430 00000000
0012f434 00000000
0012f438 00000000
0012f43c 00000800
0012f440 00000000
0012f444 00000000
0012f448 00000000
0012f44c 00000000
0012f450 00000000
0012f454 00000005
0012f458 994ac7c4
0012f45c 00000011
0012f460 00000000
0012f464 0012f5c0
0012f468 775d5ac9 kernel32!_except_handler4
0012f46c 00000001
0012f470 00000000
0012f474 77655cbd kernel32!UnhandledExceptionFilter+0×32e
0012f478 00000000
0012f47c 00000000
0012f480 0012f41c
0012f484 00000024
0012f488 0012f4f4
0012f48c 775d5ac9 kernel32!_except_handler4
0012f490 7765ff59 kernel32!PEWriteResource<_IMAGE_NT_HEADERS>+0×50a
0012f494 fffffffe
0012f498 77655cbd kernel32!UnhandledExceptionFilter+0×32e
0012f49c 77a29f8e ntdll!_RtlUserThreadStart+0×6f
0012f4a0 00000000
0012f4a4 779b8dd4 ntdll!_EH4_CallFilterFunc+0×12
0012f4a8 00000000
0012f4ac 0012ffec
0012f4b0 779ff108 ntdll! ?? ::FNODOBFM::`string‘+0xb6e
0012f4b4 0012f4dc
0012f4b8 779b40e4 ntdll!_except_handler4+0xcc
0012f4bc 00000000
0012f4c0 00000000
0012f4c4 00000000
0012f4c8 0012f5c0
0012f4cc 0012f5dc
0012f4d0 779ff118 ntdll! ?? ::FNODOBFM::`string‘+0xb7e
0012f4d4 00000001
0012f4d8 0112f5c0
0012f4dc 0012f500
0012f4e0 77a11039 ntdll!ExecuteHandler2+0×26
0012f4e4 fffffffe
0012f4e8 0012ffdc
0012f4ec 0012f5dc
0012f4f0 0012f59c
0012f4f4 0012f9e8
0012f4f8 77a1104d ntdll!ExecuteHandler2+0×3a
0012f4fc 0012ffdc
0012f500 0012f5a8
0012f504 77a1100b ntdll!ExecuteHandler+0×24
Please purchase PDF Split-Merge on www.verypdf.com to remove this watermark.
122 PART 2: Professional Crash Dump Analysis
0012f508 0012f5c0
0012f50c 0012ffdc
0012f510 0012fe70
0012f514 0012f59c
0012f518 779b8bf2 ntdll!_except_handler4
0012f51c 00000000
0012f520 0012f5c0
0012f524 0012f538
0012f528 779b94e3 ntdll!RtlCallVectoredContinueHandlers+0×15
0012f52c 0012f5c0
0012f530 0012f5dc
0012f534 77a754c0 ntdll!RtlpCallbackEntryList
0012f538 0012f5a8
0012f53c 779b94c1 ntdll!RtlDispatchException+0×11f
0012f540 0012f5c0
0012f544 0012f5dc
0012f548 00425ae8
TestDefaultDebugger!CTestDefaultDebuggerApp::`vftable‘+0×154
0012f54c 00000000
0012f550 00000502
0012f554 00000000
0012f558 00a460e0
0012f55c 00000000
0012f560 00000000
0012f564 00000070
0012f568 ffffffff
0012f56c ffffffff
0012f570 77b60dba USER32!UserCallDlgProcCheckWow+0×5f
0012f574 77b60e63 USER32!UserCallDlgProcCheckWow+0×16e
0012f578 0000006c
0012f57c 00000000
0012f580 00000000
0012f584 00000000
0012f588 00000000
0012f58c 0000004e
0012f590 00000000
0012f594 0012f634
0012f598 77bb76cc USER32!_except_handler4
0012f59c 0012f634
0012f5a0 00130000
0012f5a4 00000000
0012f5a8 0012f8b4
0012f5ac 77a10060 ntdll!NtRaiseException+0xc
0012f5b0 77a10eb2 ntdll!KiUserExceptionDispatcher+0×2a
0012f5b4 0012f5c0
…
…
…
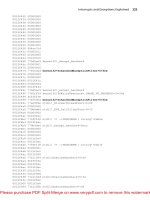
It shows the presence of kernel32!UnhandledExceptionFilter calls. Let’s open
TestDefaultDebugger.exe in WinDbg, put breakpoint on UnhandledExceptionFilter func-
Please purchase PDF Split-Merge on www.verypdf.com to remove this watermark.
Interrupts and Exceptions Explained 123
tion and trace the execution. We have to change the return value of IsDebugPortPresent
to simulate the normal fault handling logic when no active debugger is attached:
0:000> bp kernel32!UnhandledExceptionFilter
0:000> g
(fb0.1190): Access violation - code c0000005 (first chance)
First chance exceptions are reported before any exception handling.
This exception may be expected and handled.
eax=00000000 ebx=00000001 ecx=0012fe70 edx=00000000 esi=00425ae8
edi=0012fe70
eip=004014f0 esp=0012f8a8 ebp=0012f8b4 iopl=0 nv up ei ng nz ac pe cy
cs=001b ss=0023 ds=0023 es=0023 fs=003b gs=0000 efl=00010297
TestDefaultDebugger!CTestDefaultDebuggerDlg::OnBnClickedButton1:
004014f0 mov dword ptr ds:[0],0 ds:0023:00000000=????????
0:000> g
Breakpoint 0 hit
eax=0042ae58 ebx=00000000 ecx=0042ae58 edx=0042ae58 esi=003b07d8
edi=c0000005
eip=77655984 esp=0012f478 ebp=0012f494 iopl=0 nv up ei pl zr na pe nc
cs=001b ss=0023 ds=0023 es=0023 fs=003b gs=0000 efl=00000246
kernel32!UnhandledExceptionFilter:
77655984 push 5Ch
0:000> g $$ skip first chance exception
Breakpoint 0 hit
eax=77655984 ebx=00000000 ecx=0012f404 edx=77a10f34 esi=0012f4c8
edi=00000000
eip=77655984 esp=0012f49c ebp=0012ffec iopl=0 nv up ei pl nz na pe nc
cs=001b ss=0023 ds=0023 es=0023 fs=003b gs=0000 efl=00000206
kernel32!UnhandledExceptionFilter:
77655984 push 5Ch
0:000> p
eax=77655984 ebx=00000000 ecx=0012f404 edx=77a10f34 esi=0012f4c8
edi=00000000
eip=77655986 esp=0012f498 ebp=0012ffec iopl=0 nv up ei pl nz na pe nc
cs=001b ss=0023 ds=0023 es=0023 fs=003b gs=0000 efl=00000206
kernel32!UnhandledExceptionFilter+0×2:
77655986 push offset kernel32!strcat_s+0×128d (77655cf0)
…
…
…
Please purchase PDF Split-Merge on www.verypdf.com to remove this watermark.
124 PART 2: Professional Crash Dump Analysis
0:000> p
eax=00000000 ebx=0012f4c8 ecx=776558e5 edx=77a10f34 esi=00000000
edi=00000000
eip=77655a33 esp=0012f41c ebp=0012f498 iopl=0 nv up ei pl nz ac po cy
cs=001b ss=0023 ds=0023 es=0023 fs=003b gs=0000 efl=00000213
kernel32!UnhandledExceptionFilter+0xa5:
77655a33 call kernel32!IsDebugPortPresent (7765594c)
0:000> p
eax=00000001 ebx=0012f4c8 ecx=0012f3f4 edx=77a10f34 esi=00000000
edi=00000000
eip=77655a38 esp=0012f41c ebp=0012f498 iopl=0 nv up ei pl nz na po nc
cs=001b ss=0023 ds=0023 es=0023 fs=003b gs=0000 efl=00000202
kernel32!UnhandledExceptionFilter+0xaa:
77655a38 test eax,eax
0:000> r eax=0
0:000> p
eax=00000000 ebx=0012f4c8 ecx=0012f3f4 edx=77a10f34 esi=00000000
edi=00000000
eip=77655a3a esp=0012f41c ebp=0012f498 iopl=0 nv up ei pl zr na pe nc
cs=001b ss=0023 ds=0023 es=0023 fs=003b gs=0000 efl=00000246
kernel32!UnhandledExceptionFilter+0xac:
77655a3a jne kernel32!UnhandledExceptionFilter+0×22 (776559a6) [br=0]
Next, we continue to step over using p command until we see
WerpReportExceptionInProcessContext function and step into it:
0:000> p
eax=c0000022 ebx=0012f4c8 ecx=0012f400 edx=77a10f34 esi=00000000
edi=00000001
eip=77655b3c esp=0012f418 ebp=0012f498 iopl=0 nv up ei pl nz na po nc
cs=001b ss=0023 ds=0023 es=0023 fs=003b gs=0000 efl=00000202
kernel32!UnhandledExceptionFilter+0×1ad:
77655b3c call kernel32!WerpReportExceptionInProcessContext (7767aa06)
0:000> t
eax=c0000022 ebx=0012f4c8 ecx=0012f400 edx=77a10f34 esi=00000000
edi=00000001
eip=7767aa06 esp=0012f414 ebp=0012f498 iopl=0 nv up ei pl nz na po nc
cs=001b ss=0023 ds=0023 es=0023 fs=003b gs=0000 efl=00000202
kernel32!WerpReportExceptionInProcessContext:
7767aa06 push 14h
Please purchase PDF Split-Merge on www.verypdf.com to remove this watermark.
Interrupts and Exceptions Explained 125
At this point if we look at the stack trace we would see:
0:000> kL 100
ChildEBP RetAddr
0012f410 77655b41 kernel32!WerpReportExceptionInProcessContext
0012f498 77a29f8e kernel32!UnhandledExceptionFilter+0×1b2
0012f4a0 779b8dd4 ntdll!_RtlUserThreadStart+0×6f
0012f4b4 779b40f0 ntdll!_EH4_CallFilterFunc+0×12
0012f4dc 77a11039 ntdll!_except_handler4+0×8e
0012f500 77a1100b ntdll!ExecuteHandler2+0×26
0012f5a8 77a10e97 ntdll!ExecuteHandler+0×24
0012f5a8 004014f0 ntdll!KiUserExceptionDispatcher+0xf
0012f8a4 00403263
TestDefaultDebugger!CTestDefaultDebuggerDlg::OnBnClickedButton1
0012f8b4 00403470 TestDefaultDebugger!_AfxDispatchCmdMsg+0×43
…
…
…
After that we step over again and find that the code flow returns from all excep-
tion handlers until KiUserExceptionDispatcher function raises exception again via
ZwRaiseException call.
So it looks like the default unhandled exception filter in Vista only reports the
exception and doesn’t launch the error reporting process that displays the error box,
WerFault.exe.
If we click on Debug button on the error reporting dialog to launch the postmor-
tem debugger (I have Visual Studio Just-In-Time Debugger configured in
AeDebug\Debugger registry key) and look at its parent process by using Process
Explorer for example, we would see it is WerFault.exe which in turn has svchost.exe as
its parent.
Now we quit WinDbg and launch TestDefaultDebugger application again, push its
big crash button and when the error reporting dialog appears we attach another in-
stance of WinDbg to svchost.exe process hosting Windows Error Reporting Service
(wersvc.dll).
Please purchase PDF Split-Merge on www.verypdf.com to remove this watermark.
126 PART 2: Professional Crash Dump Analysis
We see the following threads:
0:000> ~*k
. 0 Id: f8c.f90 Suspend: 1 Teb: 7ffdf000 Unfrozen
ChildEBP RetAddr
0008f5b4 77a10080 ntdll!KiFastSystemCallRet
0008f5b8 7760853f ntdll!ZwReadFile+0xc
0008f630 7709ffe2 kernel32!ReadFile+0×20e
0008f65c 7709fdfb ADVAPI32!ScGetPipeInput+0×2a
0008f6c4 7709bdd2 ADVAPI32!ScDispatcherLoop+0×6c
0008f93c 004a241d ADVAPI32!StartServiceCtrlDispatcherW+0xce
0008f944 004a2401 svchost!SvcHostMain+0×12
0008f948 004a2183 svchost!wmain+0×5
0008f98c 77603833 svchost!_initterm_e+0×163
0008f998 779ea9bd kernel32!BaseThreadInitThunk+0xe
0008f9d8 00000000 ntdll!_RtlUserThreadStart+0×23
1 Id: f8c.fa4 Suspend: 1 Teb: 7ffdd000 Unfrozen
ChildEBP RetAddr
0086f6d0 77a10690 ntdll!KiFastSystemCallRet
0086f6d4 779cb65b ntdll!ZwWaitForMultipleObjects+0xc
0086f870 77603833 ntdll!TppWaiterpThread+0×294
0086f87c 779ea9bd kernel32!BaseThreadInitThunk+0xe
0086f8bc 00000000 ntdll!_RtlUserThreadStart+0×23
2 Id: f8c.fa8 Suspend: 1 Teb: 7ffdc000 Unfrozen
ChildEBP RetAddr
0031f81c 77a0f2c0 ntdll!KiFastSystemCallRet
0031f820 71cb1545 ntdll!NtAlpcSendWaitReceivePort+0xc
0031fd3c 71cb63c4 wersvc!CWerService::LpcServerThread+0×9c
0031fd44 77603833 wersvc!CWerService::StaticLpcServerThread+0xd
0031fd50 779ea9bd kernel32!BaseThreadInitThunk+0xe
0031fd90 00000000 ntdll!_RtlUserThreadStart+0×23
3 Id: f8c.2cc Suspend: 1 Teb: 7ffde000 Unfrozen
ChildEBP RetAddr
00f8f768 77a106a0 ntdll!KiFastSystemCallRet
00f8f76c 776077d4 ntdll!NtWaitForSingleObject+0xc
00f8f7dc 77607742 kernel32!WaitForSingleObjectEx+0xbe
00f8f7f0 71cb6f4b kernel32!WaitForSingleObject+0×12
00f8f858 71cb6803 wersvc!CWerService::ReportCrashKernelMsg+0×256
00f8fb7c 71cb6770 wersvc!CWerService::DispatchPortRequestWorkItem+0×70a
00f8fb90 779c1fbb
wersvc!CWerService::StaticDispatchPortRequestWorkItem+0×17
00f8fbb4 77a1a2b8 ntdll!TppSimplepExecuteCallback+0×10c
00f8fcdc 77603833 ntdll!TppWorkerThread+0×522
00f8fce8 779ea9bd kernel32!BaseThreadInitThunk+0xe
00f8fd28 00000000 ntdll!_RtlUserThreadStart+0×23
Please purchase PDF Split-Merge on www.verypdf.com to remove this watermark.
Interrupts and Exceptions Explained 127
4 Id: f8c.1b38 Suspend: 1 Teb: 7ffdb000 Unfrozen
ChildEBP RetAddr
00d3fe08 77a10850 ntdll!KiFastSystemCallRet
00d3fe0c 77a1a1b4 ntdll!NtWaitForWorkViaWorkerFactory+0xc
00d3ff34 77603833 ntdll!TppWorkerThread+0×1f6
00d3ff40 779ea9bd kernel32!BaseThreadInitThunk+0xe
00d3ff80 00000000 ntdll!_RtlUserThreadStart+0×23
First, it looks like some LPC notification mechanism is present here
(CWerService::LpcServerThread).
Next, if we look at CWerService::ReportCrashKernelMsg code we would see it calls
CWerService::ReportCrash which in turn loads faultrep.dll
0:000> .asm no_code_bytes
Assembly options: no_code_bytes
0:000> uf wersvc!CWerService::ReportCrashKernelMsg
…
…
…
wersvc!CWerService::ReportCrashKernelMsg+0×226:
71cb6f13 lea eax,[ebp-20h]
71cb6f16 push eax
71cb6f17 push dword ptr [ebp-34h]
71cb6f1a push dword ptr [ebp-2Ch]
71cb6f1d call dword ptr [wersvc!_imp__GetCurrentProcessId (71cb1120)]
71cb6f23 push eax
71cb6f24 mov ecx,dword ptr [ebp-38h]
71cb6f27 call wersvc!CWerService::ReportCrash (71cb7008)
71cb6f2c mov dword ptr [ebp-1Ch],eax
71cb6f2f cmp eax,ebx
71cb6f31 jl wersvc!CWerService::ReportCrashKernelMsg+0×279 (71cb6a10)
…
…
…
0:000> uf wersvc!CWerService::ReportCrash
…
…
…
wersvc!CWerService::ReportCrash+0×3d:
71cb7045 mov dword ptr [ebp-4],edi
71cb7048 push offset wersvc!`string’ (71cb711c)
71cb704d call dword ptr [wersvc!_imp__LoadLibraryW (71cb1144)]
71cb7053 mov dword ptr [ebp-2Ch],eax
71cb7056 cmp eax,edi
71cb7058 je wersvc!CWerService::ReportCrash+0×52 (71cb9b47)
Please purchase PDF Split-Merge on www.verypdf.com to remove this watermark.
128 PART 2: Professional Crash Dump Analysis
wersvc!CWerService::ReportCrash+0×88:
71cb705e push offset wersvc!`string’ (71cb7100)
71cb7063 push eax
71cb7064 call dword ptr [wersvc!_imp__GetProcAddress (71cb1140)]
71cb706a mov ebx,eax
71cb706c cmp ebx,edi
71cb706e je wersvc!CWerService::ReportCrash+0×9a (71cb9b7d)
…
…
…
0:000> du 71cb711c
71cb711c ―faultrep.dll‖
0:000> da 71cb7100
71cb7100 ―WerpInitiateCrashReporting‖
If we attach a new instance of WinDbg to WerFault.exe and inspect its threads
we would see:
0:003> ~*k
0 Id: 1bfc.16c4 Suspend: 1 Teb: 7ffdf000 Unfrozen
ChildEBP RetAddr
0015de60 77a10690 ntdll!KiFastSystemCallRet
0015de64 77607e09 ntdll!ZwWaitForMultipleObjects+0xc
0015df00 77b6c4b7 kernel32!WaitForMultipleObjectsEx+0×11d
0015df54 77b68b83 USER32!RealMsgWaitForMultipleObjectsEx+0×13c
0015df70 6d46d90d USER32!MsgWaitForMultipleObjects+0×1f
0015dfc0 6d4acd77 wer!UtilMsgWaitForMultipleObjects+0×8a
0015dff4 6d4a7694 wer!CInitialConsentUI::Show+0×133
0015e040 6d4a9a69 wer!CEventUI::GetInitialDialogSelection+0xc6
0015e104 6d46df18 wer!CEventUI::Start+0×32
0015e39c 6d46b743 wer!CWatson::ReportProblem+0×438
0015e3ac 6d46b708 wer!WatsonReportSend+0×1e
0015e3c8 6d46b682 wer!CDWInstance::WatsonReportStub+0×17
0015e3ec 6d472a7f wer!CDWInstance::SubmitReport+0×21e
0015e410 730b6d0d wer!WerReportSubmit+0×5d
0015f33c 730b73c1 faultrep!CCrashWatson::GenerateCrashReport+0×5c4
0015f5d4 730b4de1 faultrep!CCrashWatson::ReportCrash+0×374
0015fad4 009bd895 faultrep!WerpInitiateCrashReporting+0×304
0015fb0c 009b60cd WerFault!UserCrashMain+0×14e
0015fb30 009b644a WerFault!wmain+0xbf
0015fb74 77603833 WerFault!_initterm_e+0×163
Please purchase PDF Split-Merge on www.verypdf.com to remove this watermark.
Interrupts and Exceptions Explained 129
1 Id: 1bfc.894 Suspend: 1 Teb: 7ffde000 Unfrozen
ChildEBP RetAddr
024afbf8 77a10690 ntdll!KiFastSystemCallRet
024afbfc 77607e09 ntdll!ZwWaitForMultipleObjects+0xc
024afc98 77b6c4b7 kernel32!WaitForMultipleObjectsEx+0×11d
024afcec 74fa161a USER32!RealMsgWaitForMultipleObjectsEx+0×13c
024afd0c 74fa2cb6 DUser!CoreSC::Wait+0×59
024afd34 74fa2c55 DUser!CoreSC::WaitMessage+0×54
024afd44 77b615c0 DUser!MphWaitMessageEx+0×22
024afd60 77a10e6e USER32!__ClientWaitMessageExMPH+0×1e
024afd7c 77b6b5bc ntdll!KiUserCallbackDispatcher+0×2e
024afd80 77b61598 USER32!NtUserWaitMessage+0xc
024afdb4 77b61460 USER32!DialogBox2+0×202
024afddc 77b614a2 USER32!InternalDialogBox+0xd0
024afdfc 77b61505 USER32!DialogBoxIndirectParamAorW+0×37
024afe1c 75036c51 USER32!DialogBoxIndirectParamW+0×1b
024afe40 75036beb comctl32!SHFusionDialogBoxIndirectParam+0×2d
024afe74 6d4a65a4 comctl32!CTaskDialog::Show+0×100
024afebc 6d4acb72 wer!IsolationAwareTaskDialogIndirect+0×64
024aff4c 6d4acc39 wer!CInitialConsentUI::InitialDlgThreadRoutine+0×369
024aff54 77603833
wer!CInitialConsentUI::Static_InitialDlgThreadRoutine+0xd
024aff60 779ea9bd kernel32!BaseThreadInitThunk+0xe
2 Id: 1bfc.1a04 Suspend: 1 Teb: 7ffdc000 Unfrozen
ChildEBP RetAddr
012bf998 77a10690 ntdll!KiFastSystemCallRet
012bf99c 77607e09 ntdll!ZwWaitForMultipleObjects+0xc
012bfa38 77b6c4b7 kernel32!WaitForMultipleObjectsEx+0×11d
012bfa8c 74fa161a USER32!RealMsgWaitForMultipleObjectsEx+0×13c
012bfaac 74fa1642 DUser!CoreSC::Wait+0×59
012bfae0 74fac442 DUser!CoreSC::xwProcessNL+0xaa
012bfb00 74fac3a2 DUser!GetMessageExA+0×44
012bfb54 779262b6 DUser!ResourceManager::SharedThreadProc+0xb6
012bfb8c 779263de msvcrt!_endthreadex+0×44
012bfb94 77603833 msvcrt!_endthreadex+0xce
012bfba0 779ea9bd kernel32!BaseThreadInitThunk+0xe
012bfbe0 00000000 ntdll!_RtlUserThreadStart+0×23
# 3 Id: 1bfc.14a4 Suspend: 1 Teb: 7ffdb000 Unfrozen
ChildEBP RetAddr
02a1fc40 77a3f0a9 ntdll!DbgBreakPoint
02a1fc70 77603833 ntdll!DbgUiRemoteBreakin+0×3c
02a1fc7c 779ea9bd kernel32!BaseThreadInitThunk+0xe
02a1fcbc 00000000 ntdll!_RtlUserThreadStart+0×23
Next, we put a breakpoint on CreateProcess, push Debug button on the error
reporting dialog and upon the breakpoint hit inspect CreateProcess parameters:
0:003> .asm no_code_bytes
Assembly options: no_code_bytes
Please purchase PDF Split-Merge on www.verypdf.com to remove this watermark.
130 PART 2: Professional Crash Dump Analysis
0:003> bp kernel32!CreateProcessW
0:003> g
Breakpoint 0 hit
eax=00000000 ebx=00000000 ecx=7ffdf000 edx=0015db30 esi=00000001
edi=00000000
eip=775c1d27 esp=0015dfe0 ebp=0015e408 iopl=0 nv up ei pl nz na po nc
cs=001b ss=0023 ds=0023 es=0023 fs=003b gs=0000 efl=00000202
kernel32!CreateProcessW:
775c1d27 mov edi,edi
0:000> ddu esp+8 l1
0015dfe8 008b0000 ‖”C:\WINDOWS\system32\vsjitdebugger.exe” -p 8064 -e 312‖
ESP points to return address, ESP+4 points to the first CreateProcess parameter
and ESP+8 points to the second parameter. The thread stack now involves faultrep.dll:
0:000> k
ChildEBP RetAddr
0020dde0 730bb2b5 kernel32!CreateProcessW
0020e20c 730b6dae faultrep!WerpLaunchAeDebug+0×384
0020f140 730b73c1 faultrep!CCrashWatson::GenerateCrashReport+0×665
0020f3d8 730b4de1 faultrep!CCrashWatson::ReportCrash+0×374
0020f8d8 009bd895 faultrep!WerpInitiateCrashReporting+0×304
0020f910 009b60cd WerFault!UserCrashMain+0×14e
0020f934 009b644a WerFault!wmain+0xbf
0020f978 77603833 WerFault!_initterm_e+0×163
0020f984 779ea9bd kernel32!BaseThreadInitThunk+0xe
0020f9c4 00000000 ntdll!_RtlUserThreadStart+0×23
Therefore it looks like calls to faultrep.dll module to report faults and launch the
postmortem debugger were moved from UnhandledExceptionFilter to WerFault.exe in
Vista.
Finally, let’s go back to our UnhandledExceptionFilter function. If we disassemble
it we would see that it can call kernel32!WerpLaunchAeDebug too:
0:000> .asm no_code_bytes
Assembly options: no_code_bytes
0:000> uf kernel32!UnhandledExceptionFilter
…
…
…
kernel32!UnhandledExceptionFilter+0×2d0:
77655c5f push dword ptr [ebp-28h]
77655c62 push dword ptr [ebp-1Ch]
77655c65 push dword ptr [ebx+4]
77655c68 push dword ptr [ebx]
Please purchase PDF Split-Merge on www.verypdf.com to remove this watermark.
Interrupts and Exceptions Explained 131
77655c6a push 0FFFFFFFEh
77655c6c call kernel32!GetCurrentProcess (775e9145)
77655c71 push eax
77655c72 call kernel32!WerpLaunchAeDebug (7767baaf)
77655c77 test eax,eax
77655c79 jge kernel32!UnhandledExceptionFilter+0×2f3 (77655c82)
…
…
…
kernel32!UnhandledExceptionFilter+0×303:
77655c92 mov eax,dword ptr [ebx]
77655c94 push dword ptr [eax]
77655c96 push 0FFFFFFFFh
77655c98 call dword ptr [kernel32!_imp__NtTerminateProcess (775c14bc)]
If we look at WerpLaunchAeDebug code we would see that it calls CreateProcess
too and the code is the same as in faultrep.dll. This could mean that faultrep.dll imports
that function from kernel32.dll. Therefore some postmortem debugger launching code
is still present in the default unhandled exception filter perhaps for compatibility or in
case WER doesn’t work or disabled.
High-level description of the differences between Windows XP and Vista applica-
tion crash support can be found in the following Mark Russinovich’s article:
Inside the Windows Vista Kernel: Part 3 (Enhanced Crash Support)
(
Please purchase PDF Split-Merge on www.verypdf.com to remove this watermark.
132 PART 2: Professional Crash Dump Analysis
ANOTHER LOOK AT PAGE FAULTS
Recently observed this bugcheck with reported “valid” address (in bold):
DRIVER_IRQL_NOT_LESS_OR_EQUAL (d1)
An attempt was made to access a pageable (or completely invalid) address
at an
interrupt request level (IRQL) that is too high. This is usually
caused by drivers using improper addresses.
If kernel debugger is available get stack backtrace.
Arguments:
Arg1: e16623fc, memory referenced
Arg2: 00000002, IRQL
Arg3: 00000000, value 0 = read operation, 1 = write operation
Arg4: ae2b222e, address which referenced memory
TRAP_FRAME: a54a4a40 -- (.trap 0xffffffffa54a4a40)
ErrCode = 00000000
eax=00000000 ebx=00000000 ecx=e16623f0 edx=00000000 esi=ae2ce428
edi=a54a4b4c
eip=ae2b222e esp=a54a4ab4 ebp=a54a4ac4 iopl=0 nv up ei pl nz ac po nc
cs=0008 ss=0010 ds=0023 es=0023 fs=0030 gs=0000 efl=00010212
driver!ProcessCommand+0x44:
ae2b222e 39590c cmp dword ptr [ecx+0Ch],ebx ds:0023:e16623fc=00000000
1: kd> dd e16623fc l4
e16623fc 00000000 00790000 004c4c44 00010204
The address belongs to a paged pool:
1: kd> !pool e16623fc
Pool page e16623fc region is Paged pool
e1662000 size: 3a8 previous size: 0 (Allocated) NtfF
e16623a8 size: 10 previous size: 3a8 (Free) ….
e16623b8 size: 28 previous size: 10 (Allocated) Ntfo
e16623e0 size: 8 previous size: 28 (Free) CMDa
*e16623e8 size: 20 previous size: 8 (Allocated) *DRV
So why do we have the bugcheck here if the memory wasn’t paged out? This is
because page faults occur when pages are marked as invalid in page tables and not only
when they are paged out to a disk. We can check whether an address belongs to an
invalid page by using !pte command:
Please purchase PDF Split-Merge on www.verypdf.com to remove this watermark.