Influence of nisubstitution for mn on the structure and ionic conductivity of linixmn2 xo4 spinel materials prepaired by the sol gel method
Bạn đang xem bản rút gọn của tài liệu. Xem và tải ngay bản đầy đủ của tài liệu tại đây (824.54 KB, 12 trang )
TẠP CHÍ KHOA HỌC SỐ 20/2017
75
INFLUENCE OF NiSUBSTITUTION FOR Mn ON THE STRUCTURE
AND IONIC CONDUCTIVITY OF LiNixMn2-xO4 SPINEL MATERIALS
PREPAIRED BY THE SOL-GEL METHOD
Ta Anh Tan1, Le Huy Son1, Dang Tran Chien2
1
Faculty of Natural Sciences,Hanoi Metropolitan University
2
Hanoi University of Natural Resources and Environment
Abstract: Electrode materials LiNixMn2-xO4 with (x = 0; 0.05; 0.1; 0.2) were synthesized
by the sol-gel method from lithium acetate, manganese acetate and nikel acetate. The FESEMs show that the morphology of the material changes when the anealing temperature
and the proportion replacement of Mn with Ni changes. XRDs confirmed that the samples
have LiNixMn2-xO4 spinel structures without any contaminants. Lattice constants of the
material increase with annealing temperature and decrease when Ni ratio substitution
increases. As the proportion replacement of Ni increases, the particle size of the LiNixMn2xO4 samples decreases while the grain boundary changes from the rounded form at x = 0
to the form of sharp edges at x = 0.1 and 0.2. These results show the effect of nickel doping
on crystal stability. The studies of impedance spectroscopy were applied to the bulk
materials showing the Li+ ion conductivity of the material. The results indicate that
substituting Ni for Mn improved the conductivity of the materials tp = 19,773 × 10-5
S.cm-1 with x = 0.1, anealing temperature at 700 °C compared to tp = 0.111 × 10⁻⁵ S.cm1 of the samples with x = 0.
Keywords: Electrode materials, LiNixMn2-xO4, Liti-ion batteries, Ion conductivity, Ni
substitution.
Email:
Received 05 December 2017
Accepted for publication 25 December 2017
1. INTRODUCTION
Cathode materials for lithium ion battery are based on three basic materials. Those are:
i/ LiCoO2 layer structure (LCO); ii/ LiMn2O4 (LMO) spinel structure; iii/ LiFePO4 olivine
structures (LFP). These are materials that exchange and store H+ and Li+ ions very well, and
they are the basis materials used for making cathode electrodes in lithium ion batteries (LIBs).
76
TRƯỜNG ĐẠI HỌC THỦ ĐÔ HÀ NỘI
The most important thing is that ion-exchange electrode materials used in lithium ion
batteries must simultaneously have high electron conductivity and conductivity. However,
the recent works have shown that ionic conductivity of LiMn2O4 reached the value of
10-6 ÷ 10-10S.cm-1 [1]. This low value of ionic conductivity leads to weakness of the
electrochemical activity and slowness of the flow rate of the battery cycling.
Thus, many studies have attempted to improve the ionic conductivity of the materials
such as changing in the methods of fabrication; synthesis temperature or replacement of Mn
in LiMn2O4 with the metals (Li, Co, Ni, Al, Mg, Cr, Fe). These can improve the conductivity
of the materials. Among these materials, LiNixMn2-xO4 shows the best charging/discharging
stability [2-6]. Although LiNixMn2-xO4 performs a good improvement in lithium ion
conductivity and stability during charging/discharging but if a large amount of Ni
substitution for Mn can significantly reduce power at 4 V. Therefore, most studies on
LiNixMn2-xO4 have been limited with x ≤ 0.2 for stable crystalline structure and optimum
electrochemical efficiency [7, 8].
There are many methods used for synthesis of the LiNixMn2-xO4 spinel such as: solid
phase reaction method [9]; sol-gel method [10]; polime spray [11]; hydrothermal[12], etc…
However, in this study, the LiNixMn2-xO4 spinel with (x = 0; 0.05; 0.1 and 0.2) were
fabricated by the sol-gel method. This is a simple technology method, high economic
efficiency and can be produced in large quantities.
2. EXPERIMENTAL
LiNixMn2-xO4 ion-conducting materials are made from lithium acetate, manganese
acetate and nickel acetate based on the ratio of atomic composition Li: Ni: Mn = 1: x :2 - x
with (x = 0; 0.05; 0.1 and 0.2). The initial materials were dissolved in deionized water at a
certain ratio of solubility, then stirred at 80 °C for 10 hours (to get the gel formation, citric
acid is added at a ratio of Li: Mn: citric = 1: 2: 3 and the pH is kept at 7 by addition of NH3)
then a gel is formed. This gel is dried in air for 15 hours at the temperature of 120 °C. Finally,
the materials were anealed at temperature of 300 °C; 500 °C; 700 °C; and 800 °C for 6 hours.
The samples are denoted as in Tab 1.
The X-ray diffraction system D5005 SIEMEN with the CuKα emission source (λ =
1.5406Å) was used to investigate the structural characteristics of the materials. The constants
of the lattices and crystal structure parameters were determined by Sherrer mode and Unitcell
software. Morphological characteristics were examined with scanning electron microscope
FE-SEM HITACHI 4800.
TẠP CHÍ KHOA HỌC SỐ 20/2017
77
Tab. 1. Symbol of LiNixMn2-xO4 with Ni substitution x = 0, 0.05, 0.1 and 0.2 at anealing
temperature of 300 °C, 500 °C, 700 °C and 800 °C.
Sample symbol
LiNixMn2-xO4
Temperature (C)
G0-300
x = 0
300
G0-500
x = 0
500
G0-700
x = 0
700
G0-800
x = 0
800
G1-300
x = 0,05
300
G1-500
x = 0,05
500
G1-700
x = 0,05
700
G1-800
x = 0,05
800
G2-300
x = 0,1
300
G2-500
x = 0,1
500
G2-700
x = 0,1
700
G2-800
x = 0,1
800
G3-300
x = 0,2
300
G3-500
x = 0,2
500
G3-700
x = 0,2
700
G3-800
x = 0,2
800
Impedance spectra were applied to investigate the
ionic conductivity of the samples via electrochemical
systems Autolab PSGTAT 100. The ionic conductivity of
the material is determined by the method of matching the
experimental results using the NOVA software. The
samples were prepared by pressing a 1cm- diameter pellet
with a pressure of 40 MPa/cm2. A Au electrode with a
diameter of 0.8 cm and a thickness of 1 μm was deposited
on both sizes of each sample using the vacuum evaporation
method. The pattern is described in fig.1.
Fig. 1. Sample for impedance
spectrometry
78
TRƯỜNG ĐẠI HỌC THỦ ĐÔ HÀ NỘI
3. RESULTS AND DISCUSSION
3.1. Effect of temperature on morphology of LiNixMn2-xO4 materials
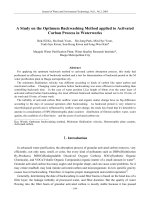
Fig. 2. SEM images of the LiNixMn2-xO4 materials with replacement ratio of Ni (x = 0)
synthesized by the sol - gel methood and then annealed at 300 °C; 500 °C; 700 °C and
800 °C
Fig. 3. SEM images of the LiNixMn2-xO4 materials with replacement ratio Ni ( x = 0.05;
0.1 and 0.2) annealed at 300 °C
Fig. 4. SEM images of the iNixMn2-xO4 materials with replacement ratioof Ni ( x = 0.05;
0.1 and 0.2) annealed at 500 °C
Fig. 5. SEM images of the LiNixMn2-xO4 materials with replacement ratio of Ni (x = 0.05;
0.1 and 0.2) annealed at 700 °C.
TẠP CHÍ KHOA HỌC SỐ 20/2017
79
Fig. 6. SEM images of the LiNixMn2-xO4 materials with replacement ratio Ni ( x = 0.05;
0.1 and 0.2) annealed at 800 °C.
The images from Figures 2 to 6, are the SEM images of the LiNixMn2-xO4 material
samples with different proportions of Ni molecules and at the anealing temperatureof 300 °
C; 500 °C; 700 °C and 800 °C. SEM images show that the morphology of the LiNixMn2-xO4
materials with the replacement ratio of Ni (x ranges 0 to 0.2) with annealing temperature at
from 300 °C to 500 °C. The grain sizes change very little while being grouped into clusters.
When the anealing temperature increases, the particles tend to separate, and at the
temperature at from 700 °C to 800 °C the particle sizes increase very strongly. The average
size of LiNixMn2-xO4 crystal particles calculated from the SEM image are shown in Tab 2.
The above results show that the size of the crystalline particles depends strongly on the
anealing process.
Tab. 2. Everage value of LiNixMn2-xO4 particle annealed at different temperatures
LiNixMn2-xO4
T = 300 C
T = 500 C
T = 700 C
T = 800 C
x =0
45 nm
54 nm
95 nm
500 nm
x =0,05
20 nm
45 nm
100 nm
580 nm
x = 0,1
58 nm
60 nm
120 nm
310 nm
x = 0,2
42 nm
40 nm
130
270
At temperatures below 500 °C, the grain size changes little when the annealing
temperature between 300 °C and 500 °C. When the anneaing temperature is increased to 700
°C, particle size increases significantly and particles tend to separate. Especially at 800 °C
the particles grow very fast and the size increasesseveral times. The rapid growth of particle
size at temperatures of 700 °C and 800 °C is due to the formation of LiMn2O4 at about 700
°C (698 °C). This has been pointed out from the schema differential thermal analysis of the
sample DTG and DTA of the LiMn2O3 [13] and it also explains why at 800 °C particle size
increased several times compared to that at below 700 °C.
80
TRƯỜNG ĐẠI HỌC THỦ ĐÔ HÀ NỘI
3.2. Effect of Ni replacement ratio on the morphology of the LiNixMn2-xO4
materials
SEM images (Figure 2 ÷ 6) show that at temperatures below 700 °C, replacement ratio
of Ni dose not impact to the crystal particle size (the sizes ranged from 40 nm to 60 nm). At
a temperature of 700 °C the particle size decreases, the grain boundary changes from round
to sharp when the replacement ratio of the Ni molecule increases. This demonstrates that the
presence ofNi increases the stability of the spinel structure of the LiMn2O4 materials. It is
perfectly suited to the study [2, 6]. In this work, Ni substituted for Mn reduces lattice
distortion Jahn - Teller [14-16]. In other words, there was a substitution of Ni atoms for Mn
atoms in the LiNixMn2-xO4 material produced by the sol-gel method.
3.3. Structural characteristics of LiNixMn2-xO4 materials
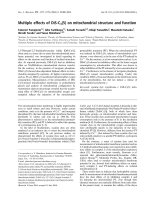
Fig. 7. Crystal structure of LiMn2O4 materials (a). Illustrate the diffusion of Li through
location 16c (b). The black arrow indicates the diffusion path of the Li+ ion.
+
As known at room temperature, the LiMn2O4 spinel materials have a cubic structure
with the space group Fd-3m, where the Li, Mn and O atoms respectively occupy positions
8a, 16d, and 32e [17]. Meanwhile lattice structure and the arrangement of atoms in the lattice
can be shown as in Figure 7a and the formation of Li+ ion channel through the octahedral as
presented in Figure 7b.
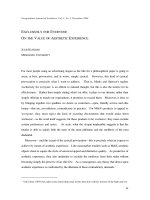
Fig. 8. XRD spectra of LiNixMn2-xO4 materials with Ni substitution x = 0 (a) and 0.05 (b)
synthesized by the sol-gel method at 300 °C; 500 °C; 700 °C and 800 °C.
TẠP CHÍ KHOA HỌC SỐ 20/2017
81
Fig. 9. XRD spectra of LiNixMn2-xO4 materials with Ni substitution x = 0.1 (a) and 0.2 (b)
synthesized bythe sol-gel method at 300 °C; 500 °C; 700 °C and 800 °C.
Fig. 8 and 9 are the XRD spectra of G0, G1, G2 and G3 samples synthesized by the solgel method at 300 °C; 500 °C; 700 °C and 800 °C. At all Ni replacement ratioes and
annealing temperatures, all diffraction peaks on the XRD spectra match a single JPCDS No
35-0782. This suggests that substituting Ni with proportions (x = 0 ÷ 0 .2) did not change
the structure of LiNixMn2-xO4 materials compared to the structure of the original LiMn2O4
spinel materials. This result shows that Ni has replaced the Mn position in the crystal lattice.
In other words, LiNixMn2-xO4 materials have been successfully synthesized in which the
substitution of Ni for Mn with the ratio of x = 0; 0.05; 0.1 and 0.2. However, X-ray
diffraction is only sufficient to show that the vertices of the spinel material phase are formed
without being able to show whether the material produced contains Ni ions. In order to obtain
the proof of this substitution in the formulated samples, we proceeded to analyze the Raman
spectra of Ni substitution samples for Mn.
Fig. 10. Raman Spectra of G0-700 and
G2-700 (LiNixMn2-xO4 replacement
ratio of Ni x = 0 (a) and x =0,1 (b).
82
TRƯỜNG ĐẠI HỌC THỦ ĐÔ HÀ NỘI
Fig.10 is the Raman scattering spectra of the samples G0-700 and G2-700. Fig.10a, the
Raman spectra of spinel LiMn2O4 shows a broad and strong region (Ranging Mn-O
stretching) at ~ 620 cm-1 accompanied by a small peak at ~ 580 cm-1.
They are closely related to the octahedral MnO6 and the oxidation state of Mn,
respectively called A1g and F
( )
[18]. The expansion of the A1g region is due to the small
difference in the octahedral Mn4+O6 octahedral structure and the octahedral Mn3+O6 is
partially distorted in LiMn2O4. Its intensity depends on the concentration of Mn4+ in the
material and reflects the average oxidation state of Mn. For this reason, according to Yingjin
Wei and colleagues [18] the regions A1g and F
( )
are not separated in unmodified LiMn2O4
because the concentrations of Mn3+ and Mn4+ are equal in the material. Then F
( )
is clearly
distinguished by the substitution of Ni and the sequence A1g becomes distinct and sharper
from the region F
( )
. The change in A1g and F
( )
with the replacement of Ni is consistent
with the increase in Mn4+ concentration as well as the increase of Mn oxidation state in
LiNixMn2-xO4. Peak F
( )
derives primarily from the oscillation of the Mn4+- O bond. Its
intensity depends on the concentration of Mn4+ in the medium reflecting the oxidation state
of Mn in Figure 10b.
3.4. Effects of temperature and Ni substitution ratio on the lattice constants of
the materials
Fig. 11. Dependence of the lattice constants on the Ni (a)
ratio and the annealing temperature (b).
Fig.11 showed the dependence of the lattice constant on the annealing temperature.
(Fig.11b) and the substitution ratio of Ni for Mn (Fig.11a). As can be seen from Fig.11b,
TẠP CHÍ KHOA HỌC SỐ 20/2017
83
lattice constant of the materials increased slightly,about 0.015 Å when the annealing
temperature increased from 300 °C to 800 °C. The increase of crystalline lattice constant of
the LiNixMn2-xO4 materials is explained by the transition of Mn4+ to Mn3+ (LS or HS) and
the transition of Mn3+ (LS) to Mn3+ (HS) as the annealing temperature increases. Fig. 11 a
shows that the crystal lattice constant of the material decreases to 0.023 Å when the
replacement ratio of Ni increases from x = 0 to x= 0.2. From XRD spectra shown in fig. 8
and 9, one can find in all the samples, the substitution ratio of Ni for Mn increases, the
diffraction peak at angle 20 is higher. This suggests that the lattice constant of the material
is reduced when the replacement ratio of Ni increases [18]. It is explained that when the
replacement ratio of Ni in the LiNixMn2-xO4 materials increases leading to increase of the
Mn4+ concentration. The ionic radius of Mn4 + (r = 0.53 Å) is much smaller than Mn3+ (r =
0.645 Å). The ionic radius of Ni3+ (r = 0.56 Å) is smaller than the radius of Mn3+ ion (r =
0.645 Å) [19]. When Mn3+ion is replaced by Ni3+ ion, Mn - O distance was reduced. Oxygen
defect spaces at high annealing temperatures were also reduced [18].
3.5. Li + ion conductivity of the materials system
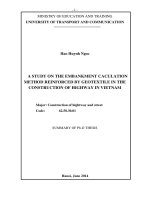
Fig.12 showed the typical Nyquist plot in the complex plane presented the imaginary
part Z" depends on the real part Z'of LiNixMn2-xO4 materials at room temperature. The
impedance spectra consist of two semicircular regions. A semicircular in the high frequency
region from 1MHz to a few tens Hz, they are attributed to the lithium ion conduction in the
particle and a semicircular in the low frequency region is attributed to the ionic conduction
at the grain boundary [19, 20]. Total resistance (Rb + Rgb) and bulk resistor (Rb) of the
samples correspond to block point on the right and the left of the semicircular with the real
axis in the schema. The value of the grain boundary resistance (Rgb) is reflected by the
difference between (Rb + Rgb) and Rb.
Fig. 12. Nyquist diagram of LiNixMn2-xO4 doped Ni (x = 0; 0.1 and 0.2) synthesized by Sol-gel at
700 °C (a) and block points of the two regions of the semicirculars (b).
84
TRƯỜNG ĐẠI HỌC THỦ ĐÔ HÀ NỘI
Fig.12 showed that when synthesis temperature or ratio of Ni change, it leads to
changing block point in both of the low frequency and high frequency on the Nyquits
diagram. This shows that the Rb and Rgb resistors are all change and the particle conductivity
b and grain boundary conductivity gb of the materials will depend on both synthesis
temperature and replacement ratio of Ni with Mn.
The dependence of the conductivity on the nickel substitution ratio and the synthetic
temperature are shown in Fig.13 and 14.
The calculation results of the lithium ion conductivity of LiNixMn2-xO4 materials
showed that the lithium ion conductivity changed when the nickel replacement ratio and
annealing temperature changed. In particular, the LiNixMn2-xO4 materials have a nickel
replacement ratio of x = 1 annealed at 700 °C gives the best lithium ion conductivity (G2700 sample) with the largest total conductivity tp = 19,773×10-5 S.cm-1. On the contrary,
samples G0-500 with the smallest conductivity tp = 0,116×10-5 S.cm-1.
Fig.13. Influence of synthesis temperature on ion conductivity of LiNixMn2-xO4 synthesized by
sol-gel method (G0, G1, G2 and G3).
Fig.14. Influence of the mixing ratio of Ni on the ion conductivity of the LiNixMn2-xO4 materials
synthesized by the sol-gel method (G0, G1, G2 and G3 ).
4. CONCLUSION
LiNixMn2-xO4 materials have been successfully fabricated by the sol-gel method.
Particle size increases as the annealing temperature increases and decreases when the
TẠP CHÍ KHOA HỌC SỐ 20/2017
85
substitution ratio of Ni substituted for Mn increases. The surface of the LiNixMn2xO4particles from the rounded form turns sharp when the ratio of Ni increases. Particle
sizeschange in the range of 30 nm to 500 nm. The lattice constant (a) of the materials
increases with increase of the annealing temperature and decreases with the increase of the
ratio of Ni. The values are between 8.21 and 8.24 Å. The ionic conductivity of the materials
is strongly dependent on the substitution ratio of Ni molecules for Mn.The sample has the
best conductivity at the ratioof x = 0.1; T = 700 °C and gives the maximum ionic conductivity
tp = 19,773.10-5 S.cm-1.
REFERENCES
1.
2.
3.
4.
5.
6.
7.
8.
9.
10.
11.
Wu.M, B.Xu, and .C.Ouyang (2016), Physicsofelectronandlithium-iontransportin
electrodematerialsforLi-ionbatteries. Chin.Phys.B, 25(1): p.018206
Xin.G, et al. (2012), Synthesis of Spinel LiNixMn2-xO4 (x=0, 0.1, 0.16) and Their High Rate
Charge-Discharge Performances Int. J. Electrochem. Sci, 7: pp.2504 – 2512
Kebede.M.A, et al (2013), Synthesis and Electrochemical Properties of Ni Doped Spinel
LiNixMn2-xO4 (0 ≤ x ≤ 0.5) Cathode Materials for Li-Ion Battery. ECS Transactions, 50(40):
pp.1-14
Wang.F.X , et al (2013), Spinel LiNixMn2−xO4 as cathode material for aqueous rechargeable
lithium batteries. Electrochimica Acta, 93: pp.301-306.
Adnan Hafez.M, K.Mohammad Bashir, and K. Ahmed Khaled (2016), Studying Structural and
Optical Properties of Thin Films LiNixMn2-xO4 (x = 0, 0.4, 0.5, 0.6) Prepared by Sol-Gel Method
American Journal of Nanosciences, 2(4): pp.46-50.
Purwaningsih.D, R.Roto, and H.Sutrisno (2016), Synthesis of LiNix Mn2-xO4 by low-temperature
solid-state reaction and its microstructure. IOP Conference Series: Materials Science and
Engineering, 107(1): pp.012-033.
Guo.D, et al (2014), Facile synthesis of LiAl0.1Mn1.9O4 as cathode material for lithium ion
batteries: towards rate and cycling capabilities at an elevated temperature. Electrochimica
Acta, 134: pp.338-346.
Lee.Y-S, N.Kumada, and M.Yoshio (2001), Synthesis and characterization of lithium
aluminum-doped spinel (LiAlxMn2−xO4) for lithium secondary battery. Journal of Power
Sources, 96(2): pp.376-384.
Liu. B-S, et al (2015), Preparation of submicrocrystal LiMn2O4 used Mn3O4 as precursor and
its electrochemical performance for lithium ion battery. Journal of Alloys and Compounds, 622:
pp.902-907.
Wang.S, et al (2015), Preparation of spinel LiNi0.5Mn1.5O4 and Cr-doped LiNi0.5Mn1.5O4 cathode
materials by tartaric acid assisted sol–gel method. Ceramics International, 41(1, Part B):
pp.1347-1353.
Karthick.S.N, et al (2010), Nanocrystalline LiMn2O4 thin film cathode material prepared by
polymer spray pyrolysis method for Li-ion battery. Journal of Alloys and Compounds, 489(2):
pp.674-677.
86
TRƯỜNG ĐẠI HỌC THỦ ĐÔ HÀ NỘI
12. Xia.H, et al (2012), Ultrafine LiMn2O4/carbon nanotube nanocomposite with excellent rate
capability and cycling stability for lithium-ion batteries. Journal of Power Sources, 212:
pp.28-34.
13. Phạm Duy Long (2002), Chế tạo màng mỏng oxit kim loại chuyển tiếp (W, Mn) và nghiên cứu
các tính chất điện sắc, tích trữ ion của chúng. Luận án Tiến sĩ Khoa học Vật liệu, Vien Han lam
Khoa hoc va Cong nghe Viet Nam.
14. Shi.S, et al (2003), First-principles studies of cation-doped spinel LiMn2O4 for lithium ion
batteries. Physical Review B, 67(11): p.115130.
15. Arroyo y de Dompablo, M.E. and J.Morales (2006), A First-Principles Investigation of the Role
Played by Oxygen Deficiency in the Electrochemical Properties of LiCu0.5Mn1.5O4−δ Spinels.
Journal of The Electrochemical Society, 153(11): pp.A2098-A2102.
16. Yi T-F, Y-R.Zhu, and R-S.Zhu (2008), Density functional theory study of lithium intercalation
for 5 V LiNi0.5Mn1.5O4 cathode materials. Solid State Ionics, 179(38): pp.2132-2136.
17. Zhong.Q, et al (1997), Synthesis and Electrochemistry of LiNixMn2−x O4. Journal of The
Electrochemical Society, 144(1): pp.205-213.
18. Wei.Y, et al (2006), Spectroscopic studies of the structural properties of Ni substituted spinel
LiMn2O4. Solid State Ionics, 177(1–2): pp.29-35.
19. Bauerle. J.E (1969), Study of solid electrolyte polarization by a complex admittance method.
Journal of Physics and Chemistry of Solids, 30(12): pp.2657-2670.
20. Mariusz.K.R.Marta, and R.Mieczysaw (2011), Impedance Spectroscopy Study of
ElectrodeElectrolyte System in Solid Oxide Fuel Cells. Materialy Ceramiczne/Ceramic
Materials, 63(1): pp.157-163.
ẢNH HƯỞNG CỦA SỰ THAY THẾ MN BẰNG Ni LÊN CẤU TRÚC
VÀ ĐỘ DẪN ION CỦA VẬT LIỆUSPINEL LiNixMn2-xO4 TỔNG HỢP
BẰNG PHƯƠNG PHÁP SOL – GEL
Tóm tắt: Vật liệu điện cực LiNixMn2-xO4 với (x = 0; 0,05; 0,1; 0,2) được tổng hợp ở bằng
phương pháp sol - gel từ liti axetat, mangagan axetat và niken axetat. Ảnh FE-SEM cho
thấy hình thái học của vật liệu thay đổi theo nhiệt độ tổng hợp và tỷ lệ thay thế của Ni cho
Mn. Phổ XRD đã xác nhận các mẫu thu được có cấu trúc spinel của LiNixMn2-xO4 mà
khơng có bất kỳ tạp chất nào. Hằng số mạng của hệ vật liệu tăng lên theo nhiệt độ ủ và
giảm đi khi tỷ lệ thay thế Ni tăng lên. Khi hàm lượng Ni tăng lên, kích thước hạt của các
mẫu LiNixMn2-xO4 giảm đi đồng thời biên hạt chuyển từ dạng tròn cạnh tại x = 0 sang
dạng các hình khối sắc cạnh ở x = 0,1 và 0,2 cho thấy hiệu quả rõ rệt của việc pha tạp
niken đến sự ổn định trật tự của tinh thể. Phép đo phổ tổng trở xoay chiều của vật liệu dạng
khối xác định được độ dẫn ion Li+ của vật liệu. Kết quả chỉ ra rằng, thay thế Ni cho Mn
cải thiện tốt độ dẫn của vật liệu, đồng thời cho thấy vật liệu có x = 0,1 và nhiệt độ tổng
hợp ở 700 °C cho độ dẫn cao nhất tp = 19,773×10-5 S.cm-1so với mẫu có x = 0 chỉ đạt
tp = 0,115×10-5 S.cm-1.
Keywords: Vật liệu điện cực, LiNixMn2-xO4, Pin Liti-ion, độ dẫn Ion, tỷ lệ thay thế của Ni