Identification and validation of quantitative trait loci for kernel traits in common wheat (triticum aestivum l )
Bạn đang xem bản rút gọn của tài liệu. Xem và tải ngay bản đầy đủ của tài liệu tại đây (2.61 MB, 15 trang )
Liu et al. BMC Plant Biology
(2020) 20:529
/>
RESEARCH ARTICLE
Open Access
Identification and validation of quantitative
trait loci for kernel traits in common wheat
(Triticum aestivum L.)
Hong Liu1†, Xiaotao Zhang1,4†, Yunfeng Xu1, Feifei Ma1,4, Jinpeng Zhang2, Yanwei Cao1,4, Lihui Li2* and
Diaoguo An1,3*
Abstract
Background: Kernel weight and morphology are important traits affecting cereal yields and quality. Dissecting the
genetic basis of thousand kernel weight (TKW) and its related traits is an effective method to improve wheat yield.
Results: In this study, we performed quantitative trait loci (QTL) analysis using recombinant inbred lines derived
from the cross ‘PuBing3228 × Gao8901’ (PG-RIL) to dissect the genetic basis of kernel traits. A total of 17 stable QTLs
related to kernel traits were identified, notably, two stable QTLs QTkw.cas-1A.2 and QTkw.cas-4A explained the
largest portion of the phenotypic variance for TKW and kernel length (KL), and the other two stable QTLs QTkw.cas6A.1 and QTkw.cas-7D.2 contributed more effects on kernel width (KW). Conditional QTL analysis revealed that the
stable QTLs for TKW were mainly affected by KW. The QTLs QTkw.cas-7D.2 and QKw.cas-7D.1 associated with TKW
and KW were delimited to the physical interval of approximately 3.82 Mb harboring 47 candidate genes. Among
them, the candidate gene TaFT-D1 had a 1 bp insertions/deletion (InDel) within the third exon, which might be the
reason for diversity in TKW and KW between the two parents. A Kompetitive Allele-Specific PCR (KASP) marker of
TaFT-D1 allele was developed and verified by PG-RIL and a natural population consisted of 141 cultivar/lines. It was
found that the favorable TaFT-D1 (G)-allele has been positively selected during Chinese wheat breeding. Thus, these
results can be used for further positional cloning and marker-assisted selection in wheat breeding programs.
Conclusions: Seventeen stable QTLs related to kernel traits were identified. The stable QTLs for thousand kernel
weight were mainly affected by kernel width. TaFT-D1 could be the candidate gene for QTLs QTkw.cas-7D.2 and
QKw.cas-7D.1.
Keywords: Kernel traits, Quantitative trait locus, TaFT-D1, KASP marker, Triticum aestivum
* Correspondence: ;
†
Hong Liu and Xiaotao Zhang contributed equally to this work.
2
The National Key Facility for Crop Gene Resources and Genetic
Improvement, Institute of Crop Science, Chinese Academy of Agricultural
Sciences, Beijing 100081, China
1
Center for Agricultural Resources Research, Institute of Genetics and
Developmental Biology, Chinese Academy of Sciences, Shijiazhuang 050021,
China
Full list of author information is available at the end of the article
© The Author(s). 2020 Open Access This article is licensed under a Creative Commons Attribution 4.0 International License,
which permits use, sharing, adaptation, distribution and reproduction in any medium or format, as long as you give
appropriate credit to the original author(s) and the source, provide a link to the Creative Commons licence, and indicate if
changes were made. The images or other third party material in this article are included in the article's Creative Commons
licence, unless indicated otherwise in a credit line to the material. If material is not included in the article's Creative Commons
licence and your intended use is not permitted by statutory regulation or exceeds the permitted use, you will need to obtain
permission directly from the copyright holder. To view a copy of this licence, visit />The Creative Commons Public Domain Dedication waiver ( applies to the
data made available in this article, unless otherwise stated in a credit line to the data.
Liu et al. BMC Plant Biology
(2020) 20:529
Background
Common wheat (Triticum aestivum L.) is one of the most
important cereal crops for feeds 40% of population in the
world ( Wheat yield is determined by
thousand kernel weight (TKW), kernel number per spike,
and effective tiller number [1]. Among them, TKW is the
most stable and highest heritable trait, and it is also an important selection target for the genetic improvement of
wheat yield [2]. Kernel weight is a complex yield component, which is mainly affected by kernel length (KL), kernel width (KW), kernel length / kernel width (KL/W) and
kernel thickness [3]. Therefore, exploring the genetic variation of TKW and its related traits is an effective approach
to increase wheat yield [4].
A large number of genes related to kernel weight and
morphological traits have been identified in crop. For instance, in rice, GS3, qGL3, GL4 and GLW7 were associated with kernel weight, GW2, GW5, GS5 and GW8 were
associated with kernel width [5–12]. Recently, several
genes associated with kernel weight have been identified
in wheat through comparative genomics approaches,
thereby providing an in-depth understanding of the molecular basis of TKW. For example, TaGW2 and TaDA1,
which encode an E3 RING ligase [13–15] and a ubiquitin
receptor [16], respectively. Both of them are conserved
component of the ubiquitin-proteasome pathway and
negatively regulate wheat kernel size. In addition, TaGS53A [17] and TaFlo2-A1 [18], which encode a serine carboxypeptidase and a protein containing tetratricopeptide
repeat motif, respectively, both can regulate kernel size
and weight. Genes involved in starch and sucrose metabolism pathways also affect wheat kernel size, such as the
cell wall invertase TaCwi-A1 [19], the sucrose synthases
TaSus1 and TaSus2 [20], ADP-glucose pyrophosphorylase
TaAGP-S1-7A and TaAGP-L-1B [21].
Previous researches have shown that conditional QTL
mapping has been used to study genetic basis of complex
traits in crops [22, 23]. In wheat, conditional QTL analysis
were carried out to evaluate the static genetic control of
traits at different growth stages for kernel size and weight
[23, 24] and yield [25]; to reveal the dynamic genetic factors of plant height [26, 27]; and to reveal the genetic contribution of different nitrogen and phosphorus supplement
environments factors to QTL expression by dissecting
QTLs based on trait values conditioned [28].
Recently, high-density single nucleotide polymorphism
(SNP) arrays technology provides a superior approach to
identify QTLs for wheat kernel-related traits [29–31]. To
date, numerous QTLs for kernel traits have been identified
on almost 21 wheat chromosomes [32–35]. Remarkably,
major stable QTLs distributed on chromosomes 1A, 1B,
2D, 3D, 4A, 4B, 5A, 7D can be identified in recombinant
inbred line (RIL) populations with different genetic backgrounds [36–40]. Moreover, several yield-related QTLs
Page 2 of 15
have been fine mapped and cloned, for example, the major
QTL affecting kernel number and kernel weight on
chromosome 2AL (GNI-A1) in tetraploid wheat [41, 42].
However, most QTLs associated with kernel traits were
mapped by a low-density genetic linkage map with large
confidence interval. Only a few QTLs flanking markers
were converted into Kompetitive Allele Specific PCR
(KASP) markers that can be used in molecular breeding.
Using a RIL population derived from ‘PuBing 3228
(P3228) × Gao8901 (G8901)’, the objectives of this study
were to (i) identify stable and major QTLs for TKW, KL,
KW and KL/W under different field conditions; (ii) reveal
the contribution of the other kernel traits to TKW using
conditional QTL analysis; (iii) predict candidate gene(s)
for targeted QTLs interval based on reference genome annotation information; (iv) develop KASP markers of the
candidate gene(s) and verified by PG-RIL and a natural
population consisted of 141 cultivar/lines for markerassisted selection in high-TKW wheat breeding.
Results
Phenotypic performance and correlation analysis
The 176 RIL population and their two parents P3228,
G8901 were planted in four environments to identify
stable and major QTLs for kernel-related traits. The
means and ranges of four kernel-related traits (TKW, KL,
KW and KL/W) are listed in Table 1. Compared with
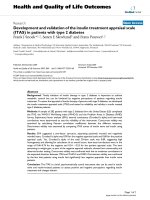
P3228, G8901 had wider KW, but shorter KL (Fig. 1 and
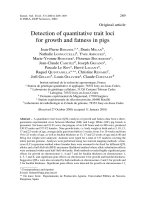
Table 1). For the RIL population, the frequency of kernel
traits in all environments and best linear unbiased predictors (BLUP) showed a continuous distribution with ranges
from 27.33 to 44.97 g in TKW, 5.64 to 7.09 mm in KL,
2.84 to 3.39 mm in KW and 1.78 to 2.43 in KL/W (Table
1 and Fig. 2). The Shapiro-Wilk test and Pearson’s correlation coefficients of the four traits were calculated based
on the BLUP data of four individual environments, indicating that TKW, KL, KW and KL/W showed normal distributions in multiple environments (Fig. 2 and Table 2).
Moreover, TKW was positively correlated with KL and
KW, and negatively correlated with KL/W (Table 2). The
variance for genotype, environment and genotype × environment (GE) interaction effects were highly significant in
TKW, KL, KW and KL/W (Additional file 1: Table S1).
All the broad-sense heritability (H) of four traits were
higher than 0.60 (Table 2), indicating that these traits were
mainly determined by genetic factors.
QTL mapping
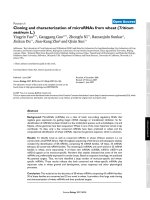
A total of 47 putative QTLs were detected for TKW, KL,
KW and KW/L (Figs. 3a-3d and Additional file 1: Table
S2). Among them, 25, eight and 13 QTLs were located on
the A, B and D genome, respectively. The single QTL explained 1.79–22.41% of the phenotypic variance with
threshold log-of-odds (LOD) value ranging from 2.54 to
Liu et al. BMC Plant Biology
(2020) 20:529
Page 3 of 15
Table 1 Phenotypes of the parents and PG-RIL population in this study
Parents
PG-RILs
Trait
Env
P3228
G8901
Min
Max
Mean
SD
CV(%)
H
TKW (g)
E1
31.68
36.93
20.79
46.77
32.54
4.37
13.42
0.668
E2
38.23
44.22
24.18
45.86
35.05
3.63
10.35
E3
41.13
46.81
28.22
49.87
37.72
3.79
10.05
E4
33.64
40.95
23.43
46.32
33.82
4.12
12.18
BLUP
36.17
42.23
27.34
44.97
34.79
3.07
8.82
E1
6.70
6.36
5.53
7.22
6.33
0.31
4.85
E2
6.67
6.29
5.50
7.04
6.25
0.29
4.61
E3
6.86
6.42
5.67
7.18
6.45
0.28
4.36
E4
6.78
6.46
5.62
7.21
6.45
0.29
4.45
KL (mm)
KW (mm)
KL/W
BLUP
6.75
6.38
5.64
7.09
6.37
0.26
4.15
E1
2.91
3.23
2.52
3.32
2.95
0.16
5.32
E2
3.02
3.29
2.64
3.34
3.03
0.13
4.32
E3
3.33
3.59
2.92
3.77
3.30
0.14
4.21
E4
3.08
3.42
2.73
3.52
3.10
0.15
4.77
BLUP
3.09
3.38
2.84
3.39
3.10
0.11
3.39
E1
2.30
1.97
1.83
2.61
2.16
0.14
6.48
E2
2.21
1.91
1.76
2.46
2.07
0.12
5.80
E3
2.06
1.79
1.68
2.27
1.97
0.12
6.09
E4
2.20
1.89
1.80
2.52
2.10
0.12
5.71
BLUP
2.19
1.89
1.78
2.43
2.08
0.11
5.25
0.859
0.615
0.796
Notes: TKW, thousand kernel weight; KL, kernel length; KW, kernel width; KL/W, kernel length/kernel width ratio; Env, environment; Min, minimum; Max,
Maximum; BLUP, best linear unbiased predictors mean
11 (Additional file 1: Table S2). Seventeen stable QTLs
could be detected in more than two individual environments (Fig. 3a-e and Table 3).
A total of 19 QTLs for TKW were identified, of which 13
carried the favorable alleles from G8901 can increase the
TKW, while the remaining six were from P3228 (Fig. 3a-d
and Additional file 1: Table S2). In addition, five stable
QTLs can be detected in at least two environments, including QTkw.cas-1A.2, QTkw.cas-4A, QTkw.cas-5D, QTkw.cs6A.1 and QTkw.cas-7D.2 (Table 3). Remarkably, the major
stable QTL QTkw.cas-4A, located on chromosome arm
4AL, can be repeatedly detected in all the environments
and BLUP data, and phenotypic variance explained (PVE)
ranged from 8.31 to 11.84% (Fig. 3b-c and Table 3).
QTkw.cas-6A.1 can be detected in the three environments
as well as BLUP data, and the PVE ranged from 6.52 to
12.73% (Fig. 3c and Table 3). The favorable allele of
QTkw.cas-4A was derived from the parent G8901, while
QTkw.cas-6A.1 was derived from the parent P3228.
QTkw.cas-1A.2, QTkw.cas-5D and QTkw.cas-7D.2 were
three stable QTLs, with PVE at 4.68–5.93%, 3.28–4.28%
and 5.50–6.52%, respectively (Table 3).
Ten QTLs for KL were detected, of which five QTLs
(QKl.cas-1A.2, QKl.cas-1B, QKl.cas-2A, QKl.cas-4A and
QKl.cas-7A.1) were significant in at least two environments
(Figs. 3a-d, Table 3 and Additional file 1: Table S2). The
major QTL QKl.cas-2A was significant in two environments,
explaining 8.40–10.28% of the phenotypic variance (Fig. 3b
and Table 3). Notably, the most stable QTL QKl.cas-4A was
co-located with QTL QTkw.cas-4A for TKW (Fig. 3b and
Table 3). Among the 10 QTLs for KL, six had additive effects from P3228 (Additional file 1: Table S2).
Eight QTLs for KW were identified on chromosomes 1A
(two), 1B, 4B, 6A, 7A (two) and 7D, respectively (Figs. 3a-e,
Table 3 and Additional file 1: Table S2). Among the three
environments, the most stable QTL QKw.cas-6A in three
environments was located on chromosome arm 6AS with
PVE ranging from 5.43 to 9.85% (Fig. 3c and Table 3). This
locus was co-located with the major QTL for TKW on 6AS
(QTkw.cas-6A.1). The favorable alleles of the five QTLs
(QKw.cas-1A.2, QKw.cas-1B, QKw.cas-7A, QKw.cas-7D.1
and QKw.cas-7D.2) were derived from the parent G8901
(Figs. 3a-e, Table 3 and Additional file 1: Table S2).
A total of 10 QTLs for KL/W were identified on chromosomes 1A, 1B, 2A, 5A (two), 5D, 7A (two) and 7D (two),
with PVE of individual QTL ranging from 1.79 to 22.41%
(Figs. 3a-d, Table 3 and Additional file 1: Table S2). Five
QTLs (QKl/w.cas-1A, QKl/w.cas-2A, QKl/w.cas-5A.2, QKl/
w.cas-7A.1 and QKl/w.cas-7A.2) were found in at least two
environments (Table 3). Among them, the major stable
Liu et al. BMC Plant Biology
(2020) 20:529
Page 4 of 15
Fig. 1 Phenotypic characterization of two parents and some representative RIL
QTL QKl/w.cas-7A.1 can be detected in all the environments
and BLUP data, explaining 3.85–13.84% of the phenotypic
variance (Fig. 3d and Table 3). This QTL was co-located with
QTLs for KW on chromosome 7A (QKw.cas-7A).
Epistasis and QTL × environment interaction
A total of 15 pairs of epistasis QTLs for TKW, KL, KW and
KW/L were detected, involving 30 QTLs on 15 chromosomes (Additional file 1: Table S3). Three pairs of epistasis
interaction QTLs for TKW with PVE of 11.20, 7.10, and
8.93% were detected on chromosomes 1B/2D, 4D/6D, and
5A/6D, respectively, indicating that the interactions between those QTLs had no significant main effect on TKW
(Additional file 1: Table S3). Three pairs of epistasis interaction sites of KL were detected, among which the interactions on chromosomes 4A/3B was between the major and
non-major QTLs, while the interactions on 2D/3A and 6B/
6D were between non-majors, and all of the three QTLs
could increase KL (Additional file 1: Table S3). Four pairs
of epistasis interactional QTLs for KW were detected, and
they were all interactional between non-major QTLs. The
two combinations of 3B/6A and 5B/6D could increase the
KW, while the two combinations of 4B/6B and 5D/6B
could decrease the KW. Five pairs of epistasis interactional
QTLs for KL/W were detected, all of which were interactional between non-major QTLs. The two combinations
of 6D/6D and 1B/6D could reduce KL/W, while the other
three combinations could increase KL/W.
QTL × environment (QE) interactions were detected at 43
loci for TKW, KL, KW and KW/L (Additional file 1: Table
S4). They overlapped with 47 putative QTLs of four traits,
indicating that the TKW, KL, KW and KL/W were affected
by environment. Among them, the largest environmental
effect was detected in the interval AX-109416575–AX108738265 (PVE (AbyE) = 21.93%), indicating that the
major QTLs QTkw.cas-4A and QKl.cas-4A for TKW and
KL, respectively, were significantly affected by the environment (Additional file 1: Table S4). Ten pairs of epistasis interactions were detected for additive–additive–environment
(AAE), including three, one, three and three pairs of epistasis QTLs for TKW, KL, KW and KL/W, respectively (Additional file 1: Table S3).
QTL analysis for TKW conditioned on kernel-related traits
To dissect genetic effects of the KL, KW and KL/W on
the expression of QTLs for TKW, conditional QTL analysis were conducted. After conditioned on KL, KW or
KL/W, a total of 23 conditional QTLs comprising 47
QTL × environments were detected for TKW (Additional file 1: Table S5). Among them, 19 QTLs were
identified as unconditional analysis, while the other 10
QTLs were newly detected, with four QTLs identified in
at least two environments (Additional file 1: Table S5).
The QTLs QTkw.cas-2A.1, QTkw.cas-4A and QTkw.cas4D were detected when TKW was conditioned on KW
and KL/W instead of KL (Table 4 and Additional file 1:
Table S5). This result indicated that these QTLs may be
associated with KL, but independent of KW and KL/W.
Four QTLs (QTkw.cas-5A, QTkw.cas-6A.1, QTkw.cas-7A
and QTkw.cas-7D.2) were identified to be associated with
KW, but independent of KL and KL/W (Table 4 and Additional file 1: Table S5). The QTL QTkw.cas-1A.2, was detected when TKW was conditioned on KL, but absent
when conditioned on KW or KL/W (Table 4), suggesting
that it may be independent of KL, but was associated with
either one or both of KW and KL/W. The stable QTL
QTkw.cas-5D was not detected when TKW was conditioned on KL, KW or KL/W (Table 4).
Important QTL clusters
A total of seven QTL clusters were identified, all of them
were related to more than one trait (Fig. 3a-d and Table 5).
Three intervals harboring various QTLs can be identified in
at least three environments (Fig. 3a-d, Tables 3 and 5). The
interval AX-110540586–AX-108840708 on chromosome 4A
affected TKW and KL across all the four environments and
BLUP data, and the additional effects were derived from
G8901 (Fig. 3a-d, Tables 3 and 5). The interval AX109892808–AX-110438513 on chromosome 6A affected
TKW and KW across the three environments and BLUP
data, with P3228 conferring the favorite allele (Fig. 3c and
Table 5). The interval AX-111061288–AX-111184541 on
chromosome 7D showed significant effects on TKW and
KW across three environments and BLUP data and on KL/
W in one environment and BLUP data (Table 5 and Fig.
Liu et al. BMC Plant Biology
(2020) 20:529
Page 5 of 15
Fig. 2 Frequency distribution of four kernel traits in RIL population in BLUP data. a Thousand kernel weight. b Kernel length. c Kernel width. d
Kernel length/width
3d). In this interval, the G8901-derived allele increased
TKW and KW and decreased KL/W (Table 3).
Predicting of candidate gene TaFT-D1 for QTLs QTkw.cas7D.2 and QKw.cas -7D.1
The two stable QTLs, QTkw.cas-7D.2 and QKw.cas7D.1, was delimited by the markers AX-110826147 and
AX-111359934 (Fig. 3d), and the peak interval were colocated between the markers AX-111061288 and AX111184541 (Table 3 and Fig. 3d-e). Collinearity analysis
indicated that the genetic map of PG-RIL and the physical map of Chinese Spring reference genome V1.0 show
perfect collinearity in the chromosomes 7DS region
(Additional file 2: Fig. S1). To investigate the physical
intervals of QTLs QTkw.cas-7D.2 and QKw.cas-7D.1, we
aligned the markers AX-110826147 and AX-111359934
to Chinese Spring reference genome V1.0 [49]. The
results showed that the physical interval of QTLs
QTkw.cas-7D.2 and QKw.cas-7D.1 is mapped to the
65.50–69.32 Mb position on chromosome arm 7DS
which contained 47 high confidence genes (Table 3 and
Additional file 2: Table. S2).
Subsequently, we annotated 47 genes in the 3.82 Mb region (Additional file 2: Table. S3). Among them, TaFT-D1
(TraesCS7D02G111600), a homolog of Arabidopsis
FLOWERING LOCUS T, was considered as the candidate
gene for QTkw.cas-7D.2 and QKw.cas-7D.1 (Additional
file 1: Tables S6). Then, we designed genome-specific
Table 2 Correlation coefficients among the kernel traits of PG-RIL population in four environments
Trait BLUP
TKW
E1
KL
KW
TKW
KL
0.458**
KW
0.823**
KL/
W
−0.235** 0.708** − 0.641** −
0.515**
E2
KL
KW
0.387**
0.901**
0.085
Note: * significant at P < 0.05 level;
**
TKW
E3
KL
0.476**
0.133
0.792**
0.536** − 0.763** −
0.204**
significant at P < 0.01 level
KW
TKW
E4
KL
0.432**
0.070
0.788**
0.781** − 0.566** −
0.243**
KW
TKW
KL
KW
0.469**
0.0288
0.874**
0.707** − 0.684** −
0.356**
0.194**
0.600** − 0.665**
Liu et al. BMC Plant Biology
(2020) 20:529
Fig. 3 (See legend on next page.)
Page 6 of 15
Liu et al. BMC Plant Biology
(2020) 20:529
Page 7 of 15
(See figure on previous page.)
Fig. 3 Genetic and physical locations of QTL regions associated with TKW, KL, KW and KL/W. a QTLs located on the chromosome 1A and 1B. b QTLs
located on the chromosome 2A, 2B, 3D, 4A, 4B and 4D. c QTLs located on the chromosome 5A, 5B, 5D, 6A and 6B. (d) QTLs located on the chromosome
7A, 7B and 7D. (e) LOD curves for the QTLs QTkw.cas-7D.2 and QKw.cas-7D.1 on chromosome 7D. Uniform centimorgan (cM) scales are shown on the left.
Physical maps are shown on the right of each genetic map. QTLs are indicated on the right side of each chromosome. For QTLs detected in different
environments, a slash is inserted to distinguish the environments. The codes E1, E2, E3, E4 and B represent QTLs detected in 2013LC, 2014LC, 2015LC,
2016LC environments and BLUP data, respectively. Red, pink, green, black colors represent QTLs conferring TKW, KL, KW and KL/W, respectively
primers for sequencing to analyse the genome sequence of
TaFT-D1 from G8901 and P3228 (Additional file 1: Tables S9), and found that there was a 1 bp deletion at position + 840 in the third exon of TaFT-D1 in P3228.
Protein sequence alignment revealed that this deletion
caused frameshift mutation with loss function of the
TaFT-D1 protein in P3228 (Additional file 2: Fig. S2). We
further analyzed the expression profiles of 47 candidate
genes in different tissues using the Chinese Spring cv-1
development (pair) database [50]. As shown in Additional
file 2: Fig. S3, the expression of TaFT-D1 was highest in
leaves and young spikes, slightly lower in stems and substantially lower in root and developing grain.
distribution of the TaFT-D1 alleles in 150 Chinese wheat
landraces and 172 modern cultivars. The Chinese wheat
production area is divided into 10 agro-ecological wheat
production regions according to environment, type of cultivars and growing season [51, 52]. Compared with landraces, the proportion of TaFT-D1(G)-allele in modern
cultivars was higher in the seven agro-ecological wheat
production regions (except for regions IV, VIII and IX),
suggesting that TaFT-D1(G)-allele have undergone positive selection during wheat breeding process (Fig. 5a and
b). This confirmed that the favorable TaFT-D1(G)-allele
can be used in different wheat production regions.
Development of KASP markers and analysis for alleles of
TaFT-D1
Discussion
Two SNPs markers (AX-111061288 and AX-111184541)
closely linked to the two stable QTLs (QTkw.cas-7D.2
and QKw.cas-7D.1) and 1 bp InDel of TaFT-D1 were further converted to KASP markers (Fig. 4a, Additional file 2:
Fig. S4 and Additional file 1: Tables S9). After screening
PG-RIL and a natural population consisted of 141 cultivar/
lines using these KASP markers, we found that the KASP
marker of TaFT-D1 was co-segregated with SNPs marker
AX-111184541. This result further proved that TaFT-D1
was an important candidate gene for the QTkw.cas-7D.2
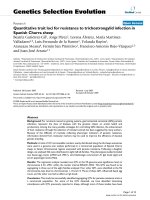
and QKw.cas-7D.1. Furthermore, two-tailed t test was performed between the InDel of TaFT-D1 and four kernelrelated traits collected from multiple environments. The results showed that the InDel of TaFT-D1 was significantly
correlated with TKW, KW and KL/W but not with KL for
PG-RIL (Fig. 4b-e). For the natural population consisted of
141 cultivar/lines, the InDel of TaFT-D1 was associated
with TKW and KW in the three environments, except that
no significant differences were observed in the KL and KL/
W of G8901-allele (TaFT-D1(G)-allele) and P3228-allele
(TaFT-D1(−)-allele) plants (Figs. 4f-i). The mean TKW of
TaFT-D1(G)-allele was significantly higher than those of
the TaFT-D1(−)-allele (mean 4.91 g higher in 2013–2014,
5.21 g higher in 2014–2015, 2.87 g higher in 2015–2016
and 1.58 g higher in 2016–2017).
TaFT-D1(G)-allele underwent positive selection during
Chinese wheat breeding
To determine whether the two TaFT-D1 alleles were subjected to selecting, we investigated the geographic
Unconditional QTLs and conditional QTLs effects
Previous researches have shown that the combination of
QTL mapping and conditional genetic analysis enable the
identification of the influence of one trait on another [22,
28]. In the current study, we dissected QTLs based on
TKW values conditioned on KL, KW and KL/W to study
the genetic basis of TKW on QTL expression. When conditioned on KW, four conditional stable QTLs (QTkw.cas1A.2, QTkw.cas-5D, QTkw.cas-6A.1, QTkw.cas-7D.2) account for TKW, while two (QTkw.cas-4A and QTkw.cas5D) on KL (Table 4). Notably, QTkw.cas-5D was not detected when TKW was conditioned on KL or KW (Table
4). The total PVE of the four QTLs conditioned on KW
was significantly higher than the two on KL, indicating
that KW contributes more than KL to TKW in the PGRIL population (Table 4). The unconditional QTL analysis
showed that the major QTL QTkw.cas-4A on chromosome 4A was co-located with QTL QKl.cas-4A for KL,
with G8901-derived allele increasing both TKW and KL
(Table 3 and Fig. 3b). Using conditional QTL analysis, we
found that the QTkw.cas-4A was entirely contributed by
KL, partially by KW and entirely independent by KL/W
(Table 4). Combining unconditional QTL with conditional
QTLs analysis, the effect of increasing TKW of QTkw.cas4A was identified to be mainly caused by the KL. Using
the same analysis methods, we concluded that the effects
of increasing TKW of QTkw.cas-6A and QTkw.cas-7D
were mainly contributed by the KW. The results should
be valuable for dissecting the genetic basis of TKW and
the genetic contribution of kernel related traits to TKW at
individual QTL level in wheat.
Liu et al. BMC Plant Biology
(2020) 20:529
Page 8 of 15
Table 3 Stable QTLs for thousand kernel weight, Kernel length, Kernel width, Kernel length/width traits in the PG-RIL population
Trait
QTL
Left Markers
Interval (cM)
E
PVE%
Add
Reference
TKW
QTkw.cas-1A.2
AX-109528407
–AX-108731422
54.55–58.10
E2
5.93
−0.92
[8, 36, 43]
E3
4.68
−0.84
E4
6.92
−1.13
BLUP
5.35
−0.74
QTkw.cas-4A
AX-109207441
–AX-110418893
199.33–205.59
QTkw.cas-6A.1
AX-108835689
–AX-110438513
62.87–66.05
AX-111061288
–AX-111184541
92.76–93.06
E1
10.59
−1.428
E2
8.31
−1.051
E3
11.84
−1.311
E4
10.69
−1.354
BLUP
13.17
−1.162
E2
4.28
0.777
E3
3.28
0.699
E1
6.52
1.137
E3
11.38
1.308
E4
12.73
1.526
BLUP
11.77
1.102
E1
6.52
−1.150
E2
5.50
−0.895
E4
6.09
−1.069
BLUP
6.22
−0.811
QKl.cas-1A.2
AX-86178254
–AX-109474737
113.61–114.19
E1
4.29
0.061
E2
5.63
0.066
QKl.cas-1B
AX-108897360
–AX-110996354
66.00–66.16
E1
6.63
0.075
E3
8.16
0.073
E4
3.74
0.053
BLUP
7.38
0.071
E1
14.35
0.110
E4
16.65
0.111
E1
7.48
−0.080
E2
8.46
−0.081
E3
8.09
−0.073
E4
9.66
−0.085
BLUP
9.00
−0.078
QKl.cas-2A
AX-108791295
–AX-109421335
110.93–111.45
QKl.cas-4A
AX-110540586
–AX-108840708
130.90–136.45
QKl.cas-7A.1
KW
132.39–135.10
QTkw.cas-5D
QTkw.cas-7D.2
KL
AX-109416575
–AX-108738265
QKw.cas-1A.2
QKw.cas-6A
AX-109353536
–AX-109520645
120.91–122.10
AX-109402270
–AX-108748448
52.96–57.14
AX-109892808
–AX-110438513
58.76–66.05
E1
5.78
−0.070
E3
7.24
−0.069
E4
5.70
−0.065
BLUP
7.24
−0.070
E3
5.55
−0.031
E4
10.14
−0.047
E1
5.43
0.037
E2
9.85
0.040
E3
7.31
0.036
BLUP
7.98
0.030
[40, 44]
[45, 46]
[39, 43, 47]
[36]
[37]
[45, 48]
Liu et al. BMC Plant Biology
(2020) 20:529
Page 9 of 15
Table 3 Stable QTLs for thousand kernel weight, Kernel length, Kernel width, Kernel length/width traits in the PG-RIL population
(Continued)
Trait
QTL
Left Markers
Interval (cM)
KL/W
QKl/w.cas-1A
AX-111196131
–AX-108970235
43.42–45.20
AX-108791295
–AX-109368860
110.93–112.28
AX-94700980
–AX-110671854
183.00–189.10
QKl/w.cas-2A
QKl/w.cas-5A.2
QKl/w.cas-5D
QKl/w.cas-7A.1
AX-110830424
–AX-89417887
AX-111636086
–AX-109338226
136.94–141.21
1.720–9.50
E
PVE%
Add
E2
22.41
0.093
E4
5.22
0.027
E3
11.60
0.040
E4
11.03
0.039
BLUP
10.90
0.037
E3
8.32
−0.034
E4
7.49
−0.032
BLUP
6.27
−0.028
E1
6.70
0.039
E2
3.77
0.038
E3
5.60
0.028
E4
5.58
0.028
BLUP
8.26
0.032
E1
13.84
0.055
E2
3.85
0.038
E3
12.25
0.041
E4
8.18
0.034
BLUP
13.23
0.041
Reference
Notes: E: environments, BLUP: best linear unbiased predictors, PVE: phenotypic variance explained, Add: additive effect
QTL comparison
To date, a large number of QTLs for TKW and kernel
morphological traits have been mapped in common wheat
[45, 48]. To investigate whether there were overlapping
QTLs in different genetic backgrounds, we compared the
QTLs interval in this study with those in the previous
studies. Some stable QTLs have been reported in the previous studies. For example, the interval AX-108835689–
AX-110438513 on chromosome 6A contained QTkw.cas6A.1 and QKw.cas-6A, corresponding to the reported
QTLs for kernel weight in different RIL population [44–
46]. The gene TaGW2-A1 was also located in this interval,
and it affects TKW by regulating the KW of bread wheat
[13, 52]. It was also reported that the major stable QTLs
QTkw.cas-4A and QKl.cas-4A were in the interval AX108738265–AX-109416575 (Table 5), overlapping with
the locus for TKW in the previous study [40, 47]. The
QTL QTkw.cas-7D in the interval AX-111061288–AX111184541 on chromosome 7D has also reported previously [39, 43, 53, 54]. Therefore, these important QTLs
that were not affected by genetic background are important selection targets in wheat breeding.
Advantages of high-density genetic maps
Previous genetic maps were mainly constructed by gelbased markers. Moreover, the confidence intervals associated with detected QTLs were relatively large and the numbers of markers was limited, which restricted further fine
mapping of QTLs and their applications in breeding [27,
38]. Compared with gel-based markers, high-density SNP
arrays have the advantage of abundant markers and can
further reduce the confidence interval for QTL localization.
In this study, we used the wheat 660 K high-density SNP
chips to screen the PG-RIL population, and found that the
confidence interval for most QTLs was less than 3 cM
(Table 3 and Additional file 1: Table S2). Furthermore, the
SNP markers in the confidence interval have clear base sequence and position information, which is effective for fine
mapping using the reference genome [27]. For instance, the
stable QTL QTkw.cas-7D.2 and QKw.cas-7D.1 were colocated in interval between 92.756–93.059 cM, and the
physical interval of the Chinese Spring reference genome
V1.0 is 65.50–69.32 Mb (Table 3 and Fig. 3).
Functional prediction of candidate genes for QTkw.cas-7D.2
and QKw.cas-7D.1
In crops, genes that regulated flowering have diverse functions, some affecting the yield-related traits [54]. Kernel
weight can be manipulated by altering the duration of kernel filling, which is greatly influenced by flowering-related
genes. For instance, overexpression of TaGW8, the positive
regulator of cell proliferation and grain filling, results in
early flowering and enhanced kernel width and yield in
wheat [55, 56]. Overexpression of TaZIM-A1 represses the
expression of TaFT1, leading to a delay in heading date and
decreased TKW in common wheat [57]. In the present
Liu et al. BMC Plant Biology
(2020) 20:529
Page 10 of 15
Table 4 Unconditional and conditional stable QTLs for TKW in wheat
QTL
Intervals marker
QTkw.cas-1A.2
QTkw.cas-4A
AX-109528407–AX-108731422
AX-109416575–AX-108738265
QTkw.cas-5D
AX-109207441–AX-110418893
QTkw.cas-6A.1
AX-108835689–AX-110438513
QTkw.cas-7D.2
AX-111061288–AX-111184541
Unconditional QTL
Conditional QTL
TKW
TKW|KL
E
PVE%
Add
E2
5.927
−0.915
E3
4.684
−0.836
E4
6.924
−1.127
E1
10.586
−1.428
E2
8.310
−1.051
E3
11.837
E4
E2
TKW|KW
E
PVE%
Add
E4
5.695
−0.893 b
TKW/(KL/W)
E
PVE%
Add
E
PVE%
Add
E1
9.033
−0.654 b
E1
8.936
−1.372 a
E2
7.278
−0.999 a
−1.311
E3
6.509
−0.562b
E3
11.238
−1.191 a
10.687
−1.354
E4
9.763
−0.687 b
E4
12.060
−1.301 a
4.280
0.777
E3
3.280
0.699
E1
6.515
1.137
E1
5.812
0.989 b
E2
6.208
0.832 b
E3
11.380
1.308
E3
11.609
1.257 a
E4
12.727
1.526
E4
11.069
1.244 b
E4
9.719
1.171 b
E1
6.520
−1.150
E1
11.086
−1.381 c
E2
5.502
−0.895
E2
7.700
−1.014 c
E3
4.806
−0.819 d
E4
6.091
−1.069
E4
6.946
−0.997 a
E4
4.649
−0.820 b
Note: adenotes the additive effect of a conditional QTL, in absolute values, that reduces or increase less than 10% compared to the corresponding unconditional QTL
b
denotes the additive effect of a conditional QTL, in absolute values, that reduces more than 10% compared to the corresponding unconditional QTL
c
denotes the additive effect of a conditional QTL, in absolute values, that increase more than 10% compared to the corresponding unconditional QTL. ddenotes
the QTL couldn’t be detected in unconditional analysis, but can be detected in conditional analysis
(+) indicates that the most favorable allele is derived from the parent P3228, (−) indicates that the most favorable allele is derived from the parent G8901. E and
numerals in parentheses indicate the environment in which the QTL was detected and the percentage of phenotypic variance explained (PVE) by the additive
effects of the mapped QTLs, respectively
study, the stable QTLs QTkw.cas-7D.2 and QKw.cas-7D.1
were delimited to the 3.82 Mb physical interval with 47
high-confidence genes (Additional file 1: Table S6). Among
them, compared with G8901, frameshift mutation of TaFTD1 in P3228 leads to loss of protein function (Additional
file 2: Fig. S2). TaFT1, a homolog gene of Arabidopsis
FLOWERING LOCUS T, is a major gene that regulates
wheat flowering [58, 59]. It has diverse functions on regulating different reproductive traits, such as flowering time,
spike development and seed development [60, 61]. The loss
function of TaFT-D1 in P3228-allele lines resulted in delayed flowering and decreased TKW, while the high expression of TaFT-D1 in the G8901-allele lines leads to
accelerated flowering time and increased TKW.
Table 5 Characterization of QTL clusters for kernel traits in this study
Clusters
Chromosomes
Intervals marker
Intervals (cM)
QTL included
No of
QTLs
Traits (additive effect,
number of environments)a
C1
1A
AX-111196131–AX-108731422
43.42–58.07
QTkw.cas-1A.2, QKw.cas-1A.2,
QKl/w.cas-1A
3
TKW(−3), KW(−2), KL/W(+ 2)
C2
2A
AX-108791295–AX-109368860
110.93–112.28
QKl.cas-2A, QKl/w.cas-2A
2
KL(+ 2), KL/W(+ 2)
C3
4A
AX-110540586–AX-108840708
130.91–136.45
QTkw.cas-4A, QKl.cas-4A
2
TKW(−4), KL(−4)
C4
4D
AX-109934629–AX-89651171
156.18–157.93
QTkw.cas-4D, QKl.cas-4D
2
TKW(+ 1), KL(+ 1)
C5
6A
AX-109892808–AX-110438513
58.76–66.05
QTkw.cas-6A.1, QKw.cas-6A
2
TKW(+ 3), KW(+ 3)
C6
7A
AX-111636086–AX-109338226
1.72–9.50
QKw.cas-7A, QKl/w.cas-7A.1
2
KW(−1), KL/W(+ 4)
C7
7D
AX-111666703–AX-111184541
90.84–93.06
QTkw.cas-7D.2, QKw.cas-7D.1,
QKl/w.cas-7D.2
3
TKW(−3), KW(−1), KL/W(+ 1)
Notes: aA trait name in bold type indicates that major QTLs were detected for the corresponding trait, and a trait name in underlined type indicates that stable
QTLs were detected for the corresponding traits. (+) indicates that the most favorable allele is derived from the parent P3228, (−) indicates that the most
favorable allele is derived from the parent G8901
Liu et al. BMC Plant Biology
(2020) 20:529
Page 11 of 15
Fig. 4 Allelic analysis with kernel traits of TaFT-D1 in PG-RIL and the natural population. a Allelic segregation of KASP marker for TaFT-D1 alleles.
Comparison analysis of TaFT-D1 alleles with the thousand kernel weight (TKW, b), kernel length (KL, c), kernel width (KW, d) and kernel length/
width (KL/W, e) of PG-RIL in four environments. Comparison analysis of TaFT-D1 alleles with the TKW (f), KL (g), KW (h) and KL/W (i) of the natural
population consisted of 141 cultivar/lines in four environments. **P < 0.01 and *P < 0.05 (two-tailed t test) indicates a significant difference to the
two haplotypes
Diagnostic marker and marker-assisted selection
Abundance of diagnostic markers in wheat enables
breeders to create better combinations and select favorable cultivars to meet local breeding goals [62]. To date,
numerous SNP loci related to kernel traits have been
identified in wheat by high-throughput SNP chips combined with bi-parental populations [1, 34, 39]. In the
present study, a KASP marker was developed to distinguish two alleles of TaFT-D1 and verified in PG-RIL and
a natural population consisted of 141 cultivar/lines (Fig.
Liu et al. BMC Plant Biology
(2020) 20:529
Page 12 of 15
Fig. 5 Geographic distribution of the TaFT-D1 alleles in the Chinese wheat ecological regions. Distribution of TaFT-D1 alleles in landraces (a) and
modern cultivars (b) among ten Chinese ecological regions. I, northern winter wheat region; II, Yellow and Huai River valley winter wheat region;
III, low and middle Yangtze River valley winter wheat region; IV, southwestern winter wheat region; V, southern winter wheat region; VI,
northeastern spring wheat region; VII, northern spring wheat region; VIII, northwestern spring wheat region; IX, Qinghai–Tibet spring–winter
wheat region; X, Xinjiang winter–spring wheat region
4). Furthermore, the alleles of TaFT-D1 were significantly associated with TKW and KW in both PG-RIL
and natural populations (Fig. 4). G8901-allele, the favorable allele that produces higher TKW, was gradually accumulated during the wheat breeding process (Fig. 5).
Therefore, the KASP marker can facilitate map-based
cloning of QTkw.cas-7D.2 and QKw.cas-7D.1 and
molecular-assisted selection breeding for high-yield in
wheat.
Conclusions
In this study, we performed QTL analysis using the PGRIL population in four environments for kernel-related
traits (TKW, KL, KW and KL/W), which were mainly
distributed on chromosomes 1A, 1B, 4A, 5D, 6A, 7A
and 7D (Fig. 3 and Additional file 2: Table S1). A total
of 17 stable QTLs were identified in more than two individual environments (Table 3). Notably, the stable QTLs
for TKW were mainly affected by KW (Table 4). Furthermore, the QTLs QTkw.cas-7D.2 and QKw.cas-7D.1
were delimited to the physical interval of approximately
3.82 Mb, and TaFT-D1 was considered as the candidate
gene. Based on a 1 bp InDel of TaFT-D1 between the
two parents, a KASP marker of TaFT-D1 allele was developed and verified by PG-RIL and a natural population. The favorable TaFT-D1 (G)-allele associated with
TKW and KW has been positively selected during Chinese wheat breeding. In addition, the current study provided new options for dissecting the genetic basis of
yield and molecular-assisted breeding.
Methods
Plant materials and field trials
A mapping population composed of 176 F6–9 RILs derived from ‘PuBing3228 × Gao 8901 ‘was developed by
single seed descent method. The wheat germplasm
P3228 was developed by Dr. Lihui Li (Chinese Academy
of Agricultural Sciences). G8901 is a commercial cultivar
released by Gaocheng institute of agricultural science,
Hebei, China. The P3228 has higher kernel number per
spike and the G8901 has higher thousand kernel weight
(Fig. 1). A natural population consisted of 141 cultivar/
lines (maintained in our laboratory, Additional file 1:
Table S7) was used for the KASP marker screening and
two-tailed t test. The 176 RILs, with two parents and the
natural population were grown at the Luancheng Agroecosystem Station, Chinese Academy of Sciences (37°53′
15″N, 114°40′47″E) during four growing seasons from
2013 to 2014 to 2016–2017. In each environment, the
RILs, two parents and the natural population were
planted in a randomized complete block design with
three replicates. A 1.5 m2 subplot with four 1.5 mlong rows, 0.25 m apart, and 30 seeds for each row
were used. The water, fertilizer and other management of all field trials were carried out in accordance
with local standard practices. In addition, 150 landraces of the Chinese wheat mini-core collection [63]
and 172 modern cultivars (maintained in our laboratory) were used to analyze the geographic distribution
of TaFT-D1 alleles (Additional file 1: Table S8). The
150 landraces and 88 modern cultivars of the Chinese
wheat mini-core collection were kindly provided by
Liu et al. BMC Plant Biology
(2020) 20:529
Dr. Xueyong Zhang (Chinese Academy of Agricultural
Sciences).
Phenotypic evaluation and statistical analysis
For the four environments, 10 representative plants were
sampled from each plot to investigate kernel-related
traits. At seed maturity, the TKW and kernel morphometric traits (KL, KW and KL/W) of at least 500 kernels
were measured three times using the rapid SC-G grain
appearance quality image analysis system (WSeen Detection, Hangzhou, China). Analysis of variance (ANOVA),
mean values of traits, standard deviations and variation
coefficients (CV) were performed with SPSS Statistics
v20.0 software (SPSS, Chicago, USA). Effects among genotypes, environments, and GE interaction were estimated by ANOVA. BLUP for all four traits across four
environments was calculated using R software (V.3.2.2;
The H was calculated using
the QGAStation 2.0 ( />v2.0/index c.htm) and the following formula H = VG/VP;
where VG and VP are the genetic variance and phenotypic variance, respectively.
QTL mapping
The ‘PuBing3228 × Gao 8901’ RIL population and the two
parents were genotyped by the Affymetrix wheat 660 K
SNP array [64]. A total of 101,136 loci showed polymorphisms between P3228 and G8901. The linkage map comprised 23 linkage groups that consisted of 4477 bins,
spanning 3529.5 cM in length, with an average interval distance of 0.782 cM between the adjacent markers. Linkage
analysis was performed using JoinMap v4 [65], and the genetic map was drawn by Mapchart 2.0 [66]. The QTLs were
scanned with QTL ICIMapping V4.1 [67] through inclusive
composite interval mapping of additive and dominant QTL
(ICIM-ADD) [67]. The LOD score to detect the presence
of a QTL was above at 2.50 [68]. Digenic epistasis and environment interaction of QTLs were analyzed using QTL
ICIMapping V4.1 through inclusive composite interval
mapping of epistatic QTL (ICIM-EPI) [69]. The LOD score
to detect the digenic epistasis QTL was above at 5.0 [68].
The QTL × environment interactions were scanned with
QTL ICIMapping V4.1 through inclusive composite
interval mapping of additive and dominant QTL
(ICIM-ADD) [70]. QTLs with overlapping confidence
intervals were regarded as the congruent QTLs. The
QTLs were named based on McIntosh et al. [71], ‘cas’
represents Chinese Academy of Science.
Conditional QTL analysis was performed to analyze the
genetic contributions of kernel-related traits to TKW, by
the procedure of inclusive composite interval mapping [23].
The conditional phenotypic values (y(TKW|KL)) of TKW in
wheat were obtained by the mixed-model approach. The
conditional phenotypic value can be partitioned as.
Page 13 of 15
y(TKW|KL)=μ(TKW|KL) + G(TKW|KL) + E(TKW|KL) + e(TKW|KL).
where (TKW|KL) denote TKW conditional on KL;
y(TKW|KL) is the conditional phenotypic value of TKW
on KL; μ(TKW|KL) is the conditional population mean,
G(TKW|KL) is the conditional general genotypic effect;
E(TKW|KL) is the conditional effect for the environment
and e(TKW|KL) is the conditional residual error.
The conditional phenotypic values (y(TKW|KL), y(TKW|KW)
and y(TKW|KL/W)) are the conditional phenotypic value of
TKW on KL, KW or KL/KW in the corresponding environment, which were estimated using QGAStation2.0
( MapChart 2.2 (http://
www.biometris.nl/uk/Software/MapChart/) was used to
draw the genetic map.
Comparison of QTLs related to kernel traits
We used flanking SNP markers sequence of QTLs to
BLAST against the reference genome of Chinese Spring to
acquire the physical position of the region [49]. High confidence candidate genes in the target interval were retrieved
based on coding sequences (IWGSC_RefSeq_Annotations_
v1.0), and were further analyzed on NCBI Non-redundant
protein sequences for function annotations. The expression
profile database of nine candidate genes was blasted based
on Chinese Spring cv-1 Development (pair) [50].
Conversion of SNPs to KASP markers
The SNPs tightly linked to two stable QTLs QTkw.cas7D.2 and QKw.cas-7D.1 and the 1 bp InDel of TaFT-D1
were converted to KASP markers (Additional file 1: Table
S9). KASP reactions were carried out on a BIORAD CFX
real-time PCR system using the KASP V4.0 2× Mastermix
(LGC Genomics, Teddington, UK) as previously described
[1]. The fluorescence was monitored using Bio-Rad CFX
Manage 3.1 software (LGC Genomics, Teddington, UK).
Two-tailed t test was performed with SPSS Statistics v20.0
software (SPSS, Chicago, USA).
Supplementary information
Supplementary information accompanies this paper at />1186/s12870-020-02661-4.
Additional file 1 Table S1 Analysis of variance for the investigated
traits of the PG-RIL in four environments. Table S2 Putative additive QTL
associated with kernel related traits in four environments. Table S3 Epistatic effects and environmental interactions of QTLs for TKW, KL, KW and
KL/W in wheat detected from the PG-RIL population. Table S4 QTL × environment interactions for TKW, KL, KW and KL/W in wheat detected from
the PG-RIL population. Table S5 Unconditional and conditional QTLs for
TKW in wheat. Table S6 Annotated genes harbored in the interval of
QTkw.cas-7D.2 and QKw.cas-7D.1. Table S7 Detailed information on a natural population consisted of 141 cultivar/lines and their alleles of TaFT-D1.
Table S8 Detailed information on 150 landraces and 172 modern cultivars and their alleles of TaFT-D1. Table S9 Primers used in this study.
Additional file 2 Fig. S1 Collinearity between the genetic (left) and
physical (right) positions for SNPs mapped on the chromosome 7DS in
PG-RIL genetic map. Fig. S2 A 1 bp InDel in TaFT-D1 caused a frameshift
Liu et al. BMC Plant Biology
(2020) 20:529
mutation of the protein. (a) Sequence alignment of TaFT-D1 showing 1
bp InDel between P3228 and G8901. (b) Protein alignment of TaFT-D1
showing frameshift mutation in P3228. Fig. S3 Heatmap showing the expression profile of DEGs at 15 development stages. Fig. S4 Allelic segregation of KASP markers AX-111061288 (a) and AX-111184541 (b) for
QTkw.cas-7D.2 and QKw.cas-7D.1.
Abbreviations
BLUP: best linear unbiased predictors; ICIM: inclusive composite interval
mapping; G8901: Gao8901; KASP: Kompetitive Allele-Specific PCR; KL: kernel
length; KW: kernel width; LOD: threshold log-of-odds; P3228: PuBing 3228;
PG-RIL: ‘PuBing3228 × Gao 8901’ recombinant inbred lines; PVE: phenotypic
variance explained; QTL: quantitative trait loci; SNP: single nucleotide
polymorphism; TKW: thousand kernel weight
Acknowledgements
The authors thank Dr. Xueyong Zhang providing the Chinese mini-core collection, including 157 landraces and 88 modern cultivars.
Page 14 of 15
2.
3.
4.
5.
6.
7.
8.
Authors’ contributions
LL and DA conceived the study. XZ, HL, FM and YC evaluated the
phenotype. HL and XZ carried out QTL mapping, predicted candidate gene,
and developed the KASP markers. JZ and YX constructed the RIL population.
HL and XZ analyzed data and wrote the manuscript. LL and DA supervised
and revised the writing of the article. All authors approved the final
manuscript.
9.
Funding
This research was financially supported by the Strategic Priority Research
Program of the Chinese Academy of Sciences (no. XDA24030102), the
National Key Research and Development Program of China (no.
2016YFD0100102), and the National Natural Science Foundation of China
(no. 31771787). The funding bodies were not involved in the design of the
study, and collection, analysis, and interpretation of data, and manuscript
writing.
12.
Availability of data and materials
All the data generated or analyzed during the current study were included
in the manuscript and its additional files. The raw data is available from the
corresponding author on reasonable request. The collection of materials
used in current study complied with institutional, national, or international
guidelines.
Ethics approval and consent to participate
Not applicable.
Consent for publication
Not applicable.
10.
11.
13.
14.
15.
16.
17.
18.
19.
Competing interests
The authors declare that they have no conflict of interest.
20.
Author details
1
Center for Agricultural Resources Research, Institute of Genetics and
Developmental Biology, Chinese Academy of Sciences, Shijiazhuang 050021,
China. 2The National Key Facility for Crop Gene Resources and Genetic
Improvement, Institute of Crop Science, Chinese Academy of Agricultural
Sciences, Beijing 100081, China. 3The Innovation Academy for Seed Design,
Chinese Academy of Sciences, Beijing 100101, China. 4University of Chinese
Academy of Sciences, Beijing 100049, China.
21.
22.
23.
Received: 22 March 2020 Accepted: 23 September 2020
24.
References
1. Ma F, Xu Y, Ma Z, Li L, An D. Genome-wide association and validation of
key loci for yield-related traits in wheat founder parent Xiaoyan 6. Mol
breeding. 2018;38(7):91.
25.
Sehgal D, Mondal S, Guzman C, Barrios G, Franco C, Singh R, et al. Validation
of candidate gene-based markers and identification of novel loci for
thousand-grain weight in spring bread wheat. Front Plant Sci. 2019;10:3389.
Su Z, Jin S, Lu Y, Zhang G, Chao S, Bai G. Single nucleotide polymorphism
tightly linked to a major QTL on chromosome 7A for both kernel length
and kernel weight in wheat. Mol Breeding. 2016;36(2):15.
Würschum T, Leiser WL, Langer SM, Tucker MR, Longin CFH. Phenotypic and
genetic analysis of spike and kernel characteristics in wheat reveals longterm genetic trends of grain yield components. Theor Appl Genet. 2018;
131(10):2071–84.
Fan C, Xing Y, Mao H, Lu T, Han B, Xu C, et al. GS3, a major QTL for grain length
and weight and minor QTL for grain width and thickness in rice, encodes a
putative transmembrane protein. Theor Appl Genet. 2006;112(6):1164–71.
Song X, Huang W, Shi M, Zhu M, Lin H. A QTL for rice grain width and
weight encodes a previously unknown RING-type E3 ubiquitin ligase. Nat
Genet. 2007;39(5):623–30.
Li Y, Fan C, Xing Y, Jiang Y, Luo L, Sun L, et al. Natural variation in GS5 plays
an important role in regulating grain size and yield in rice. Nat Genet. 2011;
43(12):1266.
Wang S, Wu K, Yuan Q, Liu X, Liu Z, Lin X, et al. Control of grain size, shape
and quality by OsSPL16 in rice. Nat Genet. 2012;44(8):950.
Zhang X, Wang J, Huang J, Lan H, Wang C, Yin C, et al. Rare allele of OsPPKL1
associated with grain length causes extra-large grain and a significant yield
increase in rice. Proc Natl Acad Sci U S A. 2012;109(52):21534–9.
Si L, Chen J, Huang X, Gong H, Luo J, Hou Q, et al. OsSPL13 controls grain
size in cultivated rice. Nat Genet. 2016;48(4):447.
Liu J, Chen J, Zheng X, Wu F, Lin Q, Heng Y, et al. GW5 acts in the
brassinosteroid signalling pathway to regulate grain width and weight in
rice. Nat Plants. 2017;3(5):17043.
Wu W, Liu X, Wang M, Meyer R, Luo X, Ndjiondjop M, et al. A singlenucleotide polymorphism causes smaller grain size and loss of seed
shattering during African rice domestication. Nat Plants. 2017;3(6):17064.
Simmonds J, Scott P, Brinton J, Mestre TC, Bush M, Del Blanco A, et al. A
splice acceptor site mutation in TaGW2-A1 increases thousand grain weight
in tetraploid and hexaploid wheat through wider and longer grains. Theor
Appl Genet. 2016;129(6):1099–112.
Qin L, Hao C, Hou J, Wang Y, Li T, Wang L, et al. Homologous haplotypes,
expression, genetic effects and geographic distribution of the wheat yield
gene TaGW2. BMC Plant Biol. 2014;14(1):107.
Zhang Y, Li D, Zhang D, Zhao X, Cao X, Dong L, et al. Analysis of the
functions of TaGW2 homoeologs in wheat grain weight and protein
content traits. Plant J. 2018;94(5):857–66.
Liu H, Li H, Hao C, Wang K, Wang Y, Qin L, et al. TaDA1, a conserved negative
regulator of kernel size, has an additive effect with TaGW2 in common wheat
(Triticum aestivum L.). Plant Biotechnol J. 2020;18(5):1330–42.
Ma L, Li T, Hao C, Wang Y, Chen X, Zhang X. TaGS5-3A, a grain size gene
selected during wheat improvement for larger kernel and yield. Plant
Biotechnol J. 2016;14(5):1269–80.
Sajjad M, Ma X, Khan SH, Shoaib M, Song Y, Yang W, et al. TaFlo2-A1, an
ortholog of rice Flo2, is associated with thousand grain weight in bread
wheat (Triticum aestivum L.). BMC Plant Biol. 2017;17(1):164.
Jiang Y, Jiang Q, Hao C, Hou J, Wang L, Zhang H, et al. A yield-associated gene
TaCWI, in wheat: its function, selection and evolution in global breeding
revealed by haplotype analysis. Theor Appl Genet. 2014;128(1):131–43.
Hou J, Li T, Wang Y, Hao C, Liu H, Zhang X. ADP-glucose pyrophosphorylase
genes, associated with kernel weight, underwent selection during wheat
domestication and breeding. Plant Biotechnol J. 2017;15(12):1533–43.
Hou J, Jiang Q, Hao C, Wang Y, Zhang H, Zhang X. Global lection on
sucrose synthase haplotypes during a century of wheat breeding. Plant
Physiol. 2014;164(4):1918–29.
Zhu J. Analysis of conditional genetic effects and variance components in
developmental genetics. Genetics. 1995;141:1633–9.
Li Q, Zhang Y, Liu T, Wang F, Liu K, Chen J, et al. Genetic analysis of kernel
weight and kernel size in wheat (Triticum aestivum L.) using unconditional
and conditional QTL mapping. Mol Breeding. 2015;35(10):194.
Zhang X, Deng Z, Wang Y, Li J, Tian J. Unconditional and conditional QTL
analysis of kernel weight related traits in wheat (Triticum aestivum L.) in
multiple genetic backgrounds. Genetica. 2014;142(4):371–9.
Ding A, Cui F, Li J, Zhao C, Wang L, Qi X, et al. QTL mapping for grain yield
conditioned on its component traits in two RIL populations of bread wheat.
Cereal Res Commun. 2013;41(1):45–53.
Liu et al. BMC Plant Biology
(2020) 20:529
26. Cui F, Li J, Ding A, Zhao C, Wang L, Wang X, et al. Conditional QTL mapping
for plant height with respect to the length of the spike and internode in
two mapping populations of wheat. Theor Appl Genet. 2011;122(8):1517–36.
27. Zhang N, Fan X, Cui F, Zhao C, Zhang W, Zhao X, et al. Characterization of
the temporal and spatial expression of wheat (Triticum aestivum L.) plant
height at the QTL level and their influence on yield-related traits. Theor
Appl Genet. 2017;130(6):1235–52.
28. Xu Y, Wang R, Tong Y, Zhao H, Xie Q, Liu D, et al. Mapping QTLs for yield
and nitrogen-related traits in wheat: influence of nitrogen and phosphorus
fertilization on QTL expression. Theor Appl Genet. 2014;127(1):59–72.
29. Wang S, Wong D, Forrest K, Allen A, Chao S, Huang BE, et al.
Characterization of polyploid wheat genomic diversity using a high-density
90,000 single nucleotide polymorphism array. Plant Biotechnol J. 2014;12(6):
787–96.
30. Winfield MO, Allen AM, Burridge AJ, Barker GL, Benbow HR, Wilkinson PA,
et al. High-density SNP genotyping array for hexaploid wheat and its
secondary and tertiary gene pool. Plant Biotechnol J. 2016;14(5):1195–206.
31. Zhou S, Zhang J, Che Y, Liu W, Lu Y, Yang X, et al. Construction of
Agropyron Gaertn. Genetic linkage maps using a wheat 660K SNP array
reveals a homoeologous relationship with the wheat genome. Plant
Biotechnol J. 2018;16(3):818–27.
32. Cui F, Fan X, Chen M, Zhang N, Zhao C, Zhang W, et al. QTL detection for
wheat kernel size and quality and the responses of these traits to low
nitrogen stress. Theor Appl Genet. 2015;129(3):469–84.
33. Brinton J, Simmonds J, Minter F, Leverington-Waite M, Snape J, Uauy C.
Increased pericarp cell length underlies a major quantitative trait locus for
grain weight in hexaploid wheat. New Phytol. 2017;215(3):1026–38.
34. Ma J, Zhang H, Li S, Zou Y, Li T, Liu J, et al. Identification of quantitative trait
loci for kernel traits in a wheat cultivar Chuannong16. BMC Genet. 2019;20:77.
35. Cheng X, Xin M, Xu R, Chen Z, Cai W, Chai L, et al. A single amino acid
substitution in STKc_GSK3 kinase conferring semispherical grains and its
implications for the origin of Triticum sphaerococcum Perc. Plant Cell. 2020;
32(4):923–34.
36. Wu Q, Chen Y, Zhou S, Fu L, Chen J, Xiao Y, et al. High-density genetic
linkage map construction and QTL mapping of grain shape and size in the
wheat population Yanda1817 × Beinong6. PLoS One. 2015;10(2):e0118144.
37. Cheng R, Kong Z, Zhang L, Xie Q, Jia H, Yu D, et al. Mapping QTLs
controlling kernel dimensions in a wheat inter-varietal RIL mapping
population. Theor Appl Genet. 2017;130(7):1405–14.
38. Su Q, Zhang X, Zhang W, Zhang N, Song L, Liu L, et al. QTL detection for
kernel size and weight in bread wheat (Triticum aestivum L.) using a highdensity SNP and SSR-based linkage map. Front Plant Sci. 2018;9:1484.
39. Chen Z, Cheng X, Chai L, Wang Z, Bian R, Li J, et al. Dissection of genetic
factors underlying grain size and fine mapping of QTgw.cau-7D in common
wheat (Triticum aestivum L.). Theor Appl Genet. 2019;133:149–62.
40. Guan P, Di N, Mu Q, Shen X, Wang Y, Wang X, et al. Use of near-isogenic
lines to precisely map and validate a major QTL for grain weight on
chromosome 4AL in bread wheat (Triticum aestivum L.). Theor Appl Genet.
2019;132(8):2367–79.
41. Golan G, Ayalon I, Perry A, Zimran G, Ade-Ajayi T, Mosquna A, et al. GNI-A1
mediates trade-off between grain number and grain weight in tetraploid
wheat. Theor Appl Genet. 2019;1(8):2353–65.
42. Sakuma S, Golan G, Guo Z, Ogawa T, Tagiri A, Sugimoto K, et al. Unleashing
floret fertility in wheat through the mutation of a homeobox gene. Proc
Natl Acad Sci U S A. 2019;116(11):5182–7.
43. Mir RR, Kumar N, Jaiswal V, Girdharwal N, Prasad M, Balyan HS, et al. Genetic
dissection of grain weight in bread wheat through quantitative trait locus
interval and association mapping. Mol Breeding. 2012;29(4):963–72.
44. Guan P, Lu L, Jia L, Kabir MR, Zhang J, Lan T, et al. Global QTL analysis
identifies genomic regions on chromosomes 4A and 4B harboring stable
loci for yield-related traits across different environments in wheat (Triticum
aestivum L.). Front Plant Sci. 2018;9:529.
45. Cui F, Zhao C, Ding A, Li J, Wang L, Li X, et al. Construction of an integrative
linkage map and QTL mapping of grain yield-related traits using three
related wheat RIL populations. Theor Appl Genet. 2014;127(3):659–75.
46. Zhai H, Feng Z, Du X, Song Y, Liu X, Qi Z, et al. A novel allele of TaGW2-A1
is located in a finely mapped QTL that increases grain weight but decreases
grain number in wheat (Triticum aestivum L.). Theor Appl Genet. 2018;131(3):
539–53.
47. Gao F, Wen W, Liu J, Rasheed A, Yin G, Xia X, et al. Genome-wide linkage
mapping of QTL for yield components, plant height and yield-related
Page 15 of 15
48.
49.
50.
51.
52.
53.
54.
55.
56.
57.
58.
59.
60.
61.
62.
63.
64.
65.
66.
67.
68.
69.
70.
71.
physiological traits in the Chinese wheat cross Zhou 8425B/Chinese spring.
Front Plant Sci. 2015;6:1099.
Wang X, Dong L, Hu J, Pang Y, Hu L, Xiao G, et al. Dissecting genetic loci
affecting grain morphological traits to improve grain weight via nested
association mapping. Theor Appl Genet. 2019;132(11):3115–28.
International Wheat Genome Sequencing Consortium. Shifting the limits in
wheat research and breeding using a fully annotated reference genome.
Science. 2018;361(6403):eaar7191.
International Wheat Genome Sequencing Consortium. A chromosomebased draft sequence of the hexaploid bread wheat (Triticum aestivum)
genome. Science. 2014;345(6194):1251788.
Zhuang QS. Chinese wheat improvement and pedigree analysis. Beijing:
China Agricultural Press; 2003. p. 11.
Su Z, Hao C, Wang L, Dong Y, Zhang X. Identification and development of a
functional marker of TaGW2 associated with grain weight in bread wheat
(Triticum aestivum L.). Theor Appl Genet. 2011;122(1):211–23.
Röder MS, Huang XQ, Börner A. Fine mapping of the region on wheat
chromosome 7D controlling grain weight. Funct Integr Genomic. 2008;8(1):
79–86.
Kamran A, Iqbal M, Spaner D. Flowering time in wheat (Triticum aestivum L.):
key factor for global adaptability. Euphytica. 2014;197(1):1–26.
Cao RF, Guo LJ, Ma M, Zhang WJ, Liu XL, Zhao HX. Identification and
functional characterization of squamosa promoter binding protein-like gene
TaSPL16 in wheat (Triticum aestivum L.). front. Plant Sci. 2019;10:212.
Ma L, Hao C, Liu H, Hou J, Li T, Zhang X. Diversity and sub-functionalization
of TaGW8 homoeologs hold potential for genetic yield improvement in
wheat. Crop J. 2019;7(6):830–44.
Liu H, Li T, Wang Y, Zheng J, Li H, Hao C, et al. TaZIM-A1 negatively
regulates flowering time in common wheat (Triticum aestivum L.). J Integr
Plant Biol. 2019;61(3):359–76.
Yan L, Fu D, Li C, Blechl A, Tranquilli G, Bonafede M, et al. The wheat and
barley vernalization gene VRN3 is an orthologue of FT. Proc Natl Acad Sci U
S A. 2006;103(51):19581–6.
Chen A, Li C, Hu W, Lau MY, Lin H, Rockwell NC, et al. PHYTOCHROME C
plays a major role in the acceleration of wheat flowering under long-day
photoperiod. Proc Natl Acad Sci U S A. 2014;111(28):10037–44.
Boden SA, Cavanagh C, Cullis BR, Ramm K, Greenwood J, Finnegan EJ, et al.
Ppd-1 is a key regulator of inflorescence architecture and paired spikelet
development in wheat. Nat Plants. 2015;1(2):14016.
Liu H, Song S, Xing Y. Beyond heading time: FT-like genes and spike
development in cereals. J Exp Bot. 2019;70(1):1–3.
Zheng J, Liu H, Wang Y, Wang L, Chang X, Jing R, et al. TEF-7A, a transcript
elongation factor gene, influences yield-related traits in bread wheat
(Triticum aestivum L.). J Exp Bot. 2014;65(18):5351–65.
Zhao J, Wang Z, Liu H, Zhao J, Tian L, Hou J, Zhang X, et al. Global status of
47 major wheat loci controlling yield, quality, adaptation and stress
resistance selected over the last century. BMC Plant Biol. 2019;19(1):5.
Sun C, Dong Z, Zhao L, Ren Y, Zhang N, Chen F. The wheat 660K SNP array
demonstrates great potential for marker-assisted selection in polyploid
wheat. Plant Biotechnol J. 2020;18(6):1354–60.
Van Ooijen JW. JoinMap® 4, software for the calculation of genetic linkage
maps in experimental populations. Wageningen, Kyazma BV; 2020.
Voorrips RE. MapChart: software for the graphical presentation of linkage
maps and QTLs. J Hered. 2002;93(1):77–8.
Meng L, Li H, Zhang L, Wang J. QTL IciMapping: integrated software for
genetic linkage map construction and quantitative trait locus mapping in
biparental populations. Crop J. 2015;3(3):269–83.
Sun Z, Li H, Zhang L, Wang J. Properties of the test statistic under null
hypothesis and the calculation of LOD threshold in quantitative trait loci
(QTL) mapping. Acta Agronomica Sinica. 2013;39:1–11.
Wang J. Inclusive composite interval mapping of quantitative trait genes.
Acta Agronomica Sinica. 2009;35:239–45.
Li S, Wang J, Zhang L. Inclusive Composite Interval Mapping of QTL by
Environment Interactions in Biparental Populations. PLoS ONE 2015;10(7):
e0132414.
McIntosh RA, Dubcovsky J, Rogers WJ, Xia XC, Raupp WJ. Catalogue of gene
symbols for wheat: 2018 supplement. Annu Wheat Newsl. 2018;64:73–93.
Publisher’s Note
Springer Nature remains neutral with regard to jurisdictional claims in
published maps and institutional affiliations.