Tài liệu Apress - Pro SQL Server 2008 Reporting Services (2008)02 pptx
Bạn đang xem bản rút gọn của tài liệu. Xem và tải ngay bản đầy đủ của tài liệu tại đây (645 KB, 10 trang )
17
■ ■ ■
CHAPTER 2
Report Authoring: Designing
Efficient Queries
SSRS
provides a platform for developing and managing reports in an environment that
includes multiple data sources of information. These data sources can include both relational
data (for example, SQL Server, Oracle, MySQL, and so on) and nonrelational data (for example,
Active Directory, LDAP stores, and Exchange Server). Standards such as ODBC, OLE DB, and
.NET facilitate the retrieval of data from these disparate data stores, so as long as your system
has the relevant drivers, SSRS can access the data. In the SSRS report design environment,
configuring a dataset that drives the report content is the first step of the design process.
However, before we introduce the many elements of the report design environment, it’s
important to begin with the heart of any data-driven report—whether it’s Business Objects
Reports, SSRS, or Microsoft Access—and that is the query. With any report design application,
developing a query that returns the desired data efficiently is the key to a successful report.
In this chapter, we will describe the following:
• The health-care database that is the target of the reporting queries in this book—you
cannot design efficient queries unless you understand the design of the data. We’ll also
describe an easy way to familiarize yourself with your data when the full schema details
are not available.
• How to design basic but effective SQL queries for reporting purposes; we’ll create queries
based on real-world applications, the kind that report writers and database administra-
tors create every day.
• How to use SSMS to gauge query performance; the initial query defines the performance
and value of the report, so it’s important to understand the tools required to create and
test the query to ensure that it’s both accurate and tuned for high performance.
• How to transform the optimized query into a parameterized stored procedure. This
gives you the benefit of precompilation for faster performance and the benefit of the
procedure being centrally updated and secured on SQL Server.
Landrum_992-6 C02.fm Page 17 Sunday, July 20, 2008 5:40 PM
18
CHAPTER 2
■
REPORT AUTHORING: DESIGNING EFFICIENT QUERIES
Introducing the Sample Relational Database
Throughout the book, we’ll show how to design and deploy a reporting solution and build
custom .NET SSRS applications for a SQL Server–based health-care application using relational
tables and stored procedures. The application was originally designed for home health and
hospice facilities that offer clinical care to their patients, typically in their homes. The Online
Transactional Processing (OLTP) database that powers this application, and the one we’ll use
for examples in this book, captures billing and clinical information for home health and hospice
patients. The database that we will use is called Pro_SSRS and is available for download in the
Source Code/Download area of the Apress Web site () with instructions
available in the ReadMe.txt file on how to restore the database in preparation for use in this and
subsequent chapters.
Introducing the Schema Design
Over the years, the application has had features added, and the database schema has been
altered many times to accommodate the new functionality and to capture data that is required.
This data is needed not only to perform operational processes such as creating bills and posting
payments to the patient’s account, but also to provide valuable reports that show how well the
company is serving its patients. Because these types of health-care facilities offer long-term
care, our customers need to know if their patients’ conditions are improving over time and the
overall cost of the care delivered to them.
The database that was ultimately designed for the application consists of more than 200 tables
and has many stored procedures. In this book, you’ll use a subset of that database to learn how
to develop reports that show the cost of care for patients. You’ll use eight main tables for the
queries and for the stored procedures you’ll begin using to build reports in the next chapter.
These tables are as follows:
• Trx: The main transactional data table that stores detailed patient services information.
We use the term services to refer to items with an associated cost that are provided for
patient care.
• Services: Stores the names and categories for the detailed line items found in the Trx
table. Services could be clinical visits such as a skilled nurse visit, but they could also
include billable supplies, such as a gauze bandage or syringes.
• ServiceLogCtgry: The main grouping of services that are similar and provide a higher-
level grouping. For example, all visits can be associated with a “Visits” ServiceLogCtgry
for reporting.
• Employee: Stores records specific to the employee, which in this case is the clinician or
other service personnel such as a chaplain visiting a hospice patient. An employee is
assigned to each visit that’s stored in the Trx table.
• Patient: Includes demographic information about the patient receiving the care. This
table, like the Employee table, links directly to the Trx table for detailed transactional data.
• Branch: Stores the branch name and location of the patient receiving the care. Branches,
in the sample reports, are cost centers from where visits and services were delivered.
Landrum_992-6 C02.fm Page 18 Sunday, July 20, 2008 5:40 PM
CHAPTER 2
■
REPORT AUTHORING: DESIGNING EFFICIENT QUERIES
19
• ChargeInfo: Contains additional information related to the individual Trx records that is
specific to charges. Charges have an associated charge, unlike payments and adjustments,
which are also stored in the Trx table.
• Diag: Stores the primary diagnoses of the patient being cared for and links to a record in
the Trx table.
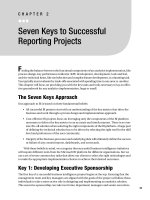
Figure 2-1 shows a graphical layout of the eight tables and how they’re joined.
Figure 2-1. Viewing the sample application’s database tables
Knowing Your Data: A Quick Trick with a Small Procedure
For every report writer, familiarity with the location of the data in a given database can come
only with time. Of course, having a database diagram or schema provided by a vendor is a
useful tool, and we have the luxury of that here, but this isn’t always available. One day, faced
with the dilemma of trying to find the right table for a specific piece of missing data, we decided
to put together a stored procedure, which we named sp_FieldInfo. It returns a list of all the
tables in a specific database that contains the same field names, typically the primary or foreign
key fields. For example, in the health-care database, if you want a list of tables that contain the
PatID field (the patient’s ID number that’s used to join several tables), you would use the following
command:
sp_fieldinfo PatID
Landrum_992-6 C02.fm Page 19 Sunday, July 20, 2008 5:40 PM
20
CHAPTER 2
■
REPORT AUTHORING: DESIGNING EFFICIENT QUERIES
The output would be similar to that shown in Table 2-1.
Armed with this information, you could at least deduce that, for example, the patient’s
physician information is stored in the PatPhysician table. However, often table and field names
aren’t intuitively named. When we encounter a database such as this from time to time, we run
a Profiler trace and perform some routine tasks on the associated application, such as opening
a form and searching for an identifiable record to get a starting point with the captured data.
The Profiler returns the resulting query with table and field names that we can then use to
discern the database structure.
■
Tip
SQL Server Profiler is an excellent tool for capturing not only the actual queries and stored procedures
that are executing against the server, but also the performance data, such as the duration of the execution
time, the central processing unit (CPU) cycles and input/output (I/O) measurements, and the application that
initiated the query. Because you can save this data directly to a SQL table, you can analyze it readily, and it
even makes good fodder as a source for a report in SSRS.
Listing 2-1 displays the code to create the sp_fieldinfo stored procedure. You can find
the code for this query in the code download file in the SQL Queries folder. The file is called
CreateFieldInfo.sql.
Listing 2-1. Creating the sp_fieldinfo Stored Procedure
IF EXISTS (SELECT * FROM sys.objects WHERE object_id =
OBJECT_ID(N'[dbo].[sp_FieldInfo]'))
DROP PROCEDURE [dbo].[sp_FieldInfo]
Go
CREATE PROCEDURE sp_FieldInfo
(
@column_name nvarchar(384) = NULL
)
Table 2-1. Output of sp_fieldinfo
Table Name Field Name
PatCertDates PatID
PatDiag PatID
PatEMRDoc PatID
Trx PatID
Patient PatID
Admissions PatID
Landrum_992-6 C02.fm Page 20 Sunday, July 20, 2008 5:40 PM
CHAPTER 2
■
REPORT AUTHORING: DESIGNING EFFICIENT QUERIES
21
AS
SELECT
Object_Name(id) as "Table Name",
rtrim(name) as "Field Name"
FROM
syscolumns
WHERE
Name like @column_name
Introducing Query Design Basics
Whether you’re a seasoned pro at writing SQL queries manually through a text editor or someone
who prefers to design queries graphically, the end result is what matters. Accuracy, versatility,
and efficiency of the underlying query are the three goals that designers strive to achieve. Accu-
racy is critical; however, having a query that’s versatile enough to be used in more than one
report and performs well makes the subsequent report design task much easier. For scalability
and low response times, efficiency is paramount. A great report that takes 15 minutes to render
will be a report your users rarely run. Keep the following goals in mind as you begin to develop
your report queries:
The query must return accurate data: As the query logic becomes more complex, the chance
of inaccuracy increases with extensive criteria and multiple joins.
The query must be scalable: As the query is developed and tested, be aware that its perfor-
mance might be entirely different as the load increases with more users. We cover
performance monitoring with simulated loads in Chapter 8. However, in this chapter we’ll
show how to use tools to test query response times for a single execution in order to improve
performance.
The query should be versatile: Often a single query or stored procedure can drive many
reports at once, saving on the time it takes to maintain, administer, and develop reports.
However, delivering too much data to a report at once, to support both details and a
summary, can impact performance. It’s important to balance versatility with efficiency.
Creating a Simple Query Graphically
Query design typically begins with a request. As the report writer or database administrator
(DBA), you’re probably often tasked with producing data that’s otherwise unavailable through
standard reports that are often delivered with third-party applications.
Let’s begin with a hypothetical scenario. Say you receive an e-mail that details a report that
needs to be created and deployed for an upcoming meeting. It has already been determined
that the data is unavailable from any known reports, yet you can derive the data using a simple
custom query.
In this first example, you’ll look at the following request for a health-care organization:
Deliver a report that shows the ten most common diagnoses by service count.
Landrum_992-6 C02.fm Page 21 Sunday, July 20, 2008 5:40 PM