Tài liệu Global Farming Systems Study: Challenges and Priorities to 2030 SYNTHESIS AND GLOBAL OVERVIEW doc
Bạn đang xem bản rút gọn của tài liệu. Xem và tải ngay bản đầy đủ của tài liệu tại đây (537.8 KB, 90 trang )
Global Farming Systems Study:
Challenges and
Priorities to 2030
SYNTHESIS AND GLOBAL OVERVIEW
J. Dixon,A. Gulliver and D. Gibbon
The Global Farming Systems Study was conducted by FAO under the overall
coordination of S. Funes (Director, Rural Development Division) and the technical
leadership of J. Dixon (Senior Officer, Farming Systems, Farm Management and
Production Economics Service, Agricultural Support Systems Division) and
A. Gulliver (Economist, Investment Centre Division).The Study benefited from
the guidance of D. Forbes Watt (Director, Investment Centre Division), J. Monyo
(Director, Agricultural Support Systems Division), D. Baker (Chief, Farm
Management and Production Economics Service, AGS) and A. MacMillan (Principal
Adviser, Project Advisory Unit,TCI) in FAO and of C. Csaki (Senior Advisor/Team
Leader-Rural Strategy) and S. Barghouti (Research Advisor) of the Rural
Development Department, World Bank.
©
FAO 2001
ii
iii
For more than a decade, the proportion of internation-
ally supported public investment directed at agricul-
ture and the rural sector in developing countries has
been declining. In the year 2000, World Bank commit-
ments to the rural sector reached their lowest ever
levels, measured as a proportion of their total lending
portfolio. Moreover, this has occurred at a time when
the process of globalisation is bringing about profound
changes in patterns of trade and investment, placing
agricultural producers and rural communities, more
generally, under tremendous pressure to adapt to
changing circumstances. Nor is there any evidence of
significant progress in reducing the incidence of
hunger. In order to reinvigorate its efforts aimed at
poverty reduction and sustainable growth among rural
populations, the World Bank initiated in 2000 a review
of its rural development strategy
1
.
As part of this review, the World Bank sought the
assistance of the Food and Agriculture Organization of
the United Nations (FAO) in evaluating how farming
systems might change and adapt over the next thirty
years. Amongst other objectives, the World Bank
asked FAO to provide guidance on priorities for
investment in food security, poverty reduction, and
economic growth, and in particular to identify promis-
ing approaches and technologies that will contribute
to these goals. The identification of future changes
affecting farming systems relied heavily on work
undertaken in FAO over many years in monitoring
trends affecting agricultural production and assessing
their likely implications for future output, productivi-
ty and nutrition levels.
2
The global study commenced with the delineation
and characterisation of about 70 major farming
systems encompassing all developing regions of the
world. As existing data systems are based, almost
without exception, on national and sub-national
administrative areas, while farming systems cross
national and even regional boundaries, it was neces-
sary to re-estimate and re-analyse a wide variety of
data relating to system characteristics, including
physical, social, economic, demographic and environ-
mental parameters. This analysis provided the neces-
sary quantitative underpinning for the central, quali-
tative, task of developing expert judgements on the
future evolution of farming systems and their devel-
opmental priorities. In all, the study encompassed the
contributions of over 40 specialists in a range of disci-
plines, both within and outside of FAO, and took
into account comments from many others. The whole
exercise was completed in just over six months.
Although any specific farming system embraces
considerable heterogeneity, the diagnosis of the
dynamics, constraints and opportunities of typical
farm households contributes to the identification of
interventions to improve system performance and sus-
tainability. Therefore, the farming systems presented
in this study are considered to provide an effective
broad framework for the prioritisation of develop-
ment actions and investments for accelerating agricul-
tural development, particularly in ways which can
reduce rural poverty and hunger.
The results of the study are summarized in a set of
seven documents, comprising six regional reports and
the global overview contained in this volume. This
document, which synthesises the results of the six
regional analyses as well as discussing global trends,
cross-cutting issues and possible implementation
modalities, presents an overview of the complete
study. This document is supplemented by two case
study reports of development issues of importance to
farming systems globally.
S. Funes,
Director,
Rural Development Division,
Sustainable Development Department,
Food and Agriculture Organization.
Preface
1
“Rural Development: From Vision to Action”. World Bank, Washington D.C., 1997.
2
Most recently in “Agriculture: Towards 2015/30.Technical Interim Repor t” Global Perspective Studies Unit, FAO, Rome, April, 2000.
iv
The Study benefited from discussions at a series of FAO seminars, working
sessions and video conferences. In particular, the contributions and edition
of A. Carloni, F. Dauphin, A. MacMillan, and J. Weatherhogg (Investment
Centre), E. Kueneman (Agriculture Department), N. Nguyen and D. Tran
(Plant Production and Protection Division), J.Bruinsma (Global Perspectives
Studies Unit), S. Tanic (Subregional Office for Central and Eastern Europe)
and D. Ivory (Regional Office for Asia and the Pacific), R. Brinkman and
M. Hall (consultants). Review and comments were contributed by S. Barghouti
and C. Csaki (World Bank), S. Barraclough and B. Roitman (consultants), as
well as by numerous FAO staff including T. Bachmann, D. Baker, L. Clarke,
R. Florin, P. Koohafkan,S. Mack, J. Maki-Hokkonen, F. Moukoko-NÕDoumbe,
F. Nachtergaele, M. Porto, J. Poulisse, R. Roberts, P. Santacoloma,
A. Shepherd, J. Slingenbergh and N. Urquia (Agriculture Department), F. Egal,
Y. Lambrou, K. Stamoulis and J. Smidthuber (Economic and Social
Department), M. Gauthier and K. Warner (Forestry Department), L. Collette,
J. Dey-Abbas, P. Groppo, A. Herrera, J. Juhasz, J. Latham, P. Munro-Faure
and D. Palmer (Sustainable Development Department) and C. Bevan,
G. Evers, T. Tecle and M. Wales (Technical Cooperation Department). Any
remaining errors are the responsibility of the Study Team.
The Study Data and GIS Team, responsible for generating the farming
systems specific data and developing the GIS-based maps used in the
study, was led by C. Auricht (consultant) with the support of P. Aguilar
(WAICENT/FAOSTAT Data Management Branch), M. Zanetti (GIS Unit), L. Hein
(Investment Centre),
G. Agostini, S. Accongiagico, M. Lespine and T. Rossetti
(consultants).
John Dixon is Senior Farming Systems Officer, Farm Management and
Production Economics Service, Agricultural Support Systems Division, FAO,
Rome, Italy.
Aidan Gulliver is an Agricultural Economist with the Project Advisory Unit,
Investment Centre Division, FAO, Rome, Italy.
David Gibbon is a Farming Systems Consultant, Sidmouth, Devon, UK.
Table of Contents
PREFACE iii
1 INTRODUCTION 1
Study Purpose 1
Poverty and Agricultural Development 1
The Concept of Farming Systems 4
Delineation of Major Farming Systems 6
Evolution of Farming Systems 8
Factors Influencing Farming Systems Development 8
Study Structure and Format 9
2 GLOBAL FACTORS INFLUENCING THE EVOLUTION
OF FARMING SYSTEMS
10
Natural Resources and Climate 10
Science and Technology 12
Globalisation and Market Development 14
Policies, Institutions and Public Goods 15
Information and Human Resources 16
3 SUB-SAHARAN AFRICA REGION 18
Introduction 18
Characteristics of the Major Regional Farming Systems 18
Regional Strategic Priorities 22
Map: Major Farming Systems 25
4 MIDDLE EAST AND NORTH AFRICA REGION 27
Introduction 27
Characteristics of the Major Regional Farming Systems 28
Regional Strategic Priorities 30
Map: Major Farming Systems 33
5 EASTERN EUROPE AND CENTRAL ASIA 35
Introduction 35
Characteristics of the Major Regional Farming Systems 35
Regional Strategic Priorities 39
Map: Major Farming Systems 43
6 SOUTH ASIA REGION 47
Introduction 47
Characteristics of the Major Regional Farming Systems 47
Regional Strategic Priorities 52
Map: Major Farming Systems 57
7 EAST ASIA AND PACIFIC REGION 59
Introduction 59
Characteristics of the Major Regional Farming Systems 61
Regional Strategic Priorities 65
Map: Major Farming Systems 69
v
vi
8 LATIN AMERICA AND THE CARIBBEAN 71
Introduction 71
Characteristics of the Major Regional Farming Systems 72
Regional Strategic Priorities 75
Map: Major Farming Systems 79
9 GLOBAL CHALLENGES AND PRIORITIES 81
The Challenge of Contrasting Farm Characteristics 81
Global Challenges and Priorities for Coming Decades 83
Achieving Sustainable and Productive Use of
Natural Resources
83
Deploying Science and Technology 84
Exploiting Globalisation and Market Development 87
Refocusing Policies, Institutions and Public Goods 89
Enhancing Agricultural Information and Human Capital 92
10 SOME OPERATIONAL IMPLICATIONS 94
Demand-driven Approaches to Integrated Rural Development
94
Support Services and Related Institutions 96
Financing Instruments 96
Assessing Impact using Farming Systems Frameworks 98
1
STUDY PURPOSE
In 1997, the World Bank issued a statement of its
global strategy for rural development entitled “Rural
Development: From Vision to Action”. Subsequently,
important improvements in the performance of the
rural portfolio have been achieved. These include
increases in quality-at-entry of rural projects, reduc-
tions in the proportion of projects at risk and an
improved impact from supervision. However, the
strategy does not appear to have achieved its key
objective of reversing the declining trend in rural
investment volumes within the Bank. In financial year
(FY) 2000, a historical low of only 38 rural develop-
ment projects were approved world-wide by the Bank,
with a total value of US$1.5 billion – in comparison
with US$4 billion in FY97. This is equivalent to only
10 percent of new loan commitments by value
3
. Of
further concern is the assessment by the Operations
Evaluation Division of the Bank during FY99 that
only 37 percent of agricultural projects and 42
percent of all rural projects were sustainable. Finally,
important changes in world-wide economic, institu-
tional and political conditions have occurred since the
preparation of Vision to Action and these now need to
be taken into account in looking at future operations.
With poverty reduction still the central goal of
the World Bank and considering that a majority of
the world’s poor are dependent on agriculture, the
Rural
Development Strategy remains an important
document,
but needs to be updated. The revised
Strategy will be more action-oriented and will have a
stronger regional focus than previously. Each regional
division of the Bank has been given primary responsi-
bility for developing its own regional strategy, and a
number of supporting studies have been commis-
sioned – largely from thematic groups within the Bank
– to provide technical inputs to the strategy formula-
tion. In this context, FAO was invited to collaborate in
preparing a supporting study with the following
objective:
“On the basis of a determination of the principal
trends and issues affecting major farming
systems in each World Bank region over the
next 30 years, propose operational strategies,
approaches and technologies that will contribute
to significant and sustainable rural development
and poverty reduction among farming system
participants.”
POVERTY AND AGRICULTURAL
DEVELOPMENT
Recent World Bank activities have been categorised
according to final beneficiary location in urban space
or rural space. Of an estimated total population in
developing countries of approximately 5.1 billion in
1999, 3.0 billion reside in rural areas. Of these some
80 percent, or 2.5 billion people, are members of agri-
cultural households
4
– including farming, pastoral,
fishing and forestry households (see Table 1-1).
Women constitute 44 percent of the 1.3 billion
persons in the agricultural labour force of developing
countries. Despite the trend towards urbanisation, the
Introduction
1
3
Cees de Haan and Sanjiva Cooke, 2000. FY00 Report on the Rural Portfolio. Unpublished Bank document. August 2000.
4
FAOSTAT, 2000. FAO, Rome.
absolute number of people living in rural areas world-
wide is growing at nearly 1 percent per annum.
5
It is estimated that, world-wide, 1.2 billion people
6
live in poverty (i.e. consume less than US$1 per day
per capita) and that 790 million are under-nour-
ished
7
. The distribution of poor people between
regions is shown in Table 1-2, for both 1987 and 1998.
A majority of the poor are found in South Asia, East
Asia and the Pacific and Sub-Saharan Africa. During
this period, the number of poor decreased in East Asia
and the Pacific (strongly influenced by China) and the
Middle East and North Africa region. In contrast, the
number of poor people has increased in the South
Asia, Latin America and the Caribbean, Eastern Europe
and Central Asia regions, with an especially large and
disturbing rise in Sub-Saharan Africa. The total popu-
lation of poor in developing countries changed little
during this period.
2
Table 1-1: Distribution of Rural and Agricultural Populations in Developing Countries
Total Rural Agric. Agric Popn. Economically Econ. Active Female Econ.
Region Population Population Population as % of Active in in Agric. as Active as %
(million) (million) (million) Total Popn. Agriculture % of Total of Econ Active
(million) Econ. Active in Agriculture
Sub-Saharan
Africa 626 417 384 61% 176 63% 47%
Middle East/
North Africa 323 138 99 31% 35 31% 44%
E. Europe/
Central Asia 478 154 86 18% 47 36% 44%
South Asia 1 325 955 742 56% 345 59% 39%
East Asia/
Pacific 1 836 1 184 1 119 61% 654 63% 47%
Latin America/
Caribbean 505 126 110 22% 44 21% 17%
Developing
World 5 093 2 974 2 540 50% 1 300 53% 44%
Note: 1999 national statistics as reported in FAOSTAT.The definition of rural varies by country, but is often a residual after urban population numbers are
extracted. Agricultural population is usually defined as individuals employed in agriculture, fishery, forestry and hunting and their non-working dependents.The
definition of developing regions follows World Development Report 2000/2001, with the exception that Turkey is included in Eastern Europe and Central Asia.
Table 1-2: Distribution of the Poor between Developing Regions (millions)
5
World Bank, 2000. World Development Indicators 2000.Table 3.1.
6
World Bank, 2000. World Development Report 2000.
7
FAOSTAT, 2000. FAO, Rome.
Developing Region 1987 1998
Sub-Saharan Africa 217 291
Middle East and North Africa 9 6
Eastern Europe and Central Asia 1 24
South Asia 474 522
East Asia and Pacific 418 278
Latin America and Caribbean 64 78
All Developing Countries 1 183 1 199
Source: World Bank (1999)
3
National data from a large number of countries
suggest that the incidence of poverty in urban areas is
less than in rural areas
8
, although the relative impor-
tance of rural poverty varies substantially from one
country to another (see Table 1-3). Across all develop-
ing countries, more than 70 percent of total poverty is
found in rural areas.
Historically, poverty alleviation and economic
growth have often been viewed by governments and
planners as distinct and separate objectives. In many
developing countries, poverty alleviation has been the
responsibility of social affairs ministries, and has
involved measures such as subsidies, safety nets and
social investment programmes. However, while pro-
ducing important short-term benefits, such measures
do not usually result in the escape of many poor
households from poverty, as they fail to address the
requirements for sustainable income generation.
Economic growth, on the other hand, has frequently
been narrowly associated with accelerated manufac-
turing activity in urban areas, often resulting in an
overall deterioration in income distribution.
In spite of the orthodox approaches outlined
above, the evidence is quite clear that agricultural
development provides an effective means for both
reducing poverty and accelerating economic growth.
As Mellor has stated,
9
it normally achieves this not
only by increasing incomes for producers and farm
workers, but more importantly by creating demand
for non-tradable goods, namely services and local
products. It is this indirect effect on demand – and the
associated employment creation – in the non-farm
sector of rural areas and market towns, that appears to
be the main contributing factor to the reduction of
rural poverty. Furthermore, as other studies show,
10
agricultural growth reduces urban poverty more
rapidly than does urban growth itself, largely because
of the consequent reduction in urban food costs and
lower rates of in-migration from rural areas. As Mellor
states: “the evidence is overwhelming that it is essen-
tial to accelerate agricultural growth if poverty is to
decline rapidly”.
Agricultural growth is undoubtedly an effective
engine for both economic development and poverty
Table 1-3: Rural/Urban Poverty Indicators for Selected Developing Countries
Population below Population below
Region/Country national poverty line (%) Region/Country national poverty line (%)
Rural Urban Rural Urban
Sub-Saharan Africa South Asia
Ghana 34.3 26.7 Bangladesh 46.0 23.3
Kenya 46.4 29.3 India 43.5 33.7
Nigeria 49.5 31.7 Nepal 44.0 23.0
Madagascar 77.0 47.0 Pakistan 36.9 28.0
Middle East/North Africa
East Asia/Pacific
Algeria 16.6 7.3 China 7.9 <2
Egypt 23.3 22.5 Indonesia 12.3 9.7
Morocco 18.0 7.6 Mongolia 33.1 38.5
Yemen 19.2 18.6 Vietnam 57.2 25.9
Eastern Europe/Central Asia
Latin America/Caribbean
Estonia 14.7 6.8 Brazil 32.6 13.1
Kazakhstan 39.0 30.0 Colombia 29.0 7.8
Kyrgyz Republic 48.1 28.7 Guatemala 71.9 33.7
Romania 27.9 20.4 Peru 67.0 46.1
Source: World Development Indicators, 2000. Table 2.7, World Bank.
8
However, a number of ex-communist countries (e.g. Mongolia, Georgia) display higher urban than rural poverty rates.
9
“
Agricultural Growth, Rural Employment and Poverty Reduction – Non-Tradables, Public Expenditure and Balanced Growth”. John W. Mellor,
Presentation to World Bank Rural Week, 2000.
10
“Why Have Some Indian States Done Better than Others at Reducing Rural Poverty” Guarav Dhatt and Ravallion, M., Economica 65: 17-38.
4
reduction. The form that this growth takes, however,
it expected to have a bearing on its input on poverty
reduction. Thus growth in the output in productivity
of small farms can be expected to have a broader
effect on poverty reduction than growth on large
mechanised holdings. It should be noted, however,
that agricultural growth alone may not be sufficient to
achieve inclusive food security in most rural commu-
nities, needing to be complemented by measures
which lead to broader access to food. Evidence from
empirical research also suggests that the provision of
public goods, especially research, extension and edu-
cation play a central role in this process. The perfor-
mance of the public sector is thus extremely important
in determining the rate and distribution of agricultur-
al growth.
The challenge for developing countries is to
identify specific agricultural and rural needs, and to
focus investment in areas where the greatest impact
on food security and poverty will be achieved. This is
made possible through developing an understanding
of the local factors and linkages found in the wide
range of rural locations subject to differing socio-
economic and ecological conditions. Within this
process, it is also extremely helpful to be able to group
locations with similar development constraints and
investment opportunities. The analysis of farming
systems facilitates both the identification and the
planning stages of the process.
THE CONCEPT OF FARMING SYSTEMS
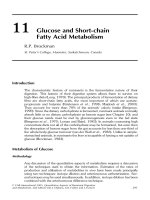
Farmers typically view their farms, whether large cor-
porations or small subsistence units, as systems. The
following diagram of a Bangladesh farm system drawn
by farmers (see Figure 1-1) illustrates the structural
complexity and interrelationships between various
components of a farm system. The diagram shows the
multiple natural resources available to farm women
and men, which often include different types of land,
various sources of water and access to common
property resources including ponds, grazing areas
and forest. To these natural resources may be added
climate and biodiversity. The resource endowment of
any particular farm depends,
inter alia, on population
density, inter-family distribution of resources and the
effectiveness of institutions in determining access to
resources.
The functioning of a farm system is strongly influ-
enced by the external rural environment, including
markets, policy and information linkages. Not only
are farms closely linked to the non-farm economy
through commodity and labour markets, but also the
rural and urban economies are strongly interdepen-
dent. For example, it is quite common for small farm
households to derive 40 percent or more of their
income from off-farm activities. Farm women and
men are also linked to rural communities and social
networks, and this social capital influences the man-
agement of farms.
For the purposes of this study, farming systems
are defined as populations of farms that have broadly
similar resource bases, enterprise patterns, household
livelihoods and constraints, and for which similar
development strategies and interventions would be
appropriate. The biophysical, economic and human
elements of a farm are interdependent, and thus
farms can be analysed as systems from various points
of view. Although smallholder farms are more
numerous than large commercial or co-operative
farms, the latter provide livelihoods for a significant
proportion of the rural population in some regions.
Regardless of their size, individual farm systems are
organised to produce food and meet other goals
through the management of available resources –
whether owned, rented or jointly managed – within
the existing social, economic and institutional envi-
ronment. They often consist of inter-dependent pro-
duction and gathering components concerned with
crops, livestock, trees and fish farming. Thus, in this
study, farm activities and household livelihoods
embrace fishing, pastoralism, farm forestry, hunting
and gathering, as well as cropping and intensive
animal husbandry. Non-farm income, which makes a
significant contribution to the livelihoods of many
poor rural families, is also considered. Farm systems
are not only found in rural areas: there is a growing
realisation of the magnitude of the urban agriculture
in many cities and towns in developing countries.
Refugees and the landless, however, are excluded in
this Study, although the impact of farming systems
development on these categories of poor will be
flagged.
11
The analysis of farming systems constitutes the
core of the Farming Systems Approach, which diag-
noses constraints and identifies opportunities and
strategic priorities for rural development. The power
11
It is understood that the landless will be covered under another study of non-farm income which also contributes to the rural development strategy formulation process. In this study the
importance of off-farm income is recognized and the linkages to farming systems development are identified, as well as the potential impact of farm growth on the landless.
5
of the approach lies in its ability to integrate multi-dis-
ciplinary analyses of production and its relationship to
resources, technologies, markets, services, policies and
institutions in their local cultural context. In such
analyses, bio-physical dimensions (such as soil nutri-
ents and water balances) and socio-economic aspects
(such as gender, food security and profitability) are
combined at the level of the farm, where most agricul-
tural production and consumption decisions are
taken. Through grouping relatively homogeneous
farms into farming systems, the approach facilitates
the
ex-ante assessment of investment and policy actions
concerning relatively large rural populations.
The use of the Farming Systems Approach as an
analytical framework became common in the late
1960s and early 1970s, as a response to the failure of
technologically driven approaches to small holder
development. Over the past 30 years, the approach
has evolved markedly, as shown in Table 1-4.
Essentially, the scope of the analysis has gradually
expanded, placing increasing emphasis on non-pro-
duction activities at the farm level, the role of the com-
munity, the environment and support services. The
current perspective, with its focus on the farm house-
hold as the centre of a network of resource allocation
decisions, corresponds closely to the Sustainable
Livelihoods Approach, promoted by DfID.
The livelihoods of practically all of the rural poor
depend directly or indirectly on natural resources.
13
Poor farm households manage small individual
resource endowments, while artisanal fishing and
pastoral households often utilise limited common
property/open access resources. The heavy depen-
dence of poor farm households on natural assets or
resources, complemented by human and social
capital, is in marked contrast to the reliance of urban
households on physical, financial and human capital;
this contrast is even more accentuated for those in
severe poverty.
Figure 1-1. Farmers’ view of farm system, Bangladesh
12
12
Extracted from “Households, Agroecosystems and Rural Resources Management. A guidebook for broadening the concepts of gender and farming systems.” Lightfoot,
C., S. Feldman and M.Z. Abedin. Bangladesh Agricultural Research Institute and the International Center for Living Aquatic resources Management. Educational Series 12.
13
I
driss Jazairy, Mohiuddin Alamgir and Theresa Panuccio. 1990. The State of World Rural Poverty. New York University Press for IFAD. Rome.
Table 1-4: Evolution of the Farming Systems Approach
14
Characteristic 1970s 1980s 1990s
2000
System Level:
Farm
Household
Groups/Community
District/Zones/Catchments or Sector
Livelihood Focus:
Crops
Crop-Livestock
Multiple Household Livelihoods
Functional Focus:
Research
Research + Extension
Research+Extension+Support Service
Multi-sectoral, incl. Non-agricultural
Stakeholder Focus:
Public
Public + Civil society
Public + Civil society + Private
Other Foci:
Gender
Household food security
Productivity+Resource mgmt
Darker squares indicate greater focus on the element in that period
DELINEATION OF MAJOR FARMING
SYSTEMS
The delineation of the major farming systems
presented in this study provides a useful framework
to determine appropriate agricultural development
strategies and interventions in developing countries.
The definition of such broad farming systems
inevitably results in a considerable degree of hetero-
geneity within any single system. However, the alter-
native of identifying discrete micro-level farming
systems in each developing country – which could
result in hundreds or even thousands of systems
world-wide – would complicate the debate concerning
appropriate regional and global strategic responses.
The main farming systems have, therefore, been
mapped in order to estimate the magnitudes of their
populations and resource bases. Within each of the
broad systems, emphasis has been placed on the iden-
tification of the typical farm type or household liveli-
hood pattern, and the associated trends and develop-
ment issues, thus contributing to the identification of
broad strategic approaches to poverty reduction, food
security improvement and agricultural growth.
The general criteria used for the definition of the
farming systems in this study have been based on the
following:
•
the available natural resource base, including water,
land, grazing areas and forest; climate – of which
altitude is one important determinant; landscape,
including slope; and farm size and tenure, in
relation to access to different resources;
6
14
Adapted from J. Dixon and P. Anandajayasekeram, 2000.“Status of FSA Institutionalisation in East and Southern Africa and its
Implications”, International Farming Systems Research Extension Symposium, November 2000, Santiago, Chile.
7
•
the dominant farm activities and household liveli-
hood pattern (e.g. crops, livestock, trees, aquacul-
ture, hunting and gathering, off-farm activities);
technologies and the resulting intensity of produc-
tion and integration of crops and livestock; and
farm management and organisation (e.g. family,
corporate, co-operative, etc).
Based on these criteria, the following seven broad
types of farming system are prevalent, to a greater of
lesser degree, in the developing regions: (i) irrigated
farming systems, embracing a broad range of food and
cash crops, and of farm sizes; (ii) rainfed farming
systems in humid high potential areas, with systems
dominated by one or another crop activity (notably root
crops, cereals, industrial tree crops – both small scale
and plantation – and commercial horticulture) and
mixed crop-livestock systems; (iii) rainfed farming
systems in steep and highland areas, often mixed crop-
livestock systems; (iv) rainfed small-scale farming
systems in dry or cold low potential areas, with mixed
crop-livestock and pastoral systems which grade into
sparse, often dispersed, systems with very low current
productivity or potential because of extreme aridity or
cold; (v) large-scale commercial farming systems, across
a variety of ecologies and with diverse production
patterns; (vi) coastal artisanal fishing and mixed farming
systems; (vii) urban-based farming systems, typically
focused on horticultural and animal production.
Applying the above criteria and farming system
groups in a pragmatic fashion, with emphasis on
poverty reduction and agricultural growth, resulted in
the identification of 72 farming systems, with an
average agricultural population of about 40 million
inhabitants. Sometimes, sufficient differences exist
within a farming system to justify reference to distinct
sub-types, for example, small scale farms and planta-
tions or commercial farms, or low altitude and high
altitude areas. The names chosen for the farming
systems reflect the seven farming systems types
outlined above and incorporate key distinguishing
attributes, notably:
•
water resource availability, e.g. irrigated,
rainfed, dry
;
•
natural resource extraction basis,
e.g.
forest-based, coastal;
•
climate, e.g. tropical, temperate, Mediterranean
;
•
landscape relief/altitude, e.g. highlands, upland,
lowland
;
•
farm scale and structure, e.g. small scale,
large scale
;
•
the dominant livelihood, e.g. root crop, tree crop,
rice-wheat, artisanal fishing, pastoral
;
•
production intensity,
e.g.
intensive, extensive, sparse;
•
crop-livestock integration, e.g. mixed;
•
location, e.g. urban based.
The spatial mapping of farming systems present-
ed in this study represents a compromise between the
usefulness of showing farming system areas in a
graphical manner, and the dangers of implying sharp
boundaries between neighbouring systems. With a
large degree of variation inevitable among individual
farm households within any one system, there are in
reality, no sharp boundaries but rather fuzzy transi-
tions. Often, one farming system gradually merges
into another. In other cases, broad systems may be
separated by limited areas with quite distinct charac-
teristics (e.g. lower slopes of mountain areas), the
identification of which would not be useful in a study
with this purpose and on this global scale.
Irrigation constitutes a special case in relation to
the heterogeneity of farming systems. Where irriga-
tion-based production is the dominant characteristic
within an area, as in the case of large-scale irrigation
schemes, the entire zone has been classified as an irri-
gation-based farming system. However, substantial
amounts of irrigation appear as small yet important
areas of otherwise rainfed farming systems, and their
implications are reflected in the analysis of constraints
and opportunities. Because irrigated agriculture is so
different from rainfed – not only in characteristics, but
also in terms of priorities and strategic approaches –
substantial localised concentrations of irrigation have
been identified through cross hatching on the farming
system maps.
For the purposes of this study, from three to five
farming systems were identified in each region on the
basis of those judged to constitute key regional targets
for poverty reduction in the coming three decades.
The main criteria employed were; (i) potential for
poverty reduction and (ii) potential for agricultural
growth. Rapid and sustained growth in a major
farming system – even one not currently associated
with high levels of poverty – could be expected to
have a significant impact on regional poverty through
migration and market linkages. Factors determining
a system’s apparent growth potential include:
(i) favourable or acceptable underlying agro-climatic
and soil conditions; (ii) a relatively high ratio of land
and other resources (water, forest) to human popula-
tion; (iii) a current low intensity of exploitation, and
(iv) the identification of constraints to intensification
which are now considered to be feasible to remove or
reduce.
EVOLUTION OF FARMING SYSTEMS
To achieve the study objective of identifying issues and
strategies related to farming systems development
during the coming 30 years requires an understand-
ing of the dynamics of farming systems.
15
Both
internal and external factors will influence the evolu-
tion of individual farms and, in aggregate, the farming
system. Whilst internal factors centre on household
goals, the resource base (closely related to population
pressure) and the technologies in use, external factors
are more diverse. These may include market develop-
ment and shifts in demand, agricultural services
and policies, and the availability of market and
policy information. Moreover, relationships are recip-
rocal; the farm system co-evolves with its external
environment.
Often, the evolution of farm systems follows a
recognisable pathway. For example, a system original-
ly dependent solely on the use of hand hoes may face
constraints as market-driven diversification occurs.
This could lead to the increasing use of cattle for
draught power, replacing some manual operations
and, if land is available, an expansion of the cultivated
area. Later, the intensification of crop production may
be driven by population expansion and shortage of
land. Market-driven evolution sometimes leads to spe-
cialisation in production and often to greater use of
external inputs. Further stages may include partial
mechanisation of crop production, substantial market
integration and increased use of inputs. Ultimately, a
high degree of production intensity is likely, perhaps
with an export orientation, usually characterised by
intensive use of inputs, land aggregation and a high
degree of mechanisation. In certain circumstances
intensive mixed systems may develop. In either case,
good technical and market information is important.
In any one location within a farming system, dif-
ferent farms may be at different stages of evolution
because of differentiated resource bases, family goals
and capacity to bear risk, or degree of market access.
Individual farm systems may also be shifted out of the
overall trajectory of system evolution because of
internal or external shocks, such as family sickness,
natural disasters, or policy shocks such as structural
adjustment. Moreover, completely new alternatives
may arise in the future, perhaps related to technology
or markets, which could not easily be foreseen at this
point.
Over decades, farming systems may differentiate
into sub-types that continue to evolve along recognis-
ably different pathways. For example, in systems
under population and market pressure some farms
may successfully intensify for market production,
whereas others may regress to low input-low output
systems. Such differentiation has been observed in
some regions under the pressure of structural adjust-
ment programmes.
In this study, an attempt is made to anticipate the
co-evolution of farming systems and their environ-
ments from the present until the year 2030, taking
account of:
•
key trends in the farming systems, including
resource and asset patterns (natural, physical,
financial, human and social), technology and pro-
ductivity, livelihoods (crops, livestock and off-farm
enterprises) and outcomes (household food security
and income);
•
key trends in the socio-economic and institutional
environments, including community organisation,
markets, services and information.
What is clear, however, is that no single strategy
can be relied upon to respond to the needs of differ-
ent farms, or the needs at different times during the
coming 30 years. Multiple support and intervention
strategies will be required to allow for these diverse
development paths, and they must be flexible enough
to evolve to meet new conditions and influences that
arise over time.
FACTORS INFLUENCING FARMING SYSTEMS
DEVELOPMENT
In order to present the analysis of farming systems
and their future development within a framework that
is broadly comparable between systems and across dif-
ferent regions, a number of broad sets of influences
have been defined, within which the discussion of
issues, trends and strategies is generally presented
for each region, as well as at a global level. These
influences, described briefly below, group factors that
8
15
Volumes have been written on the evolution of agriculture. Boserup (1965) in “The Conditions of Agricultural Growth” analysed
the effects of population growth; Pingali and Binswanger, and later McIntyre, took market development into consideration as well.
9
are of importance to the present and future status and
development of farming systems. The categories
themselves represent, in the broad opinion of a wide
range of experts within the United Nations Food and
Agriculture Organisation, the major areas in which
farming system characteristics, performance and evo-
lution are likely to be significantly affected over the
next thirty years.
Natural Resources and Climate
Issues and expected changes related to the availabili-
ty, quality, utilisation and management of natural
resources, as well as possible changes in climatic
parameters, such as rainfall, temperature and the
frequency of severe weather events.
Science and Technology
Current levels and distribution of technologies, as
well as changes and advances in their utilisation and
scientific developments in areas such as analytical
tools, biotechnology and post-harvest treatments.
Globalisation and Market Development
The impact and changes related to expanding market
infrastructure and activity in rural areas, as well as the
broader implications of reductions in barriers to trade
between countries and future patterns of demand for
agricultural outputs.
Policies, Institutions and Public Goods
The role and impact of the state and related institu-
tions on the functioning of farming systems, expressed
principally through policies, programmes, institu-
tions, services and public investment in the rural
space.
Information and Human Resources
The relevance of non-material capital to farming
systems, in terms of knowledge, information and
ability to access and utilise such knowledge.
STUDY STRUCTURE AND FORMAT
The study is documented in seven parts. This Synthesis
and Global Overview provides an outline of future
challenges, opportunities and proposed development
strategies from a world-wide perspective. The rele-
vance of farming systems analysis to rural develop-
ment is discussed, and particular attention is paid to
describing the key trends that are expected to influ-
ence farming system evolution over the next thirty
years, as well as their likely impact on poverty and
growth. This overview also presents a synthesis of the
six individual regional analyses, available separately,
and then reviews commonalities and crosscutting
issues emerging from these analyses, as well as the
lessons to be drawn in terms of broad priority areas
which would benefit from consideration in a cross-
regional context. It concludes with a brief discussion
of implementation modalities and other issues of rele-
vance to the implementation process.
The six complete regional analyses
16
provide more
detailed coverage and maps of each World Bank
region, and illustrate key issues, strategies or inter-
ventions. An initial overview of the agricultural status
of the region in question is followed by a brief descrip-
tion and prioritisation of its major farming systems.
Historical and anticipated future trends related to
agriculture within the given region are also provided.
Selected farming systems from the region are then
examined in considerable detail. As a single region
may contain as many as 15 identified farming systems,
3-5 priority systems have been selected in each region
for this particular purpose, on the basis of the poten-
tial for poverty reduction or economic growth existing
in the system. Discussion of each priority system is
divided into three sections: (i) system description; (ii)
system issues and trends, and (iii) recommended
strategies and interventions. The regional analyses
conclude with a discussion of regionally important
issues and present proposals for overall strategic
priorities.
16
Comprising Sub-Saharan Africa (AFR); Middle East & North Africa (MNA); Eastern Europe and Central Asia (ECA); South Asia (SAS);
East Asia & the Pacific (EAP); and Latin America & the Caribbean (LAC).This study does not provide any analysis of farming systems
in OECD countries except in so far as they are expected to influence systems in the developing world.
Farming systems have changed substantially in recent
decades. Their evolution is directly influenced by
internal factors – notably the availability of resources
and population growth – as well as by external factors
such as markets, new technologies, support services,
policies and information. The trends affecting these
forces at the global level are discussed in broad terms
in the following section
17
. More detailed trends at the
regional and farming system levels are presented in
the separate regional volumes and briefly summarised
in the relevant following Chapters of this document.
NATURAL RESOURCES AND CLIMATE
The interaction of natural resource availability,
climate and population determines the physical basis
for farming systems. During the early stages of devel-
opment, increasing population generally leads to an
expansion in cultivated area and, in many cases,
conflict between different land and water resources
users. Once the majority of good quality land is
already exploited, further population increases lead to
the intensification of farming systems. As forests come
under increasing pressure, biodiversity is threatened
and there may be growing tension between develop-
ment and conservation goals. These trends may be
exacerbated by colonial and post-colonial forces that
have resulted in the concentration of indigenous or
minority peoples on poorer quality land, thus aggra-
vating the degradation problem.
In the last four decades of the 20th century, the
population of developing countries has doubled,
reaching 5.1 billion in the year 2000
18
, of which
59 percent are classed as rural, and 85 percent of
those as agricultural
19
. Over the next thirty years, rates
of population growth in developing countries are pro-
jected to slow from their current level of 1.8 percent
per annum to an estimated 0.4 percent per annum.
When combined with increased rates of urbanization
(from 40 percent in 2000 to 57 percent in 2030), the
rural population of developing countries is expected
to start to decline after 2020.
The rapid population growth of past decades has
increased demand for food and other agricultural
produce. Since the early 1960s, the amount of land
under cultivation in developing countries increased by
a quarter to just over 1 billion ha; and an additional
0.1 billion ha are under permanent crops. Relative
resource availability is very much a function of popu-
lation – the availability of arable land per capita in
developing countries has declined by almost half since
the 1960s. The current pressure of agricultural popu-
lation on arable and permanent crop land averages
2.3 persons per hectare – in relation to total popula-
tion the pressure averages 4.6 persons per hectare.
The pressure of population on land varies widely
across regions, as shown in Box 2-1, from 0.3 persons
per hectare in East Europe and Central Asia and
0.7 persons per hectare in Latin America, to 4.9
persons per hectare in East Asia and the Pacific.
Since the 1960s, pasture and grazing land has
expanded, by 15 percent globally, to about 2.2 billion
ha in 1994. Some of this expansion came at the
expense of forest and woodland, which declined to
about 2.3 billion ha over the same period. Annual
10
Global Factors Influencing the
Evolution of Farming Systems
2
17
Derived from FAO staff discussions related to the Strategic Framework, Medium Term Plan and cross-depar tmental brainstorming
sessions for this Study, supplemented by FAO, 2000. Agriculture Towards 2015/2030.Technical Interim Report. FAO, Rome.
18
See Table 1-1.
19
Agricultural population is defined by FAO as those economically active in agriculture, fisheries or forestry and their dependants.
11
growth rates in arable areas vary considerably
between the regions, as shown in Box 2-2. By far the
highest growth rates in arable land were experienced
in Latin America and the Caribbean – being 1.26
percent p.a., compared with 0.18 percent p.a. in
South Asia. It is worth noting that during this period
cropping intensity rose in total only 5 percent, sug-
gesting that, in global terms, farming systems are still
in the area expansion phase.
The FAO AT 2030 report estimates that an addi-
tional 1.8 billion ha of land of “acceptable” quality
remains available for exploitation, but this seemingly
favourable scenario is constrained by a number of
factors. Much of the land categorised as suitable for
agriculture is, in fact, only suitable for a very narrow
range of crops (e.g. olive trees in North Africa).
Secondly, more than 90 percent of available land is in
Latin America and Sub-Saharan Africa, which means
that further expansion is a very limited option for
most of North Africa, Asia and the Middle East. Even
where potential for area expansion appears to exist,
over 70 percent of these areas are estimated to suffer
from one or more soil or terrain constraints.
Nevertheless, as shown in Box 2-2, FAO foresees some
continued expansion in cultivated land area to 2030 –
but at only half the rate (0.34 percent p.a.) of the last
40 years – adding about 120 million ha to the world
total. By the year 2030, despite the addition of a
further 2 billion people to the global population,
average arable land per agricultural person is actually
expected to rise slightly, as more land is brought into
cultivation and urbanisation increases.
The projected rapid increase in irrigation during
the same period reflects the uneven distribution of
agricultural land suitable for rainfed production.
Despite the typically high costs involved in developing
irrigation systems, irrigated land use has risen at three
times the rate of overall land expansion, doubling
total irrigated area world-wide since 1961 to 197
million ha. This suggests that despite global averages,
the expansion phase of agricultural systems is indeed
over in many areas. However, intensification through
irrigation has its limits too. At present, irrigation
consumes about 70 percent of the total volume of
fresh water used by humans, but this proportion is
likely to decline during the coming 30 years. Although
irrigation is expected to continue to expand in the
coming three decades, non-agricultural demand for
water is also expected to grow strongly
20
Despite the
fact that only 7 percent of total renewable water
resources in developing country are currently exploit-
ed, competition from other users together with the
fact that much of the available water is not located in
areas of agricultural need, will slow irrigation growth
in the coming decades to around 0.6 percent per
annum – only a third of its historical rate.
The expansion of agriculture plus changes in pro-
duction technologies has led to a reduction of agro-
biodiversity. During the past four decades, there
has been a considerable reduction in the number of
species and an even greater contraction in the number
of cultivars of rice, wheat and maize in current use. A
similar loss of biodiversity has occurred with domestic
animals. With the expansion of plant and animal
breeding capacity, the number of crop varieties and
animal breeds in common usage is likely to decline
even further.
There is a widespread belief that increasing pop-
ulation pressure within individual farming systems
will inevitably lead to further land resource degrada-
BOX 2-1:AGRICULTURAL POPULATION
PRESSURE ON ARABLE AND
PERMANENT CROP LAND BY REGION
(persons/ha)
Sub-Saharan Africa 2.2
Middle East & North Africa 3.1
East Europe & Central Asia 0.3
South Asia 3.5
East Asia & Pacific 4.9
Latin America & Caribbean 0.7
Source: FAOSTAT, 2000
BOX 2-2: EXPANSION IN ARABLE LAND
FROM 1961 TO 1997, AND PROJECTED
TO 2030
1961-97 1995/7-
2030
(% p.a.)
Sub-Saharan Africa 0.73 0.65
Middle East & North Africa 0.42 0.22
South Asia 0.18 0.13
East Asia & Pacific 0.91 0.07
Latin America & Caribbean 1.26 0.55
Source: FAO 2000
20
Rosegrant, M. 1997 “Water Resources in the Twenty-First Century: Challenges and Implications for Action”, IFPRI.
tion, including soil erosion, mining of soil nutrients,
depletion of groundwater and disappearance of biodi-
versity. However, evidence that increasing population
density – of humans or animals or both –
causes land
degradation is contradictory. In fact, there is a
growing body of studies that indicate that, at least in
some cases, the reverse could be true. Increased pop-
ulation density has sometimes been accompanied by
more productive and diversified farming systems and
more sustainable livelihoods (see Box 2-3). This is not
to imply that high population densities do not often
lead to severe resource management problems, partic-
ularly on unstable hill slopes. However, the relation-
ship between population density, farming systems and
resource degradation is complex and dynamic, and
degradation is not inevitable. Inequitable distribution
of land is often a root cause of degradation, through
the alienation of better quality land by capital-inten-
sive, large-scale farmers and the pushing of smaller,
weaker, or migrant farmers onto marginal land.
The nature of resource management trends
differs between high and low potential areas. In
intensely-farmed high potential areas, soil organic
matter commonly decreases, soil structure deterio-
rates and micronutrient deficiencies and nutrient
imbalances arise. In irrigated areas, ground water
tables may fall. In low potential areas, nutrient losses
from erosion and nutrient mining are increasing and
desertification is a major concern.
The potential impact of global warming has been
widely debated in the scientific community, culminat-
ing in the UN Framework Convention on Climatic
Change (UNFCCC) in 1992. Agriculture currently
contributes about 30 percent of the global anthro-
pogenic emission of greenhouse gases. Growth in the
production of these gases by crops is expected to slow,
but methane production by livestock could increase
around 60 percent by 2030. Accumulated evidence
21
now strongly suggests that impacts from global climate
change will be significant: average global surface tem-
peratures are expected to rise by an estimated 1.4 to
5.8
o
C in the next 100 years, while the frequency of
climatic extremes (temperatures, precipitation and
winds) is expected to increase dramatically. Models
based on the Intergovernmental Panel on Climate
Control (IPCC) scenario of a one percent increase in
greenhouse gases per year predict, with a very high
degree of statistical significance, that within 80 years
extremes that are currently experienced only once a
century will become normal. Rising temperatures will
inevitably lead to a rise in sea levels (estimated at
between 0.1 and 0.9m over this century).
There is little doubt that agriculture, and food
security among rural populations, will be affected by
these changes. Among the impacts predicted with
some degree of confidence by the IPCC working
group is a reduction in potential crop yields in most
tropical and sub-tropical regions, and also in mid-lat-
itudes if temperature increases are towards the
higher end of the predicted range. Water availability,
particularly in the sub-tropics, is expected to
diminish,
although some areas, such as South East Asia, may
experience increased water availability, as a result of
increased intensity in monsoon activity. There is
expected to be a widespread increase in the risk of
flooding, as a result both of rises in sea level, and as a
consequence of increased severity of precipitation
from storms, hurricanes and monsoons. Finally,
labour availability may be affected as a result of an
expected increase in the transmission of diseases,
both vector borne (e.g. malaria), and water borne
(e.g. cholera). Overall, the report states that the food
security position in Africa can only be expected to
worsen as a result of predicted climate changes.
SCIENCE AND TECHNOLOGY
Investments in agricultural science and technology
have expanded rapidly during the last four decades of
the 20th century and have led to significant innova-
tion within the sector. In addition, major technical and
institutional changes have also occurred that are
expected to lead to long-term structural changes in
12
BOX 2-3: POPULATION DRIVEN
RESOURCE ENHANCEMENT
In Machakos, Kenya increasing population density led
initially to fragmentation of land, deforestation, soil
degradation, household food insecurity and poverty.
However, recent studies have identified a U-turn in
resource management. As remittances have flowed
back into the community, farmers have invested in their
land, farm forestry has expanded rapidly, and erosion
and soil fertility declines have been reversed, leading to
resource enhancement, and rising household incomes.
22
21
IPCC Working Group 2 Third Assessment Report, February 19, 2001.
22
Machakos, Kenya (see Tiffen et al), Sindalpalchowk, Nepal (Dixon pers comm).
13
the process of technology development and dissemi-
nation. In the earlier years, the CGIAR international
research system was established and national agricul-
tural research organisations (NARs) were greatly
strengthened. More recently, the research agenda has
moved from a focus on individual crop performance
to a growing acceptance of the importance of
increased system productivity. This is viewed as result-
ing from better-managed interactions among diversi-
fied farm enterprises, from sustainable resource man-
agement, and better targeting of technologies towards
women farmers and poor households. Research
methods are being revolutionised by biotechnology.
Perhaps even more importantly in the long term, insti-
tutional modalities are now shifting. From a public
sector focus, largely led by the international system,
more emphasis is now given to public-private partner-
ships driven more by the demands of clients.
The historical focus of research effort on food
crop production technologies, with a particular
emphasis on improved varieties, has been undeniably
successful. Average crop yields have increased by
nearly three quarters (71 percent) since 1961, while
average cereal grain yields have doubled to 2.8 t/ha.
Increased yields have contributed to increased food
security at all levels and have led to declining real
prices for food grains. It is significant that FAO pro-
jections to 2030 indicate a continuing increase in land
productivity. As shown in Box 2-4, global average
wheat yields under both rainfed and irrigated condi-
tions, are expected to increase by about 40 percent
from the mid-1990s to 2030; rice yields by about 33
percent during the same period; and maize yields by
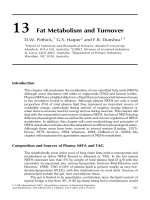
39 percent during this period (see also Figure 2-1).
BOX 2-4: PROJECTED YIELD INCREASES
TO 2030
1995-7 2030
(t/ha)
Wheat 2.46 3.44
Rice 3.50 4.63
Maize 2.52 3.49
Source: FAO 2000
Average yield increases for all cereals are expected
to be even greater under irrigation (3.82 t/ha to
5.16 t/ha) than under rainfed conditions (1.71 t/ha to
2.23 t/ha). Irrigation efficiency is expected to increase.
Average fertiliser nutrient use in developing countries
is expected to grow from around 90 kg/ha in the mid
1990s
23
to 107 kg/ha in 2030; and increases in fertilis-
er nutrient efficiency are also expected.
Investments in technology development for non-
cereal crops have usually received a lower priority.
23
A repetition of the rapid growth of the 1960-1990 period, from a low base of 7 kg/ha in the early 1960s, is not expected.
5
4.5
4
3.5
3
2.5
2
1.5
1
0.5
0
1961
1970
1980
1990 2000
2010
2020 2030
Maize Rice Wheat All Cereals
Figure 2-1: Cereal Grain Yield Trends 1961-2030
The private sector and farmers organisations have
invested in research for commercially important cash
crops – examples include coffee, tea, sugar cane and
bananas – but many tropical staples and minor cash
crops have received relatively little attention.
BOX 2-5: IS STAGNATION OF RICE YIELDS
A PROBLEM?
24
There has recently been increasing concern about stag-
nating rice yields. After rapid growth in the 1970s and
about 80s, yield increases in the 1990s have been lower
than the rate of population growth. However, a synthe-
sis of evidence suggests that these reductions do not
necessarily presage stagnation in average yields.
Potential productivity gains exist both in terms of
raising maximum yields and through reduction in the
“yield gap” between the best and the average farmers
within a region. In fact, although the annual yield
increases of about 0.8% forecast by FAO for the next
30 years are considerably slower than for earlier
decades, average global irrigated rice yields are still
expected to increase from 4.35 t/ha in the mid 1990s
to 5.77 t/ha in 2030 (rainfed rice yields are also
expected to increase).Yields also need to be viewed in
the context of the productivity of the whole farm
system over the course of the full year; in general, these
whole-farm productivity levels are rising steadily.
Weed and pest pressure is increasing for many
crops and further research is needed in this area.
Similarly, investment in livestock research has gener-
ally not been commensurate with the contribution of
the sub-sector to household income or GADP. Only
one Consultative Group research centre concentrates
on livestock (ILRI), although other centres have
animal production programmes. In contrast, agricul-
tural research in industrialised countries has been rel-
atively well funded (albeit at much lower levels than
for human sciences). Consequently, a greater range of
new technologies is available for production systems
and crops of interest to developed countries than
for smallholder production systems in developing
countries.
Growing investments in biotechnology are likely
to increase agricultural research productivity, and
have the potential to revolutionise production prac-
tices and generate customised varieties. However,
most biotechnology research is concentrated in the
private sector and thus is likely to focus on profit-gen-
erating inputs, export crops and agro-processing.
Countries such as China and Argentina have sown
large areas of genetically modified cereals, oil crops
and other commercially important species within the
last five years. Whilst there has been a gradual
decrease in the national and international public
funding available for agricultural research and exten-
sion systems, private sector biotechnology research
has attracted ample funding.
Substantial regional differences exist in the way in
which research and extension are financed, with many
Latin American countries increasingly privatising
their extension services. With the shift in public
resource allocation from agriculture to processing,
marketing and service industries, farming systems
have often become more self-reliant, more diverse or
more integrated into the rural and rural/urban
economy.
GLOBALISATION AND MARKET
DEVELOPMENT
The process of globalisation, through the reduction of
impediments to international trade and investment, is
already generating profound changes in the structure
of production at all levels, including smallholder-
farming systems in many developing countries. Not
only is market development in developing country
systems accelerating, but patterns of production and
natural resource usage are also changing profoundly
in response to market forces. The FAO AT2030 study
assumes that this process will continue at a moderate
pace, but a reversal or even acceleration is always
possible.
As barriers to trade between countries diminish,
and subsidies to industrialised country producers are
gradually removed, those products which are compet-
itive in world markets will benefit, while those that
have hitherto relied on protection will be under
threat. Broad social, economic and cultural trends will
also contribute to a profound reshaping of market
demand, as increased urbanisation, rising incomes,
improved communications and the diffusion of
cultural preferences, have their impact. Finally, the
availability of new production, post-harvest and trans-
port technologies will also change demand patterns by
making possible the delivery of new products, or
14
24
For further details see Tran, D. and N. Nguyen, 2001,Trends in Rice Yields, Crop Production and Protection Division, Case Study, Global Farming Systems Study, FAO, Rome.
15
established products in new forms, to markets where
they have been previously unattainable.
Globally, the AT2030 report forecasts that,
although no major food category will decline in
absolute terms over the next 30 years, categories such
as vegetable oils, meat, dairy and horticultural
products will grow much more rapidly than roots and
tubers or cereals for human consumption. Prices for
these staple products, with their low income elasticities
of demand, will continue a long-term secular decline,
despite the recent price peaks in 1996.
25
It should be borne in mind, however, that these
projections are based upon effective demand (i.e. pur-
chasing power) and not need. That is to say, the elim-
ination of chronic malnutrition, stunted children or
nutritionally linked diseases, will not necessarily result
from the realisation of these projections. A major
concern remains that, without public intervention
through carefully targeted measures for improving
food access, a very large number of people will
continue to remain chronically undernourished as a
result of market failure.
Although demand from urban centres in develop-
ing countries will provide a major impetus for the
increased consumption levels foreseen in AT2030,
changes in production patterns, resource constraints
and demand in industrial countries will also pro-
foundly impact market forces in the developing world
over the next 30 years:
•
previously heavily protected or subsidised products
such as wheat and rice (Europe and Japan), sugar
(Europe and U.S.), dairy products (Europe), cotton,
orange juice and tobacco (U.S.), will move to more
efficient producers, primarily in the developing
world; but only to the extent that resistance to
removal of subsidies in developed countries can be
overcome;
•
competing demands for natural resources (land and
water) and labour, and increasing restrictions on the
use of agrochemicals, will make intensive horticul-
ture more difficult to maintain in areas such as
Southern California, Florida, Mediterranean Europe
and large parts of Japan;
•
there will be an increasing tendency for environ-
mentally and socially undesirable production (e.g.
pig and poultry production, tanneries) to move
from industrial to developing countries;
•
output of ‘organic’ products, currently no more
than 1-2 percent of industrialised country markets,
will expand rapidly in importance in response to
food safety concerns, as will the demand for natural
additives (colorants, flavours) and intensive labour
requirements for these products will tend to favour
developing country producers;
•
speciality products and tropical ‘exotics’ will experi-
ence rapidly growing demand from expanding
immigrant and ethnic communities, restaurants,
returning tourists and other wealthy groups seeking
products currently not generally available in the
high income countries; and
•
demand for ready-to-eat foods (peeled, stoned, and
sliced fruit; ready made salads; pre-cut vegetables)
will drive the development of new packaging and
hygiene technologies and favour developing coun-
tries where labour is relatively cheap.
Ever larger and generally wealthier urban popu-
lations in developing countries will also drive the
expansion and intensification of marketing and agri-
cultural supply systems, support growth in interna-
tional trade – cities are easier to supply than dispersed
populations – and increase the demand for goods with
a higher income elasticity of demand (meat, dairy, oils,
fruit and vegetables). Urban agriculture will continue
to grow in importance and area. Urban demand will
also gradually expand for processed foods, creating
increased opportunities for value added in local
products.
Although high transport costs will provide some
protection, rural markets will come under increasing
external pressure as retailers, even in isolated areas,
have greater access to imported products, tinned
goods etc. Producers dependent upon the sale of sur-
pluses will find increased competition and lower
prices in local markets.
POLICIES, INSTITUTIONS AND
PUBLIC GOODS
It is well known that the development of dynamic
farming systems requires a conducive enabling policy
environment. The greatest change in this environ-
ment during the past 30 years has been structural
adjustment, which has resulted in liberalised trade
25
Rosegrant, M., M. Paisner and J.Witcover, 2000,“Global Food Projections to 2020: Emerging Trends and Alternative Futures”, IFPRI.
and exchange rate regimes and radically reduced or
eliminated subsidies. Structural adjustment has
reduced, but not eliminated, the urban bias in policies.
More recently, international agreements and the
establishment of the World Trade Organization, the
implications of which are discussed in the previous
section, have further boosted trade liberalisation.
The widespread introduction of structural adjust-
ment marked another step in a key policy trend that
can be discerned over the last few decades; the decline
of national food security as a dominant element in the
shaping of policies for rural areas. In the 1960s, the
perceived need to ensure national food security was
paramount for many governments, and justified
direct intervention in agricultural marketing, storage,
import licensing, input subsidies and other areas. Yet
the concept of food security as a key policy issue for
developing countries has not disappeared. The FAO-
sponsored World Food Summit of 1996 once more
highlighted food security, although from the perspec-
tive of reduction of hunger rather than from a
national security viewpoint.
As structural adjustment programmes have pro-
gressed, policy makers have increasingly shifted their
attention to the potential to increase the efficiency of
service delivery through the restructuring of institu-
tions. This has led to several results with enormous
long-term impact:
•
the shift in traditionally public sector roles to
civil society and the private sector;
•
the decentralisation of remaining government
services; and
•
an increasing restriction of government invest-
ment to public goods provision.
The first two trends fit well within the increasing
tendency, at a broader social level, to encourage more
local-level participation in decision making and
resource allocation, while the third is, in part, an
outcome of the shedding of many previous responsi-
bilities to the private sector. These tendencies will
probably continue to grow in importance during the
next one to two decades. However, while such trends
offer significant benefits in terms of mobilisation of
non-governmental resources and a better alignment
of public activities to local needs, they have also
created constraints. In many countries, civil society
and the private sector have experienced difficulties in
effectively replacing public services in finance, exten-
sion, education, health and infrastructure develop-
ment and maintenance, particularly in rural areas
where poverty is widespread. Smaller farmers and
female headed households have suffered especially.
The strengthening of local institutions, including
decentralisation and democratisation at local levels, is
noticeable in many countries. In recent years, the role
of women in local governance has been greatly
strengthened in some countries, although long-term
outcomes are not yet clear. These trends have exposed
rifts between central and local authorities in setting
development priorities and budgetary allocations, as
well as when developing oversight mechanisms.
A further policy area that will inevitably retain,
and even increase, its importance over the next thirty
years, is that of access to and control of natural
resources – particularly land and water. As popula-
tions increase and marginal lands suffer increasing
levels of degradation, the demands of poorer,
minority and indigenous populations for more equi-
table access to key resources will continue to intensify.
Although accelerating rates of urbanisation will relieve
some of the pressure, governments who are unable to
develop and implement effective policies on land and
water ownership, taxation, reform and management,
will face the risk of serious social conflict.
INFORMATION AND HUMAN RESOURCES
The recent evolution of farming systems based upon
increasing specialisation (e.g. large scale broiler units)
or integrated intensification (e.g. rice-fish-ducks) has
required extra knowledge on the part of farm opera-
tors.
The need for information and human capital has
also increased as production systems become more
integrated with regional, national and international
market systems. Farmers have to understand the
nature of the demand that they are responding to – in
terms of its implications for varieties, timing, packag-
ing, permitted chemicals, etc. – and increasingly to
modify their portfolio of products and activities as
market demand changes. The concept, now quite
common among farmers in developed countries, that
the product mix in five years time might look entirely
different from today, is a long way from being accepted
or even understood among farmers in many develop-
ing countries. In part, of course, smallholders may lack
the capital or risk-taking capacity to undertake such
radical changes, but a lack of education, information
and training is frequently a key limiting factor.
Many observers anticipate an information revolu-
tion during the coming 30 years that will provide large
16
17
volumes of technological, market and institutional
information to smallholder farmers. Within the next
decade or so, such a revolution is considered unlikely
to reach most producers in low income countries,
although operations that are more commercial may
well benefit
26
. It is difficult to see how computers and
the Internet are going to have much direct impact in
the short term on often functionally illiterate rural
populations who do not even have access to electricity
and adequate food resources. Inevitably, issues of
equitable access and dissemination are likely to arise,
as marginalised populations are bypassed.
Given the high returns repeatedly demonstrated
to primary education, however, it is considered likely
that rural education will expand considerably in those
countries where civil conflict is absent and economic
stability can be maintained. This development may
leave the next generation better equipped to partici-
pate in knowledge-based agriculture and utilise the
expanding information base.
26
Even so, a recent study of small and medium enterprises in Tanzania, in which nearly 90 percent of owners were trained to high school level and
above, found that over two thirds did not make significant use of the internet and similar electronic sources. “Survey of Information Technologies
within Small, Micro and Medium Enterprises in Tanzania” E. Mungunasi. Draft report prepared for the World Bank. Undated, 2000.
18
INTRODUCTION
Sub-Saharan Africa (AFR) has a total population of
626 million people and an agricultural population of
385 million (61 percent). Total land area is 2.5 billion
ha, of which about 173 million ha is under annual cul-
tivation or permanent crops. Agro-ecologically, 43
percent of the land area is arid and semi-arid, 13
percent is dry sub-humid, and the remaining 38
percent is either moist-sub-humid or humid. In West
Africa, 70 percent of the population lives in the moist
sub-humid and humid zones, whereas in East and
Southern Africa, half of the population lives in these
zones. Some 20 percent of the region’s population live
in arid and semi-arid areas.
With an estimated total of 290 million people –
almost half of the region’s population – living on less
than US$1 per day, Sub-Saharan Africa accounts for
nearly one fourth (24 percent) of the world’s poor
people. Nineteen of the 25 poorest countries in the
world are found in the region. Cumulatively, 16
percent of the region’s population lives in countries
that have a GNP per capita below US$200 per annum
and 75 percent live in countries with a GNP per capita
below US$400. In East and Southern Africa, it is esti-
mated that rural poverty accounts for as much as
90 percent of total poverty, and of the rural poor, most
are farmers. Although the drought-prone areas tend
to be poorer than other areas, because of their rela-
tively low population they account for a relatively low
proportion of the total number of poor people. The
majority of the rural poor are concentrated in the
moist sub-humid and humid areas. It is estimated
that, throughout the region, there are 236 million
agricultural poor, which represents 60 percent of the
agricultural population and 80 percent of the total
number of poor in the region.
Agriculture accounts for 20 percent of the region’s
GNP, employs 67 percent of the total labour force and
is the main source of livelihood of the region’s poor.
Agriculture is the dominant export sector for East
Africa (accounting for 47 percent of total exports), and
a significant one in all the other sub-regions of Sub-
Saharan Africa (accounting for 14 percent of exports
in Southern Africa and 10 percent in West Africa).
CHARACTERISTICS OF THE MAJOR
REGIONAL FARMING SYSTEMS
Fourteen broad farming systems were defined on
the basis of criteria such as natural resource base,
dominant livelihoods, main staple and cash income
sources (see Map).
Five of these farming systems were selected as pri-
orities: three on the basis of poverty reduction poten-
tial (Tree Crop Farming System, Maize Mixed Farming
System, and the Agro-pastoral Millet/ Sorghum
Farming System) and two on growth potential (Cereal-
Root Crop Mixed Farming System and the Irrigated
Farming System). Together they support almost half of
the agricultural population of the region.
Irrigated Farming System
This system covers 35 million ha and includes large-
scale irrigation schemes such as the Gezira scheme in
Sudan, as well as large riverine and flood recession-
based systems that are found in pockets along major
Sub-Saharan Africa
Region
27
3
27
The material in this section is extracted and summarised from the Global Farming Systems Study: “Regional Analysis: Sub-Saharan Africa”.
19
Table 3-1: Major Farming Systems in Sub-Saharan Africa
Land Agric Potential Potential
Farming area Popn Principal Incidence for for
Systems (percent (percent Livelihood of Poverty poverty agric.
of region) of region) reduction growth
Irrigated
1 3
Rice, vegetables,
Low Low High
livestock
Tree Crop
3 7
Tubers and cash
Low to High Moderate/
tree crops
Moderate High
Forest-Based
11 7
Tubers, forest
Severe Low Low/
gathering activities
Moderate
Rice-Tree
1 2
Banana, coffee,
Moderate Low Low
Crop spices,rice, roots,
legumes
Highland 1 8
Ensete, wheat,
Very Severe High Low
Perennial livestock, off-farm
activities
Highland
2 8
Wheat, barley,
Moderate Moderate Low/
Temperate legumes, livestock,
Moderate
off-farm activities
Root Crop
12 12 Yams, legumes, Low Moderate
Moderate
vegetables
Moderate
Cereal-Root
13 15
Maize, sorghum,
Low Low High
Crop Mixed cassava, yams,
livestock,
off-farm activities
Maize Mixed
10 16
Maize, cassava,
Moderate High Moderate/
cattle remittances
High
Large
5 5
Cereals, legumes,
Low Low Moderate
Commercial &
livestock, remittances
(moderate
Smallholder labourers)
Agro-Pastoral
8 9
Millet, sorghum,
Severe High Low/
Millet/ livestock, remittances
Moderate
Sorghum
Pastoral
14 7
Livestock, remittances
Severe Low Low
Sparse (arid) 18 2
Livestock, remittances
Severe Low Low
Coastal
2 3
Artisanal fishing,
Moderate Low Low/
Artisanal coconuts, cashew Moderate
Fishing
Urban-Based
Not little
Horticulture, dairying,
Low Low High
mapped
fattening livestock
Priority systems for poverty reduction and/or growth are shaded