TỐI ưu hóa DUNG LƯỢNG của hệ THỐNG NĂNG LƯỢNG tái tạo hỗn hợp cấp điện CHO PHỤ tải SINH HOẠT ở hà nội sử DỤNG HOMER
Bạn đang xem bản rút gọn của tài liệu. Xem và tải ngay bản đầy đủ của tài liệu tại đây (557.05 KB, 9 trang )
TNU Journal of Science and Technology
226(15): 3 - 11
OPTIMAL SIZING OF A STAND-ALONE HYBRID RENEWABLE ENERGY
SYSTEM SUPPLYING FOR RESIDENTIAL LOAD IN CHUONG MY, HANOI
USING HOMER
Nguyen Thi Hoai Thu1*, Nguyen Huu Tri2
1School
of Electrical Engineering - Hanoi University of Science and Technology,
My Power Company
2Chuong
ARTICLE INFO
ABSTRACT
Received: 12/6/2021
In recent years, Vietnam is witnessing a blooming installation of
renewable energy sources, namely the photovoltaic and wind turbine
system. For the effective applications of the renewable energy
sources, one important question is the optimal sizing of the system. In
this paper, we evaluated the feasibility of a standalone system
supplying to an industrial load and then selected the optimized system
using HOMER (Hybrid Optimization Model for Electric Renewable)
software. The proposed hybrid system includes PV/wind turbine
combined with diesel generator and battery. The system was
optimized to meet the residential load of 61849 kWh/day with a
3853.95 kW peak load demand in Chuong My province. The result
shows that the optimal configuration consisted of 7112 kW PV arrays,
4200 kW diesel generators, 10947 kWh nominal batteries, and 3284
kW converters which had the minimum Net Present Cost of $107
million. Sensitivity analysis was also carried out to evaluate the
impact of some economic parameters on the optimal design as well as
the Net Present Cost.
Revised: 12/8/2021
Published: 12/8/2021
KEYWORDS
Optimal sizing
Stand-alone hybrid system
Renewable energy
HOMER software
Sensitivity analysis
TỐI ƯU HÓA DUNG LƯỢNG CỦA HỆ THỐNG NĂNG LƯỢNG TÁI TẠO
HỖN HỢP CẤP ĐIỆN CHO PHỤ TẢI SINH HOẠT Ở CHƯƠNG MỸ,
HÀ NỘI SỬ DỤNG HOMER
Nguyễn Thị Hoài Thu1*, Nguyễn Hữu Trí2
1Viện
Điện - Trường Đại học Bách khoa Hà Nội,
ty Điện lực Chương Mỹ
2Cơng
THƠNG TIN BÀI BÁO
Ngày nhận bài: 12/6/2021
Ngày hồn thiện: 12/8/2021
Ngày đăng: 12/8/2021
TỪ KHĨA
Dung lượng tối ưu
Hệ thống hỗn hợp độc lập
Năng lượng tái tạo
Phần mềm HOMER
Phân tích độ nhạy
TĨM TẮT
Trong những năm gần đây, việc lắp đặt các nguồn năng lượng tái tạo
như điện mặt trời và điện gió đang bùng nổ ở Việt Nam. Tuy nhiên
để có thể sử dụng những nguồn năng lượng tái tạo một cách hiệu quả,
một vấn đề đặt ra là cần xác định kích thước tối ưu của hệ thống này.
Bài báo này phân tích và lựa chọn cấu hình tối ưu của hệ thống hỗn
hợp năng lượng tái tạo kết hợp với máy phát diesel và ắc quy cấp
điện cho phụ tải bằng phần mềm HOMER. Hệ thống được tối ưu hóa
để đáp ứng phụ tải sinh hoạt 61849 kWh/ngày với công suất đỉnh
3853,95 kW tại huyện Chương Mỹ, Hà Nội. Kết quả cho thấy, cấu
hình tối ưu bao gồm PV 7112 kW, máy phát điện diesel 4200 kW,
pin ắc quy 10947 kWh và bộ chuyển đổi 3284 kW, có chi phí hiện tại
rịng nhỏ nhất là 107 triệu $. Ngồi ra, nghiên cứu cũng tiến hành
phân tích độ nhạy để đánh giá tác động của một số thông số kinh tế
đến thiết kế tối ưu cũng như đến chi phí hiện tại rịng.
DOI: />
*
Corresponding author. Email:
3
Email:
TNU Journal of Science and Technology
226(15): 3 - 11
1. Introduction
The development of Vietnam's electricity industry is facing more and more challenges to meet
the energy demand for economic growth and to improve people's living standards. Some of the
major challenges can be raised as follows: the primary energy sources are gradually exhausted,
leading to the need of import fuel; the increasingly strict requirements for environmental issue, ...
The development of renewable energy (RE) can be an alternative solution for these challenges.
However, the strong development of power sources using RE such as wind and photovoltaic
system (PV) also leads to certain difficulties in power system operation [1]. On the other hand,
the dependency on the site and the intermittent nature of the weather make these sources difficult
to be used as an independent energy provider [2]. Moreover, the oversizing of the components
due to the sudden changing of the energy can lead to higher design cost for the system in
comparison with the conventional source [3]. Due to the high cost, the issue of optimal sizing of
the hybrid system becomes necessary and need to be calculated before planning a project.
In literature, the optimization of different types of hybrid energy system such as PV/Wind,
Wind/Diesel, PV/Wind/Diesel, and PV/Diesel generator combined with or without the battery
were considered and proven a cost efficient for the off-grid areas. The use of diesel generator as
backup power generation along with renewable energy base systems improves the reliability of
system and is more beneficial than the stand-alone solar and wind energy system [3], [4]. An
analysis on the technical, economic and environmental issue to find out the optimal hybridized
system was reported in [3]. However, the sensitivity of cost inputs of different hardware
components was not investigated. In [4], the authors investigated a feasibility analysis of
PV/Wind/Batt/ Diesel system for the electrification of a remote area. The study indicated that the
hybridized system was economically and environmentally feasible compared to the conventional
power generation system. The sensitivity analysis of input cost components was also not
considered.
As mentioned above, RE has been received more and more attention not only in the world but
also in Vietnam. Many RE projects have been developed across the country. However, there are
not many studies about the optimal sizing of such a system in Vietnam, especially the analysis on
the techno-economic and the emission. Therefore, this paper focuses on the sizing optimization
of a stand-alone hybrid PV/wind/battery/diesel system supplying for case study of the residential
load in Chuong My province, Hanoi. We also considered the emission of CO2 and examined
different types of the hybrid system to compare the optimal configurations. Additionally, the
sensitivity analysis on various input parameters on the cost of the energy system as well as the
load uncertainty was investigated. The simulation and economic analysis were carried out using
Hybrid optimization model for electric renewables (HOMER). The model of PV output power
was simulated as a function of the solar irradiance and the temperature [5], [6]. The wind turbine
power output and fuel consumption were expressed as similar in [7].
2. Methodology
The methodology adopted in this paper included the following steps: modelling the system
components, establishing the optimization problem, collecting the load data and the
meteorological data, and finally using HOMER for the techno-economic analysis and for
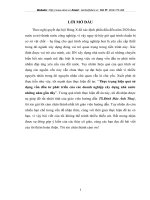
sensitivity analysis. The full grid-independent hybrid system under study was shown in Figure 1.
PV arrays and a battery were connected to a DC bus while wind turbine, diesel generator and
electrical load were connected to an AC bus. Then, the DC system was converted into AC
through converter and also connected to the AC bus. Different system components, for example
with or without diesel generator were examined and clarified in section 3.
2.1. System modelling
4
Email:
TNU Journal of Science and Technology
226(15): 3 - 11
2.1.1. Modelling of PV system
The model of PV output power can be simulated as the function of the solar irradiance and the
temperature [5], [6].
G (t )
(1)
PPV (t ) = PPV − r PV
1 − (Tc − Tref )
G
ref
where G(t) is the irradiation perpendicular to the surface of the photovoltaic array, PPV-r is the
nominal power of the panel, ηPV is the efficiency of panels, βT is the photovoltaic temperature
coefficient (0.00485), TC is the temperature of the cell under operating condition. Gref, Tref is the
irradiation and the cell temperature under standard test conditions (25ºC).
Figure 1. Block diagram of the stand-alone system with full components
2.1.2. Modelling of Wind turbine system
The wind turbine power output is expressed as follows [7]
0
3
a. (V (t ) ) − b.Pw− r
Pwt (t ) =
Pw− r
0
V (t ) Vi
where
Vi V (t ) Vr
Vr V (t ) Vo
V (t ) Vo
Pw− r
a = V 3 − V 3
r
i
3
V
i
b =
Vr3 − Vi 3
(2)
where Vi (m/s) is the cut-in speed, Vo (m/s) is the cut-off speed and Vr (m/s) is the rated speed
of the wind turbine. The rated power is Pw-r (kW).
2.1.3. Modelling of battery
Battery is integrated in the system to charge the surplus power and discharge the shortage
power. The energy in battery can be estimated using following equation
BA.disch
BA.ch
PDCside
( t − 1) Δt
ch
(3)
EBA ( t ) = EBA ( t − 1) (1 − σ ) + PDCside
t
−
1
η
η
−
( )
CONV
disch
η ηCONV
BA.ch
BA.disch
where EBA(t) is the energy in the battery at time t, 𝑃DCside
(𝑡), 𝑃DCside
(𝑡) is the charge and
discharge power allocated to the battery at DC bus side of DC/DC converter, σ is the selfdischarge rate of the battery (0.0002), Δt is time step (1 h). ηch and ηdisch are the efficiencies of the
charge and discharge process (0.9), ηCONV are the converter efficiency (0.95).
2.1.4. Modelling of diesel generator
When battery is deeply discharged, the insufficient power will be supplied from the diesel
generator. The fuel consumption can be modelled as the function of its electrical output as follows [7]:
(4)
B(t ) = PDG −r + PDG
where α is the fuel curve intercept coefficient (0.246l/kWh), β is the fuel curve slope (0.08145
l/kWh), PDG-r (kW) is the rated capacity of the generator and PDG(t) (kW) is the electric output of
5
Email:
TNU Journal of Science and Technology
226(15): 3 - 11
the generator at time t. The lower heating value of diesel fuel is 43.2 MJ/kg with a density of 820
kg/m3 [8].
Moreover, CO2 will be emitted when the diesel generator operates, the emission can be
calculated as follow [8]:
8760
(5)
mCO = fCO B (t )
2
2
t =1
in which mCO2 is the annual amount of emission (kg/year), fCO2 is the emission factor of diesel
(2681 g/l).
2.2. Sizing optimization problem
The objective function of this problem is to determine the optimal configuration of the hybrid
system (PPV-r, Pw-r, PDG-r, EBA-r, PCONV) in order to minimize the Net present cost (NPC). The NPC
is the present value of all the costs the system, minus the present value of all the revenue it earns
over the project lifetime. In general, the costs include capital costs, replacement costs, operation
and maintenance costs and fuel costs.
(6)
NPC = Cequip CRF + COM + CGas
CRF =
i(1 + i ) N
(1 + i) N − 1
(7)
where Cequip is the annualized capital cost for both the main, auxiliary equipment and
replacement cost, COM is the annual operation and maintenance cost, and CGas is the annual cost
of fuel consumption for diesel generator. CRF is the capital recovery factor, i is the interest rate,
N is the project lifetime (25 years). The detail of these costs can be referred in [9], [10]. The
economic parameters of equipment were shown in Table 1 [11]. The cost of fuel is 1 $/litre.
Table 1. Economic parameters of the components
PV
WT
Batt
CONV
DG
Capacity
1 kW
3 kW
1 kWh
1 kW
autosize
Capital
2500 $
18000 $
300 $
300 $
500 $/kW
O&M
10 $/year
180 $/year
10 $/year
0
0,03 $/h
Lifetime
25 years
20 years
10 years
15 years
15000 hours
The objective is subject to the following constraints
a. Load balance constraint: PPV(t) + PWT(t) + PDiesel(t) + PBatt(t) = PLoad(t)
b. CO2 emission constraint: mCO CO max
c. Constraints of nominal capacity of equipment:
0 PPV (t ) PPV − r , 0 Pw (t ) Pw−r , 0 EBA (t ) EBA−r
2
2
(8)
(9)
(10)
2.3. HOMER software
Figure 2. The procedure to design the system using HOMER
6
Email:
TNU Journal of Science and Technology
226(15): 3 - 11
HOMER is a software designed and developed by the US National Renewable Energy
Department (NREL) to model, simulate, optimize and sensitize the investigated power system.
HOMER simulates the operation of a system by making energy balance calculations for each
of the 8,760 hours in a year for each configuration of the system and then determines the optimal
system configuration that is technically feasible within the defined system constraints and has the
minimum net present cost. The cost includes the capital and operating cost of the feasible system
over the lifetime of the project. The input data such as load profile, solar radiation, the selected
site, wind speed data, and technical and economic data of the components involved in the system
have to be provided to the software [5].
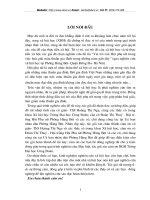
The procedure to design the system using HOMER was illustrated in Figure 2 [7]. The inputs
include the load data, meteorological data of the site, the system components, the objective
function, as well as the constraints. Load data was collected and imported by user. The
meteorological data, namely the solar irradiation for PV and wind speed for wind turbine of the
selected location can be obtained from “NASA surface meteorology and Solar Energy Database”.
In the system components block, we have to determine which devices are included in the system.
The technical and economic parameters of devices can be user-defined or selected from the
HOMER database. HOMER will calculate the NPC of the systems and select the optimal
configuration with minimum NPC.
2.4. Load profile
The proposed system was designed to supply to the residential load of one distribution line in
Chuong My province. The typical load was collected and used as input of the system. The load
energy and the peak load requirement was calculated to be approximately 61 850 MWh/day and
3801.85 kW respectively. The typical daily electric load profiles of the residential community
were illustrated in Figure 3. The load variance throughout 24 hours of a day was clearly shown in
the load profiles with the maximum load requirement at night. During the day, most of the family
members may not be at home that is why load profile is lower meanwhile at night all the family
members will be at home, which leads the load to increase.
Figure 3. The typical daily residential load of a distribution line in Chuong My, Hanoi
2.5. Meteorological data
Solar radiation data was obtained by using HOMER software for the location of Chuc Son,
Chuong My at 20.8746°N latitude and 105.6712°E longitude from “NASA surface meteorology
and Solar Energy Database”. The annual scaled average solar radiation was found to be 4.030
kWh/m2/day and the maximum solar radiation was 4.904 kWh/m2/day. Data showed that the
location had relatively good solar potential and could produce power in efficient way using
photovoltaic (PV) panels. A profile indicating solar radiation created by the HOMER for the
location was shown in Figure 4 (a). Similarly, wind speed at Chuong My was also acquired by
using HOMER and illustrated in Figure 4(b). The annual average wind speed was estimated of
7
Email:
TNU Journal of Science and Technology
226(15): 3 - 11
3.65 m/s and the maximum value was 4.56 m/s. It can be seen that the wind speed was not really
high, so the potential for wind power in this location may be infeasible. We analysed and proved
this assessment in the results and discussions.
(a)
(b)
Figure 4. Solar radiation (a) and wind data (b) in Chuong My, Hanoi
3. Simulation results and discussion
3.1. Base scenarios
In this study, we optimized the system sizing for 4 different base cases of the system
components. The components were included in each scenario as following:
Case 1: The system includes PV, battery and converter supplying to the load
Case 2: The system includes wind turbine, battery and converter
Case 3: The system includes both PV and wind turbine, battery and converter
Case 4: The system includes not only PV, wind turbine battery and converter but also
diesel generator.
For each case, the optimal designing of the system was calculated and presented in Table 2.
It can be seen that in the first case, the optimal result was to use a PV system of 44,840 kWp
with 230,648 kWh battery and converters of 7,106 kW. The lowest NPC was considerably high
of 278 M$. Because the solar source was available only during daytime while the peak load
occurred at night, the system needed a huge battery capacity to response to the load.
Meanwhile in case 2, only wind turbines were used as the primary energy sources, HOMER
gave no results. This can be explained by that Chuong My is a place where the wind speed is
considerably low with the average value of 3.65 m/s, just a slightly higher than the cut-in speed
of the wind turbine, then this location is not suitable and ineffective for developing wind power.
The result of case 3 was similar to case 1 because as previously analysed, the appearance of
wind turbine for this place was infeasible. The load was totally supplied from the PV and battery.
In case 4, the optimized system was composed of 7,112 kW PV, diesel generators of 4,200
kW, 10,947 kWh battery and converters of 3,284 kW. It can be seen that the lowest NPC in this
case was 107 M$, significantly smaller than the NPCopt in case 1. This is due to the participation
of diesel generator to meet the load requirement at night when there is no solar radiation which
can decrease the needed sizing of battery and the total cost of the system. It can be noted that
diesel generator sizing of 4,200 kW was quite high. Looking into the load profile, we can see that
the peak load occurred at 21 h meanwhile PV was not available in the evening and at night. Then
battery system would provide energy in the evening. If they could supply the peak load, the size
might be very high as in case 1, leading to high total cost. Therefore, in this case, the use of diesel
generator for peak load was more economic.
3.2. Sensitivity and uncertainty analysis
The results of the study were further extended by analysing the sensitivity to investigate the
impact of the variation of different input parameters on the optimal sizing and the NPCopt of the
system. In this study, we examined the change of the following parameters for the system of the
case 4 which includes PV/battery and diesel generator: PV panel cost, diesel cost, ε CO2 constraint.
Additionally, the uncertainty of the load was also considered.
8
Email:
TNU Journal of Science and Technology
226(15): 3 - 11
Table 2. Optimal sizing of the system in 4 cases
Base
case
Case 1
Case 2
Case 3
Case 4
PVopt
(kW)
44,840
WTopt
(kW)
0
Dieselopt
(kW)
0
44,840
7,112
0
0
0
4,200
Converteropt
(kW)
7,106
No result
7,106
3,284
Battopt
(kWh)
230,648
NPCopt
($)
278M
RE
fraction
100%
230,648
10,947
278M
107M
100%
36.4%
3.2.1. Scenario 1: PV cost decreases
When the PV technology is more and more developing, the PV cost will decrease. Thus, we
examined the scenario of the PV capital cost halved. In this scenario, the optimal sizing of PV
and battery increased. The size of diesel generator, however, was unchanged to response to the
peak load at night meanwhile the battery did this task during time of no solar irradiation before
this peak time, similar to the base case. The NPCopt decreased from 107 M$ to 94.1 M$ and the
rate of renewable energy, namely the PV, increased from 36.4% to 44.7%.
3.2.2. Scenario 2: Diesel cost increased 50%
Contrary to the PV cost, the price of diesel trends to increase. In the scenario of the price of
diesel raised of 50%, although the size of DG was still unchanged, the size of PV and battery also
increased. We witnessed a slightly rise of the RE fraction from 35.4% to 37.6% with a higher
NPCopt of 133 M$.
3.2.3. Scenario 3: Constraint of CO2 decreased to 50% and there was no constraint
In the base case, the emission of CO2 was limited to 12 Mkg/year, in this scenario, we would
change the constraint of emission to 6 Mkg/year and to no constraint. When the emission was
halved, the use of DG was limited and the fraction of RE increased to nearly 100% as in the base
case 1, then the NPCopt soar to 276 M$. On the other hand, when there was no constraint of
emission, due to the high capital cost of PV, the proportion of RE would decrease and supply
only 1.08% of needed energy.
3.2.4. Scenario 4: Load uncertainty of 10%
In the base case 4, we had not considered the uncertainty of load, meaning that the load was
deterministic during the simulation. However, in fact the load could not be exactly predicted, the
uncertainty should be examined. With the uncertainty of 10%, the ratio of RE was slightly
declined to 34.4%. The size of DG rose to 5,800 kW to meet the new peak demand.
Figure 5. Optimal sizing comparison for sensitivity analysis
9
Email:
TNU Journal of Science and Technology
226(15): 3 - 11
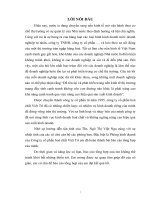
The details of the above sensitivity analysis were shown in Table 3 and Figure 5. In Figure 5,
the comparison of the optimal components sizing in 4 scenarios with the base case 4 was
presented in which the base case sizing was considered as base value of 1, the other sizing
scenarios were calculated in relative value by dividing the size to the base.
Table 3. Optimal sizing of components when the input parameters changed
Components
Base
case
PV cost
halved
PVopt (kW)
DGopt (kW)
CONVopt (kW)
BATTopt (kWh)
NPCopt (M$)
RE fraction (%)
7,112
4,200
3,284
10,947
107
36.40
9,860
4,200
3,327
10,918
94.1
44.70
Diesel cost
increased
150%
7,666
4,200
3,331
11,223
133
37.60
CO2
constraint
halved
44,750
4,200
4,807
238,256
276
99.20
No CO2
constraint
201
4,200
123
0
107
1.08
Load
uncertainty of
10%
6,857
5,800
383
12,409
118
34.40
4. Conclusion
In this paper, a comprehensive techno-economic-environmental analysis was carried out to
find out the optimal design of an off-grid hybrid system of RE/battery and diesel supplying to the
residential load in Chuong My, Hanoi. The results showed that wind power was infeasible for
this location. The combination of RE/battery system with diesel generator had the lower NPC
than the only source of RE and battery. However, with the strict constraint of emission, the
participation of DG would be limited. Moreover, from the sensitivity analysis result, it can be
seen that the constraint of emission and the capital cost of PV would significantly impact on the
RE share ratio. With the downtrend of PV cost, the development of PV system is feasible.
REFERENCES
[1] Institute of Energy, “National Electricity development Planning for 2021-2030 vision to 2045,” p. 843.
[2] A. Brka, Y. M. Al-Abdeli, and G. Kothapalli, “Predictive power management strategies for stand-alone
hydrogen systems: Operational impact,” Int. J. Hydrog. Energy, vol. 41, no. 16, pp. 6685–6698, May
2016, doi: 10.1016/j.ijhydene.2016.03.085.
[3] M. Mehrpooya, M. Mohammadi, and E. Ahmadi, “Techno-economic-environmental study of hybrid
power supply system: A case study in Iran,” Sustain. Energy Technol. Assess., vol. 25, pp. 1–10, Feb.
2018, doi: 10.1016/j.seta.2017.10.007.
[4] SK.A.Shezana, S.Julai, M.A.Kibria, K.R.Ullah, R.Saidur, W.T.Chong, and R.K.Akikur, “Performance
analysis of an off-grid wind-PV (photovoltaic)-diesel-battery hybrid energy system feasible for remote
areas,” J. Clean. Prod., vol. 125, pp. 121–132, Jul. 2016, doi: 10.1016/j.jclepro.2016.03.014.
[5] D. N. Luta and A. K. Raji, “Optimal sizing of hybrid fuel cell-supercapacitor storage system for offgrid renewable applications,” Energy, vol. 166, pp. 530–540, Jan. 2019, doi:
10.1016/j.energy.2018.10.070.
[6] N. T. H. Thu, “Sizing optimization of a Photovoltaic/Battery system based on analysis of the annual
total solar radiation in the north of Vietnam,” TNU J. Sci. Technol., vol. 225, no. 13, Aug. 2020, doi:
10.34238/tnu-jst.3367.
[7] S. Mandal, B. K. Das, and N. Hoque, “Optimum sizing of a stand-alone hybrid energy system for rural
electrification in Bangladesh,” J. Clean. Prod., vol. 200, pp. 12–27, Nov. 2018, doi:
10.1016/j.jclepro.2018.07.257.
[8] HOMER Energy, “HOMER2_2.8_HelpManual.pdf.”, Jan 16, 2015. [Online]. Available:
[Accessed: Jun. 11, 2021]
[9] B. K. Das, N. Hoque, S. Mandal, T. K. Pal, and M. A. Raihan, “A techno-economic feasibility of a
stand-alone hybrid power generation for remote area application in Bangladesh,” Energy, vol. 134, pp.
775–788, Sep. 2017, doi: 10.1016/j.energy.2017.06.024.
10
Email:
TNU Journal of Science and Technology
226(15): 3 - 11
[10] V. Khare, S. Nema, and P. Baredar, “Optimization of hydrogen based hybrid renewable energy system
using HOMER, BB-BC and GAMBIT,” Int. J. Hydrog. Energy, vol. 41, no. 38, pp. 16743–16751,
Oct. 2016, doi: 10.1016/j.ijhydene.2016.06.228.
[11] R. Rajbongshi, D. Borgohain, and S. Mahapatra, “Optimization of PV-biomass-diesel and grid base
hybrid energy systems for rural electrification by using HOMER,” Energy, vol. 126, pp. 461–474,
May 2017, doi: 10.1016/j.energy.2017.03.056.
11
Email: