Tài liệu Real time digital signal processing P4 docx
Bạn đang xem bản rút gọn của tài liệu. Xem và tải ngay bản đầy đủ của tài liệu tại đây (376.37 KB, 54 trang )
4
Frequency Analysis
Frequency analysis of any given signal involves the transformation of a time-domain
signal into its frequency components. The need for describing a signal in the frequency
domain exists because signal processing is generally accomplished using systems that are
described in terms of frequency response. Converting the time-domain signals and
systems into the frequency domain is extremely helpful in understanding the character-
istics of both signals and systems.
In Section 4.1,the Fourier series and Fourier transform will be introduced. The
Fourier series is an effective technique for handling periodic functions. It provides a
method for expressing a periodic function as the linear combination of sinusoidal
functions. The Fourier transform is needed to develop the concept of frequency-domain
signal processing. Section 4.2 introduces the z-transform,its important properties,and
its inverse transform. Section 4.3 shows the analysis and implementation of digital
systems using the z-transform. Basic concepts of discrete Fourier transforms will be
introduced in Section 4.4,but detailed treatments will be presented in Chapter 7. The
application of frequency analysis techniques using MATLAB to design notch filters and
analyze room acoustics will be presented in Section 4.5. Finally,real-time experiments
using the TMS320C55x will be presented in Section 4.6.
4.1 Fourier Series and Transform
In this section,we will introduce the representation of analog periodic signals using
Fourier series. We will then expand the analysis to the Fourier transform representation
of broad classes of finite energy signals.
4.1.1 Fourier Series
Any periodic signal, x(t),can be represented as the sum of an infinite number of
harmonically related sinusoids and complex exponentials. The basic mathematical
representation of periodic signal x(t) with period T
0
(in seconds) is the Fourier series
defined as
Real-Time Digital Signal Processing. Sen M Kuo,Bob H Lee
Copyright # 2001 John Wiley & Sons Ltd
ISBNs: 0-470-84137-0 (Hardback); 0-470-84534-1 (Electronic)
xt
I
kÀI
c
k
e
jkO
0
t
, 4:1:1
where c
k
is the Fourier series coefficient,and V
0
2p=T
0
is the fundamental frequency
(in radians per second). The Fourier series describes a periodic signal in terms of infinite
sinusoids. The sinusoidal component of frequency kV
0
is known as the kth harmonic.
The kth Fourier coefficient, c
k
,is expressed as
c
k
1
T
0
T
0
xte
ÀjkV
0
t
dt: 4:1:2
This integral can be evaluated over any interval of length T
0
. For an odd function,it is
easier to integrate from 0 to T
0
. For an even function,integration from ÀT
0
=2toT
0
=2
is commonly used. The term with k 0 is referred to as the DC component because
c
0
1
T
0
T
0
xtdt equals the average value of x(t) over one period.
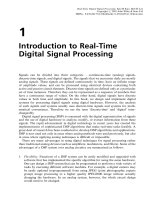
Example 4.1: The waveform of a rectangular pulse train shown in Figure 4.1 is a
periodic signal with period T
0
,and can be expressed as
xt
A, kT
0
À t=2 t kT
0
t=2
0,otherwise,
&
4:1:3
where k 0, Æ 1, Æ 2, FFF,and t < T
0
. Since x(t) is an even signal,it is con-
venient to select the integration from ÀT
0
=2toT
0
=2. From (4.1.2),we have
c
k
1
T
0
T
0
2
À
T
0
2
Ae
ÀjkV
0
t
dt
A
T
0
e
ÀjkV
0
t
ÀjkV
0
t
2
À
t
2
45
At
T
0
sin
kV
0
t
2
kV
0
t
2
: 4:1:4
This equation shows that c
k
has a maximum value At=T
0
at V
0
0,decays to 0 as
V
0
3ÆI,and equals 0 at frequencies that are multiples of p. Because the
periodic signal x(t) is an even function,the Fourier coefficients c
k
are real values.
For the rectangular pulse train with a fixed period T
0
,the effect of decreasing t is to
spread the signal power over the frequency range. On the other hand,when t is fixed but
the period T
0
increases,the spacing between adjacent spectral lines decreases.
t
x(t)
A
−
t
2
t
2
0
2
2
−T
0
−T
0
T
0
T
0
Figure 4.1 Rectangular pulse train
128
FREQUENCY ANALYSIS
A periodic signal has infinite energy and finite power,which is defined by Parseval's
theorem as
P
x
1
T
0
T
0
xt
2
dt
I
kÀI
c
k
2
: 4:1:5
Since c
k
jj
2
represents the power of the kth harmonic component of the signal,the total
power of the periodic signal is simply the sum of the powers of all harmonics.
The complex-valued Fourier coefficients, c
k
,can be expressed as
c
k
c
k
jje
jf
k
: 4:1:6
A plot of jc
k
j versus the frequency index k is called the amplitude (magnitude) spectrum,
and a plot of f
k
versus k is called the phase spectrum. If the periodic signal x(t) is real
valued,it is easy to show that c
0
is real valued and that c
k
and c
Àk
are complex
conjugates. That is,
c
k
c
Ã
Àk
, c
Àk
jj
c
k
jj
and f
Àk
Àf
k
: 4:1:7
Therefore the amplitude spectrum is an even function of frequency V,and the phase
spectrum is an odd function of V for a real-valued periodic signal.
If we plot jc
k
j
2
as a function of the discrete frequencies kV
0
,we can show that the
power of the periodic signal is distributed among the various frequency components.
This plot is called the power density spectrum of the periodic signal x(t). Since the power
in a periodic signal exists only at discrete values of frequencies kV
0
,the signal has a line
spectrum. The spacing between two consecutive spectral lines is equal to the funda-
mental frequency V
0
.
Example 4.2: Consider the output of an ideal oscillator as the perfect sinewave
expressed as
xtsin 2pf
0
t, f
0
V
0
2p
:
We can then calculate the Fourier series coefficients using Euler's formula
(Appendix A.3) as
sin2pf
0
t
1
2j
e
j2pf
0
t
À e
Àj2pf
0
t
ÀÁ
I
kÀI
c
k
e
jk2pf
0
t
:
We have
c
k
1=2j, k 1
À1=2j, k À1
0,otherwise.
V
`
X
4:1:8
FOURIER SERIES AND TRANSFORM
129
This equation indicates that there is no power in any of the harmonic k TÆ1.
Therefore Fourier series analysis is a useful tool for determining the quality
(purity) of a sinusoidal signal.
4.1.2 Fourier Transform
We have shown that a periodic signal has a line spectrum and that the spacing between
two consecutive spectral lines is equal to the fundamental frequency V
0
2p=T
0
. The
number of frequency components increases as T
0
is increased,whereas the envelope of
the magnitude of the spectral components remains the same. If we increase the period
without limit (i.e., T
0
3I),the line spacing tends toward 0. The discrete frequency
components converge into a continuum of frequency components whose magnitudes
have the same shape as the envelope of the discrete spectra. In other words,when the
period T
0
approaches infinity,the pulse train shown in Figure 4.1 reduces to a single
pulse,which is no longer periodic. Thus the signal becomes non-periodic and its
spectrum becomes continuous.
In real applications,most signals such as speech signals are not periodic. Consider the
signal that is not periodic (V
0
3 0orT
0
3I),the number of exponential components
in (4.1.1) tends toward infinity and the summation becomes integration over the entire
continuous range (ÀI,I. Thus (4.1.1) can be rewritten as
xt
1
2p
I
ÀI
XVe
jVt
dV: 4:1:9
This integral is called the inverse Fourier transform. Similarly,(4.1.2) can be rewritten
as
XV
I
ÀI
xte
ÀjVt
dt, 4:1:10
which is called the Fourier transform (FT) of x(t). Note that the time functions
are represented using lowercase letters,and the corresponding frequency functions are
denoted by using capital letters. A sufficient condition for a function x(t) that possesses
a Fourier transform is
I
ÀI
jxtjdt < I: 4:1:11
That is, x(t) is absolutely integrable.
Example 4.3: Calculate the Fourier transform of the function xte
Àat
ut,where
a > 0 and u(t) is the unit step function. From (4.1.10),we have
130
FREQUENCY ANALYSIS
XV
I
ÀI
e
Àat
ute
ÀjVt
dt
I
0
e
ÀajVt
dt
1
a jV
:
The Fourier transform XV is also called the spectrum of the analog signal x(t). The
spectrum XV is a complex-valued function of frequency V,and can be expressed as
XV
XV
e
jfV
, 4:1:12
where jXVj is the magnitude spectrum of x(t),and fV is the phase spectrum of x(t).
In the frequency domain, jXVj
2
reveals the distribution of energy with respect to the
frequency and is called the energy density spectrum of the signal. When x(t) is any finite
energy signal,its energy is
E
x
I
ÀI
jxtj
2
dt
1
2p
I
ÀI
jXVj
2
dV: 4:1:13
This is called Parseval's theorem for finite energy signals,which expresses the principle
of conservation of energy in time and frequency domains.
For a function x(t) defined over a finite interval T
0
,i.e.,xt0 for jtj > T
0
=2,the
Fourier series coefficients c
k
can be expressed in terms of XV using (4.1.2) and (4.1.10) as
c
k
1
T
0
XkV
0
: 4:1:14
For a given finite interval function,its Fourier transform at a set of equally spaced
points on the V-axis is specified exactly by the Fourier series coefficients. The distance
between adjacent points on the V-axis is 2p=T
0
radians.
If x(t) is a real-valued signal,we can show from (4.1.9) and (4.1.10) that
FT xÀt X
Ã
V and XÀVX
Ã
V:4:1:15
It follows that
jXÀVj jXVj and fÀVÀfV: 4:1:16
Therefore the amplitude spectrum jXVj is an even function of V,and the phase
spectrum is an odd function.
If the time signal x(t) is a delta function dt,its Fourier transform can be calculated as
XV
I
ÀI
dte
ÀjVt
dt 1: 4:1:17
FOURIER SERIES AND TRANSFORM
131
This indicates that the delta function has frequency components at all frequencies. In
fact,the narrower the time waveform,the greater the range of frequencies where the
signal has significant frequency components.
Some useful functions and their Fourier transforms are summarized in Table 4.1. We
may find the Fourier transforms of other functions using the Fourier transform proper-
ties listed in Table 4.2.
Table 4.1 Common Fourier transform pairs
Time function xt Fourier transform XV
dt 1
dt À t e
ÀjVt
12pdV
e
Àat
ut
1
a jV
e
jV
0
t
2pdV À V
0
sinV
0
t jpdV V
0
ÀdV À V
0
cosV
0
t pdV V
0
dV À V
0
sgnt
1, t ! 0
À1, t < 0
&
2
jV
Table 4.2 Useful properties of the Fourier transform
Time function xt Property Fourier transform XV
a
1
x
1
ta
2
x
2
t Linearity a
1
X
1
Va
2
X
2
V
dxt
dt
Differentiation in time
domain
jVXV
txt Differentiation in
frequency domain
j
dXV
dV
xÀt Time reversal XÀV
xt À a Time shifting e
ÀjVa
XV
xat Time scaling
1
jaj
X
V
a
xt sinV
0
t Modulation
1
2j
XV À V
0
ÀXV V
0
xt cosV
0
t Modulation
1
2
XV V
0
XV À V
0
e
Àat
xt Frequency shifting XV a
132
FREQUENCY ANALYSIS
Example 4.4: Find the Fourier transform of the time function
yte
Àajtj
, a > 0:
This equation can be written as
ytxÀtxt,
where
xte
Àat
ut, a > 0:
From Table 4.1,we have XV1=a jV. From Table 4.2,we have
YVXÀVXV. This results in
YV
1
a À jV
1
a jV
2a
a
2
V
2
:
4.2 The z-Transform
Continuous-time signals and systems are commonly analyzed using the Fourier trans-
form and the Laplace transform (will be introduced in Chapter 6). For discrete-time
systems,the transform corresponding to the Laplace transform is the z-transform. The
z-transform yields a frequency-domain description of discrete-time signals and systems,
and provides a powerful tool in the design and implementation of digital filters. In this
section,we will introduce the z-transform,discuss some important properties,and show
its importance in the analysis of linear time-invariant (LTI) systems.
4.2.1 Definitions and Basic Properties
The z-transform (ZT) of a digital signal, xn, ÀI< n < I,is defined as the power
series
Xz
I
nÀI
xnz
Àn
, 4:2:1
where Xz represents the z-transform of xn. The variable z is a complex variable,and
can be expressed in polar form as
z re
jy
, 4:2:2
where r is the magnitude (radius) of z,and y is the angle of z. When r 1, jzj1is
called the unit circle on the z-plane. Since the z-transform involves an infinite power
series,it exists only for those values of z where the power series defined in (4.2.1)
THE Z-TRANSFORM
133
converges. The region on the complex z-plane in which the power series converges is
called the region of convergence (ROC).
As discussed in Section 3.1,the signal xn encountered in most practical applications
is causal. For this type of signal,the two-sided z-transform defined in (4.2.1) becomes a
one-sided z-transform expressed as
Xz
I
n0
xnz
Àn
: 4:2:3
Clearly if xn is causal,the one-sided and two-sided z-transforms are equivalent.
Example 4.5: Consider the exponential function
xna
n
un:
The z-transform can be computed as
Xz
I
nÀI
a
n
z
Àn
un
I
n0
az
À1
n
:
Using the infinite geometric series given in Appendix A.2,we have
Xz
1
1 À az
À1
if jaz
À1
j < 1:
The equivalent condition for convergence (or ROC) is
jzj > jaj:
Thus we obtain Xz as
Xz
z
z À a
, jzj > jaj:
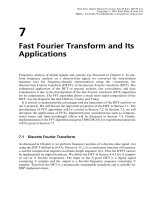
There is a zero at the origin z 0 and a pole at z a. The ROC and the pole±zero
plot are illustrated in Figure 4.2 for 0 < a < 1,where `Â' marks the position of the
pole and `o' denotes the position of the zero. The ROC is the region outside
the circle with radius a. Therefore the ROC is always bounded by a circle since the
convergence condition is on the magnitude jzj. A causal signal is characterized by
an ROC that is outside the maximum pole circle and does not contain any pole.
The properties of the z-transform are extremely useful for the analysis of discrete-time
LTI systems. These properties are summarized as follows:
1. Linearity (superposition). The z-transform is a linear transformation. Therefore the
z-transform of the sum of two sequences is the sum of the z-transforms of the
individual sequences. That is,
134
FREQUENCY ANALYSIS
|z| = a
|z| = 1
Re[z]
Im[z]
Figure 4.2 Pole,zero,and ROC (shaded area) on the z-plane
ZTa
1
x
1
na
2
x
2
n a
1
ZTx
1
n a
2
ZTx
2
n
a
1
X
1
za
2
X
2
z,
4:2:4
2. where a
1
and a
2
are constants,and X
1
z and X
2
z are the z-transforms of the
signals x
1
n and x
2
n,respectively. This linearity property can be generalized for
an arbitrary number of signals.
2. Time shifting. The z-transform of the shifted (delayed) signal ynxn À k is
YzZTxn À k z
Àk
Xz, 4:2:5
2. where the minus sign corresponds to a delay of k samples. This delay property states
that the effect of delaying a signal by k samples is equivalent to multiplying its
z-transform by a factor of z
Àk
. For example,ZTxn À 1 z
À1
Xz. Thus the unit
delay z
À1
in the z-domain corresponds to a time shift of one sampling period in the
time domain.
3. Convolution. Consider the signal
xnx
1
nÃx
2
n, 4:2:6
2. where à denotes the linear convolution introduced in Chapter 3,we have
XzX
1
zX
2
z: 4:2:7
2. Therefore the z-transform converts the convolution of two time-domain signals to
the multiplication of their corresponding z-transforms.
Some of the commonly used signals and their z-transforms are summarized in
Table 4.3.
THE Z-TRANSFORM
135
Table 4.3 Some common z-transform pairs
xn, n ! 0, c is constant Xz
c
cz
z À 1
cn
cz
z À 1
2
c
n
z
z À c
nc
n
cz
z À c
2
ce
Àan
cz
z À e
Àa
sin!
0
n
z sin!
0
z
2
À 2z cos!
0
1
cos!
0
n
zz À cos!
0
z
2
À 2z cos!
0
1
4.2.2 Inverse z-transform
The inverse z-transform can be expressed as
xnZT
À1
Xz
1
2pj
C
Xzz
nÀ1
dz, 4:2:8
where C denotes the closed contour in the ROC of Xz taken in a counterclockwise
direction. Several methods are available for finding the inverse z-transform. We will
discuss the three most commonly used methods ± long division,partial-fraction expan-
sion,and residue method.
Given the z-transform Xz of a causal sequence,it can be expanded into an infinite
series in z
À1
or z by long division. To use the long-division method,we express Xz as
the ratio of two polynomials such as
Xz
Bz
Az
LÀ1
l0
b
l
z
Àl
M
m0
a
m
z
Àm
, 4:2:9
where Az and Bz are expressed in either descending powers of z,or ascending powers
of z
À1
. Dividing Bz by Az obtains a series of negative powers of z if a positive-time
sequence is indicated by the ROC. If a negative-time function is indicated,we express
Xz as a series of positive powers of z. The method will not work for a sequence defined
136
FREQUENCY ANALYSIS
in both positive and negative time. In addition,it is difficult to obtain a closed-form
solution of the time-domain signal xn via the long-division method.
The long-division method can be performed recursively. That is,
xn b
n
À
n
m1
xn À ma
m
45D
a
0
, n 1,2, FFF 4:2:10
where
x0b
0
=a
0
: 4:2:11
This recursive equation can be implemented on a computer to obtain xn.
Example 4.6: Given
Xz
1 2z
À1
z
À2
1 À z
À1
0:3561z
À2
using the recursive equation given in (4.2.10),we have
x0b
0
=a
0
1,
x1b
1
À x0a
1
=a
0
3,
x2b
2
À x1a
1
À x0a
2
=a
0
3:6439,
FFF
This yields the time domain signal xnf1,3,3:6439, FFFg obtained from long
division.
The partial-fraction-expansion method factors the denominator of Xz if it is
not already in factored form,then expands Xz into a sum of simple partial fractions.
The inverse z-transform of each partial fraction is obtained from the z-transform
tables such as Table 4.3,and then added to give the overall inverse z-transform. In
many practical cases,the z-transform is given as a ratio of polynomials in z or z
À1
as
shown in (4.2.9). If the poles of Xz are of first order and M L À 1,then Xz can be
expanded as
Xzc
0
LÀ1
l1
c
l
1 À p
l
z
À1
c
0
LÀ1
l1
c
l
z
z À p
l
, 4:2:12
where p
l
are the distinct poles of Xz and c
l
are the partial-fraction coefficients. The
coefficient c
l
associated with the pole p
l
may be obtained with
c
l
Xz
z
z À p
l
zp
l
: 4:2:13
THE Z-TRANSFORM
137
If the order of the numerator B(z) is less than that of the denominator A(z) in (4.2.9),
that is L À 1 < M,then c
0
0. If L À 1 > M,then X(z) must be reduced first in order to
make L À 1 M by long division with the numerator and denominator polynomials
written in descending power of z
À1
.
Example 4.7: For the z-transform
Xz
z
À1
1 À 0:25z
À1
À 0:375z
À2
we can first express X(z) in positive powers of z,expressed as
Xz
z
z
2
À 0:25z À 0:375
z
z À 0:75z 0:5
c
1
z
z À 0:75
c
2
z
z 0:5
:
The two coefficients are obtained by (4.2.13) as follows:
c
1
Xz
z
z À 0:75
z0:75
1
z 0:5
z0:75
0:8
and
c
2
1
z À 0:75
zÀ0:5
À0:8:
Thus we have
Xz
0:8z
z À 0:75
À
0:8z
z 0:5
:
The overall inverse z-transform x(n) is the sum of the two inverse z-transforms.
From entry 3 of Table 4.3,we obtain
xn0:80:75
n
ÀÀ0:5
n
, n ! 0:
The MATLAB function residuez finds the residues,poles and direct terms of the
partial-fraction expansion of Bz=Az given in (4.2.9). Assuming that the numerator
and denominator polynomials are in ascending powers of z
À1
,the function
[c, p, g ]= residuez(b, a);
finds the partial-fraction expansion coefficients, c
l
,and the poles,p
l
,in the returned
vectors c and p,respectively. The vector g contains the direct (or polynomial) terms of
the rational function in z
À1
if L À 1 ! M. The vectors b and a represent the coefficients
of polynomials B(z) and A(z),respectively.
If X(z) contains one or more multiple-order poles,the partial-fraction expansion must
include extra terms of the form
m
j1
g
j
zÀp
l
j
for an mth order pole at z p
l
. The
coefficients g
j
may be obtained with
138
FREQUENCY ANALYSIS
g
j
1
m À j3
d
mÀj
dz
mÀj
z À p
l
m
Xz
z
!
zp
l
: 4:2:14
Example 4.8: Consider the function
Xz
z
2
z
z À 1
2
:
We first express X(z)as
Xz
g
1
z À 1
g
2
z À 1
2
:
From (4.2.14),we have
g
1
d
dz
z À 1
2
Xz
z
45
z1
d
dz
z 1
z1
1,
g
2
z À 1
2
Xz
z
z1
z 1j
z1
2:
Thus
Xz
z
z À 1
2z
z À 1
2
:
From Table 4.3,we obtain
xnZT
À1
z
z À 1
hi
ZT
À1
2z
z À 1
2
45
1 2n, n ! 0:
The residue method is based on Cauchy's integral theorem expressed as
1
2pj
c
z
kÀmÀ1
dz
1ifk m
0ifk T m.
&
4:2:15
Thus the inversion integral in (4.2.8) can be easily evaluated using Cauchy's residue
theorem expressed as
xn
1
2pj
c
Xzz
nÀ1
dz
residues of Xzz
nÀ1
at poles of Xzz
nÀ1
within C:
4:2:16
THE Z-TRANSFORM
139
The residue of Xzz
nÀ1
at a given pole at z p
l
can be calculated using the formula
R
zp
l
d
mÀ1
dz
mÀ1
z À p
l
m
m À 13
Xzz
nÀ1
!
zp
l
, m ! 1, 4:2:17
where m is the order of the pole at z p
l
. For a simple pole,Equation (4.2.17) reduces to
R
zp
l
z À p
l
Xzz
nÀ1
À
zp
l
: 4:2:18
Example 4.9: Given the following z-transform function:
Xz
1
z À 1z À 0:5
,
we have
Xzz
nÀ1
z
nÀ1
z À 1z À 0:5
:
This function has a simple pole at z 0 when n 0,and no pole at z 0 for
n ! 1. For the case n 0,
Xzz
nÀ1
1
zz À 1z À 0:5
:
The residue theorem gives
xnR
z0
R
z1
R
z0:5
zXzz
nÀ1
À
z0
z À 1Xzz
nÀ1
z1
z À 0:5Xzz
nÀ1
À
z0:5
2 2 À40:
For the case that n ! 1,the residue theorem is applied to obtain
xnR
z1
R
z0:5
z À 1Xzz
nÀ1
z1
z À 0:5Xzz
nÀ1
z0:5
2 À 20:5
nÀ1
21À0:5
nÀ1
hi
, n ! 1:
We have discussed three methods for obtaining the inverse z-transform. A limitation
of the long-division method is that it does not lead to a closed-form solution. However,
it is simple and lends itself to software implementation. Because of its recursive nature,
care should be taken to minimize possible accumulation of numerical errors when the
number of data points in the inverse z-transform is large. Both the partial-fraction-
expansion and the residue methods lead to closed-form solutions. The main disadvan-
tage with both methods is the need to factor the denominator polynomial,which is done
by finding the poles of X(z). If the order of X(z) is high,finding the poles of X(z) may be
140
FREQUENCY ANALYSIS
a difficult task. Both methods may also involve high-order differentiation if X(z)
contains multiple-order poles. The partial-fraction-expansion method is useful in gen-
erating the coefficients of parallel structures for digital filters. Another application of z-
transforms and inverse z-transforms is to solve linear difference equations with constant
coefficients.
4.3 Systems Concepts
As mentioned earlier,the z-transform is a powerful tool in analyzing digital systems. In
this section,we introduce several techniques for describing and characterizing digital
systems.
4.3.1 Transfer Functions
Consider the discrete-time LTI system illustrated in Figure 3.8. The system output is
computed by the convolution sum defined as ynxnÃhn. Using the convolution
property and letting ZTxn Xz and ZT yn Yz,we have
YzXzHz, 4:3:1
where HzZThn is the z-transform of the impulse response of the system. The
frequency-domain representation of LTI system is illustrated in Figure 4.3.
The transfer (system) function H(z) of an LTI system may be expressed in terms of the
system's input and output. From (4.3.1),we have
Hz
Yz
Xz
ZThn
I
nÀI
hnz
Àn
: 4:3:2
Therefore the transfer function of the LTI system is the rational function of two
polynomials Y(z) and X(z). If the input x(n) is the unit impulse dn,the z-transform
of such an input is unity (i.e., Xz1),and the corresponding output YzHz.
One of the main applications of the z-transform in filter design is that the z-transform
can be used in creating alternative filters that have exactly the same input±output
behavior. An important example is the cascade or parallel connection of two or more
x(n) y(n) = x(n)∗h(n)h(n)
Y(z) = X(z)H(z)
X(z) H(z)
ZT
−1
ZT ZT
Figure 4.3 A block diagram of LTI system in both time-domain and z-domain
SYSTEMS CONCEPTS
141
systems,as illustrated in Figure 4.4. In the cascade (series) interconnection,the output
of the first system, y
1
n,is the input of the second system,and the output of the second
system, y(n),is the overall system output. From Figure 4.4(a),we have
Y
1
zXzH
1
z and YzY
1
zH
2
z:
Thus
YzXzH
1
zH
2
z:
Therefore the overall transfer function of the cascade of the two systems is
Hz
Yz
Xz
H
1
zH
2
z: 4:3:3
Since multiplication is commutative, H
1
zH
2
zH
2
zH
1
z,the two systems can be
cascaded in either order to obtain the same overall system response. The overall impulse
response of the system is
hnh
1
nÃh
2
nh
2
nÃh
1
n: 4:3:4
Similarly,the overall impulse response and the transfer function of the parallel
connection of two LTI systems shown in Figure 4.4(b) are given by
hnh
1
nh
2
n4:3:5
and
HzH
1
zH
2
z: 4:3:6
x(n)
x(n)
H
1
(z)
H
1
(z)
H(z)
H(z)
H
2
(z)
H
2
(z)
y
1
(n)
X(z)
y(n)
y(n)
Y(z)
Y
1
(z)
y
1
(n)
y
2
(n)
(a)
(b)
Figure 4.4 Interconnect of digital systems: (a) cascade form,and (b) parallel form
142
FREQUENCY ANALYSIS
If we can multiply several z-transforms to get a higher-order system,we can also
factor z-transform polynomials to break down a large system into smaller sections.
Since a cascading system is equivalent to multiplying each individual system transfer
function,the factors of a higher-order polynomial,H(z),would represent component
systems that make up H(z) in a cascade connection. The concept of parallel and
cascade implementation will be further discussed in the realization of IIR filters in
Chapter 6.
Example 4.10: The following LTI system has the transfer function:
Hz1 À 2z
À1
z
À3
:
This transfer function can be factored as
Hz 1 À z
À1
ÀÁ
1 À z
À1
À z
À2
ÀÁ
H
1
zH
2
z:
Thus the overall system H(z) can be realized as the cascade of the first-order
system H
1
z1 À z
À1
and the second-order system H
2
z1 À z
À1
À z
À2
.
4.3.2 Digital Filters
The general I/O difference equation of an FIR filter is given in (3.1.16). Taking the
z-transform of both sides,we have
Yzb
0
Xzb
1
z
À1
XzÁÁÁb
LÀ1
z
ÀLÀ1
Xz
b
0
b
1
z
À1
ÁÁÁb
LÀ1
z
ÀLÀ1
hi
Xz: 4:3:7
Therefore the transfer function of the FIR filter is expressed as
Hz
Yz
Xz
b
0
b
1
z
À1
ÁÁÁb
LÀ1
z
ÀLÀ1
LÀ1
l0
b
l
z
À1
: 4:3:8
The signal-flow diagram of the FIR filter is shown in Figure 3.6. FIR filters can be
implemented using the I/O difference equation given in (3.1.16),the transfer function
defined in (4.3.8),or the signal-flow diagram illustrated in Figure 3.6.
Similarly,taking the z-transform of both sides of the IIR filter defined in (3.2.18)
yields
Yzb
0
Xzb
1
z
À1
XzÁÁÁ b
LÀ1
z
ÀL1
XzÀa
1
z
À1
YzÀÁÁÁ Àa
M
z
ÀM
Yz
LÀ1
l0
b
l
z
Àl
23
XzÀ
M
m1
a
m
z
Àm
23
Yz: 4:3:9
SYSTEMS CONCEPTS
143
By rearranging the terms,we can derive the transfer function of an IIR filter as
Hz
Yz
Xz
LÀ1
l0
b
l
z
Àl
1
M
m1
a
m
z
Àm
Bz
1 Az
, 4:3:10
where Bz
LÀ1
l0
b
l
z
Àl
and Az
M
m1
a
m
z
Àm
. Note that if all a
m
0,the IIR filter
given in (4.3.10) is equivalent to the FIR filter described in (4.3.8).
The block diagram of the IIR filter defined in (4.3.10) can be illustrated in Figure
4.5,where Az and Bz are the FIR filters as shown in Figure 3.6. The numerator
coefficients b
l
and the denominator coefficients a
m
are referred to as the feedforward
and feedback coefficients of the IIR filter defined in (4.3.10). A more detailed signal-
flow diagram of an IIR filter is illustrated in Figure 4.6 assuming that M L À 1. IIR
filters can be implemented using the I/O difference equation expressed in (3.2.18),the
transfer function given in (4.3.10),or the signal-flow diagram shown in Figure 4.6.
4.3.3 Poles and Zeros
Factoring the numerator and denominator polynomials of H(z),Equation (4.3.10) can
be further expressed as the rational function
x(n) y(n)
y(n−1)
B(z)
A(z)
z
−1
Figure 4.5 IIR filter H(z) consists of two FIR filters A(z) and B(z)
b
0
x(n) y(n)
− a
1
− a
2
− a
M
y(n−M)
y(n−2)
y(n−1)
z
−1
z
−1
b
1
b
2
b
L−1
x(n−L+1)
z
−1
z
−1
Figure 4.6 Detailed signal-flow diagram of IIR filter
144
FREQUENCY ANALYSIS
Hz
b
0
a
0
z
MÀL1
LÀ1
l1
z À z
l
M
m1
z À p
m
, 4:3:11
where a
0
1. Without loss of generality,we let M L À 1 in (4.3.11) in order to obtain
Hzb
0
M
l1
z À z
l
M
m1
z À p
m
b
0
z À z
1
z À z
2
ÁÁÁz À z
M
z À p
1
z À p
2
ÁÁÁz À p
M
: 4:3:12
The roots of the numerator polynomial are called the zeros of the transfer function H(z).
In other words,the zeros of H(z) are the values of z for which Hz0,i.e.,Bz0.
Thus H(z) given in (4.3.12) has M zeros at z z
1
, z
2
, FFF, z
M
. The roots of the denom-
inator polynomial are called the poles,and there are M poles at z p
1
, p
2
, FFF, p
M
. The
poles of H(z) are the values of z such that HzI. The LTI system described in
(4.3.12) is a pole±zero system,while the system described in (4.3.8) is an all-zero system.
The poles and zeros of H(z) may be real or complex,and some poles and zeros may be
identical. When they are complex,they occur in complex-conjugate pairs to ensure that
the coefficients a
m
and b
l
are real.
Example 4.11: Consider the simple moving-average filter given in (3.2.1). Taking
the z-transform of both sides,we have
Yz
1
L
LÀ1
l0
z
Àl
Xz:
Using the geometric series defined in Appendix A.2,the transfer function of the
filter can be expressed as
Hz
Yz
Xz
1
L
LÀ1
l0
z
Àl
1
L
1 À z
ÀL
1 À z
À1
!
: 4:3:13
This equation can be rearranged as
Yzz
À1
Yz
1
L
XzÀz
ÀL
Xz
ÂÃ
:
Taking the inverse z-transform of both sides and rearranging terms,we obtain
ynyn À 1
1
L
xnÀxn À L:
This is an effective way of deriving (3.2.2) from (3.2.1).
SYSTEMS CONCEPTS
145
The roots of the numerator polynomial z
L
À 1 0 determine the zeros of H(z)
defined in (4.3.13). Using the complex arithmetic given in Appendix A.3,we have
z
k
e
j2p=Lk
, k 0,1, FFF, L À 1: 4:3:14
Therefore there are L zeros on the unit circle jzj1. Similarly,the poles of H(z) are
determined by the roots of the denominator z
LÀ1
z À 1. Thus there are L À 1 poles at
the origin z 0 and one pole at z 1. A pole±zero diagram of H(z) given in (4.3.13) for
L 8 on the complex plane is illustrated in Figure 4.7. The pole±zero diagram provides
an insight into the properties of a given LTI system.
Describing the z-transform H(z) in terms of its poles and zeros will require finding the
roots of the denominator and numerator polynomials. For higher-order polynomials,
finding the roots is a difficult task. To find poles and zeros of a rational function H(z),
we can use the MATLAB function roots on both the numerator and denominator
polynomials. Another useful MATLAB function for analyzing transfer function is
zplane(b, a),which displays the pole±zero diagram of H(z).
Example 4.12: Consider the IIR filter with the transfer function
Hz
1
1 À z
À1
0:9z
À2
:
We can plot the pole±zero diagram using the following MATLAB script:
b [1];a [1, À1, 0.9];
zplane(b, a);
Similarly,we can plot Figure 4.7 using the following MATLAB script:
b [1, 0, 0, 0, 0, 0, 0, 0, 1];a [1, À1];
zplane(b, a);
As shown in Figure 4.7,the system has a single pole at z 1,which is at the same
location as one of the eight zeros. This pole is canceled by the zero at z 1. In this case,
the pole±zero cancellation occurs in the system transfer function itself. Since the system
Re[z]
Im[z]
|z|=1
Zero
Pole
Figure 4.7 Pole±zero diagram of the moving-averaging filter, L 8
146
FREQUENCY ANALYSIS
output YzXzHz,the pole±zero cancelation may occur in the product of system
transfer function H(z) with the z-transform of the input signal Xz. By proper selection
of the zeros of the system transfer function,it is possible to suppress one or more poles of
the input signal from the output of the system,or vice versa. When the zero is located
very close to the pole but not exactly at the same location to cancel the pole,the system
response has a very small amplitude.
The portion of the output yn that is due to the poles of Xz is called the forced
response of the system. The portion of the output that is due to the poles of H(z)is
called the natural response. If a system has all its poles within the unit circle,then its
natural response dies down as n 3I,and this is referred to as the transient response. If
the input to such a system is a periodic signal,then the corresponding forced response is
called the steady-state response.
Consider the recursive power estimator given in (3.2.11) as an LTI system H(z)with
input wnx
2
n and output yn
P
x
n. As illustrated in Figure 4.8,Equation
(3.2.11) can be rewritten as
yn1 À ayn À 1awn:
Taking the z-transform of both sides,we obtain the transfer function that describes this
efficient power estimator as
Hz
Yz
Wz
a
1 À1 À az
À1
: 4:3:15
This is a simple first-order IIR filter with a zero at the origin and a pole at z 1 À a.A
pole±zero plot of H(z) given in (4.3.15) is illustrated in Figure 4.9. Note that a 1=L
results in 1 À a L À 1=L,which is slightly less than 1. When L is large,i.e.,a longer
window,the pole is closer to the unit circle.
x(n)
(
•
)
2
w(n) = x
2
(n)
H(z)
y(n) = P
x
(n)
ˆ
Figure 4.8 Block diagram of recursive power estimator
Re[z]
Im[z]
|z| = 1
Zero
Pole
Figure 4.9 Pole±zero diagram of the recursive power estimator
SYSTEMS CONCEPTS
147
An LTI system Hz is stable if and only if all the poles are inside the unit circle. That is,
jp
m
j < 1 for all m: 4:3:16
In this case,lim
n3I
fhng 0. In other words,an LTI system is stable if and only if the
unit circle is inside the ROC of H(z).
Example 4.13: Given an LTI system with transfer function
Hz
z
z À a
:
There is a pole at z a. From Table 4.3,we show that
hna
n
, n ! 0:
When jaj > 1,i.e.,the pole at z a is outside the unit circle,we have
lim
n3I
hn3I:
that is an unstable system. However,when jaj < 1,the pole is inside the unit circle,
we have
lim
n3I
hn30,
which is a stable system.
The power estimator described in (4.3.15) is stable since the pole at 1 À a
L À 1=L < 1 is inside the unit circle. A system is unstable if Hz has pole(s) outside
the unit circle or multiple-order pole(s) on the unit circle. For example,if Hz
z=z À 1
2
,then hnn,which is unstable. A system is marginally stable,or oscilla-
tory bounded,if H(z) has first-order pole(s) that lie on the unit circle. For example,if
Hzz=z 1,then hnÀ1
n
, n ! 0.
4.3.4 Frequency Responses
The frequency response of a digital system can be readily obtained from its transfer
function. If we set z e
j!
in H(z),we have
Hz
z e
j!
I
nÀI
hnz
Àn
z e
j!
I
nÀI
hne
Àj!n
H!: 4:3:17
Thus the frequency response of the system is obtained by evaluating the transfer
function on the unit circle jzjje
j!
j1. As summarized in Table 3.1,the digital
frequency ! 2pf =f
s
is in the range Àp ! p.
The characteristics of the system can be described using the frequency response of the
frequency !. In general, H! is a complex-valued function. It can be expressed in polar
form as
148
FREQUENCY ANALYSIS
H!jH!je
jf!
, 4:3:18
where jH!j is the magnitude (or amplitude) response and f! is the phase shift
(phase response) of the system at frequency !. The magnitude response jH!j is an
even function of !,and the phase response f! is an odd function of !. We only need
to know that these two functions are in the frequency region 0 ! p. The quantity
jH!j
2
is referred to as the squared-magnitude response. The value of jH!
0
j for a
given H! is called the system gain at frequency !
0
.
Example 4.14: The simple moving-average filter expressed as
yn
1
2
xnxn À 1, n ! 0
is a first-order FIR filter. Taking the z-transform of both sides and re-arranging
the terms,we obtain
Hz
1
2
1 z
À1
ÀÁ
:
From (4.3.17),we have
H!
1
2
1 e
Àj!
ÀÁ
1
2
1 cos ! À j sin !,
jH!j
2
fReH!g
2
fImH!g
2
1
2
1 cos !,
f!tan
À1
ImH!
ReH!
&'
tan
À1
À sin !
1 cos !
:
From Appendix A.1,we have
sin ! 2 sin
!
2
cos
!
2
and cos ! 2 cos
2
!
2
À 1:
Therefore the phase response is
f!tan
À1
À tan
!
2
hi
À
!
2
:
As discussed earlier,MATLAB is an excellent tool for analyzing signals in the
frequency domain. For a given transfer function, H(z),expressed in a general form in
(4.3.10),the frequency response can be analyzed with the MATLAB function
[H, w ] freqz(b, a, N);
which returns the N-point frequency vector w and the N-point complex frequency
response vector H,given its numerator and denominator coefficients in vectors b and
a,respectively.
SYSTEMS CONCEPTS
149
Example 4.15: Consider the difference equation of IIR filter defined as
ynxnyn À 1À0:9yn À 2: 4:3:19a
This is equivalent to the IIR filter with the transfer function
Hz
1
1 À z
À1
0:9z
À2
: 4:3:19b
The MATLAB script to analyze the magnitude and phase responses of this IIR
filter is listed (exam 4_15.m in the software package) as follows:
b [1];a [1, À1, 0.9];
[H, w ] freqz(b, a, 128);
magH abs(H); angH angle(H);
subplot(2, 1, 1), plot(magH), subplot(2, 1, 2), plot(angH);
The MATLAB function abs(H)returns the absolute value of the elements of H
and angle(H)returns the phase angles in radians.
A simple,but useful,method of obtaining the brief frequency response of an LTI
system is based on the geometric evaluation of its pole±zero diagram. For example,
consider a second-order IIR filter expressed as
Hz
b
0
b
1
z
À1
b
2
z
À2
1 a
1
z
À1
a
2
z
À2
b
0
z
2
b
1
z b
2
z
2
a
1
z a
2
: 4:3:20
The roots of the characteristic equation
z
2
a
1
z a
2
0 4:3:21
are the poles of the filter,which may be either real or complex. For complex poles,
p
1
re
jy
and p
2
re
Àjy
, 4:3:22
where r is radius of the pole and y is the angle of the pole. Therefore Equation (4.3.20)
becomes
z À re
jy
ÀÁ
z À re
Àjy
ÀÁ
z
2
À 2r cos y r
2
0: 4:3:23
Comparing this equation with (4.3.21),we have
r
a
2
p
and y cos
À1
Àa
1
=2r: 4:3:24
The filter behaves as a digital resonator for r close to unity. The system with a pair of
complex-conjugated poles as given in (4.3.22) is illustrated in Figure 4.10.
150
FREQUENCY ANALYSIS
r
r
q
q
Im[z]
Re[z]
|z| = 1
Figure 4.10 A second-order IIR filter with complex-conjugated poles
Re[z]
Im[z]
z = e
jw
z = −1
p
1
p
2
V
2
V
1
U
1
U
2
z
1
z
2
Figure 4.11 Geometric evaluation of the magnitude response from the pole±zero diagram
Similarly,we can obtain two zeros,z
1
and z
2
,by evaluating b
0
z
2
b
1
z b
2
0. Thus
the transfer function defined in (4.3.20) can be expressed as
Hz
b
0
z À z
1
z À z
2
z À p
1
z À p
2
: 4:3:25
In this case,the frequency response is given by
H!
b
0
e
j!
À z
1
e
j!
À z
2
e
j!
À p
1
e
j!
À p
2
: 4:3:26
Assuming that b
0
1,the magnitude response of the system can be shown as
jH!j
U
1
U
2
V
1
V
2
, 4:3:27
where U
1
and U
2
represent the distances from the zeros z
1
and z
2
to the point z e
j!
,
and V
1
and V
2
are the distances of the poles p
1
and p
2
,to the same point as illustrated in
Figure 4.11. The complete magnitude response can be obtained by evaluating jH!j as
the point z moves from z 0toz À1 on the unit circle. As the point z moves closer to
the pole p
1
,the length of the vector V
1
decreases,and the magnitude response increases.
SYSTEMS CONCEPTS
151