Tài liệu Phần mềm xác định radio P2 docx
Bạn đang xem bản rút gọn của tài liệu. Xem và tải ngay bản đầy đủ của tài liệu tại đây (593.33 KB, 55 trang )
Part II
Front End Technology
Front End design – including RF Architecture, Data Conversion and Digital Front Ends – has
emerged as a key issue as SDR techniques are finding themselves increasingly embodied by
stealth into today’s new products.
The radical solution – ‘Pure’ Software Radio, with A/D conversion at the antenna – is not
yet feasible at GHz carrier frequencies. However, recent technology advances suggest it may
be nearer than had been thought.
Software Defined Radio
Edited by Walter Tuttlebee
Copyright q 2002 John Wiley & Sons, Ltd
ISBNs: 0-470-84318-7 (Hardback); 0-470-84600-3 (Electronic)
2
Radio Frequency Translation for
Software Defined Radios
Mark Beach, John MacLeod, Paul Warr
University of Bristol
In an ideal world, a software defined radio (SDR) would be able to transmit and receive
signals of any frequency, power level, bandwidth, and modulation technique. Current analog
receiver and transmitter hardware sections are still a long way from being able to achieve this
ideal behavior. It is the aim of this chapter to explain why this is the case, to present some
design techniques for synthesis of SDR RF translation architectures, and to consider where
the breakthroughs in technology are required if the RF hardware component of the ideal
SDR
1
is to become a reality.
This chapter is structured in four parts. Initially, we gather data to define the requirements
for the illustrative design of SDR hardware for commercial wireless applications. In the
second part, we attempt to define the problems that are associated with the design of SDR
hardware, both the receiver and the transmitter aspects. In the third, we consider techniques
which may be of value in solving these problems before finally drawing some conclusions.
In considering these requirements, the chapter is based around the proposition that our
SDR must be able to process the major European air interface standards. The performance
requirements that these standards demand are then surveyed.
Basic receiver design is considered by looking first at the architectural issues. The pros and
cons of single and multiple conversion architectures are then discussed. The important issue
of circuit linearity, and its relationship with blocker specifications, is examined. Alternative
specifications for radio linearity are defined, and the reason for their use is briefly explained.
‘Signal budget,’ as a basis for the receiver design, is discussed. An example is given to show
how performance specifications relate to this budget, and the consequent performance speci-
fication of individual circuit elements. Image signals and the problems they cause in the
1
The term ‘ideal SDR’ used in this chapter should not be confused with the concept of the ‘pure’ software radio.
The latter refers to a software radio with A/D conversion at the carrier frequency; the former refers to a fully flexible
and dynamically reconfigurable ‘pragmatic’ software radio, still incorporating radio frequency translation stages
prior to the A/D converter and digital processing subsystem.
Software Defined Radio
Edited by Walter Tuttlebee
Copyright q 2002 John Wiley & Sons, Ltd
ISBNs: 0-470-84318-7 (Hardback); 0-470-84600-3 (Electronic)
design of a superheterodyne SDR receiver are then covered. The relationship of the image
signal to the IF frequency, as well as the relationship of the required image rejection to the
receiver blocker specifications, is also explained.
The design of an SDR transmitter is introduced by explaining that the filter problems
within a receiver mirror their analogs within the SDR transmitter. Transmitter architectures
are examined, and similar conclusions are drawn about their architectures as were drawn
about the receiver. Transmitter linearity and the related efficiency issues are highlighted and
techniques of PA linearization briefly summarized. The zero IF stage is examined compre-
hensively, including a detailed description of the specific issues which arise from this archi-
tecture. Flexible filtering is then discussed and a brief summary of the ways in which it could
be realized, or has been realized, is presented. Emphasis is placed on ensuring that the tuning
does not introduce nonlinearities into the circuit performance and an introduction is presented
into the potential role that micro-electro-mechanical system (MEMS) technology could play
in future designs.
The body of the chapter concludes with an examination of the ‘Low IF’ design as a possible
compromise between the superheterodyne and zero IF architectures.
2.1 Requirements and Specifications
There are three driving forces for the development of SDR. The first impetus derives from the
requirement that a mobile phone can provide ‘world roaming.’ This means that the phone, as
well as being able to operate in Europe to the GSM radio standard, should be able to operate
in the United States to their IS54 and IS95 systems, and in Asia and Japan with their PDC and
PHS systems. The second stimulus revolves around trying to combine the performance
features of a radiotelephone (GSM, DECT, and UMTS), with the functionality of a personal
area network (PAN), (e.g. Bluetooth), and that of a local area Network (LAN) (e.g. HIPER-
LAN). The third motivation is that SDR could drive down the production costs through the
scale economies of a single radio platform for multiple standards and hence markets.
Improvements could be made via ‘software upgrades’ and the radio could be ‘future proofed’
to some degree.
In this section we review the radio specifications of some of the major European commu-
nications standards to define the performance that will be required of an SDR capable of
encompassing all these air interface standards. It would be possible to spread the net wider
and also embrace North American and Asian standards; however, the European standards are
sufficiently representative to highlight all the major issues involved. [1–8]
2
2.1.1 Transmitter Specifications
The most important design parameters when dealing with SDR transmitter design are:
X
output power level
X
power control range
X
spurious emissions
Software Defined Radio: Enabling Technologies26
2
These standards embrace standard voice telephony (GSM and DECT), 3G standards (UMTS), personal area
networks (Bluetooth), and local area networks (HIPERLAN/2).
Frequency of operation is also the other obvious parameter – this is discussed following the
separate transmitter and receiver specification discussions, with requirements summarized
later in Figure 2.2.
2.1.1.1 Transmitter Output Power Levels
The power levels to be provided by a mobile station depend on the standard and on its class.
In all cases, the transmitter should provide output power control over a significant range to
comparatively fine tolerances. This will impose critical challenges on the architecture used.
Table 2.1 summarizes this information.
2.1.1.2 Spurious Emission Specifications
All air interface standards specify spurious emission with a mask specification. They are
best summarized graphically. A graphical summary of all ‘in-band’ spurious emission
specifications is included in Appendix A1 to this chapter. Out-of-band emissions are also
specified in the relevant standards. For information on these the reader is referred to
references [1–8].
2.1.2 Receiver Specifications
The most important design parameters when dealing with SDR receiver design are:
X
input sensitivity
X
maximum expected input signal
X
blocker specifications
2.1.2.1 Input Sensitivity and Maximum Input Level
Table 2.2 summarizes the sensitivity requirements of our target group of air interface stan-
dards.
2.1.2.2 Blocker Specifications
All air interface standards specify blocker signal levels with a mask type of specification.
Again, this is best summarized graphically and is included as Appendix A2 to this chapter.
2.1.3 Operating Frequency Bands
Table 2.3 lists the frequency bands for the air interface standards considered in this chapter;
this information is also shown graphically in Figure 2.1.
Radio Frequency Translation for Software Defined Radios 27
Software Defined Radio: Enabling Technologies28
Table 2.1 Transmitter power output and power control specifications
Air-interface standard Nominal maximum output power Nominal minimum
output power (dBm)
Power control
Terminal class Maximum power (dBm) Levels Power range (dBm) Step
GSM 900 2 39 5 0–239
337 3–15 37–13 2 dB
433 16–18 11–72dB
529 19–31 5
DCS 1800 1 30 0 29 36
224 30–31 34–32 2 dB
336 0–830–14 2 dB
9–13 12 – 42dB
14 2
15–28 0
Nominal output power
Level Power (dBm)
DECT 1 4
224
UMTS-FDD 1 33 2 44 Steps
227 1
324 2
421 3
UMTS-TDD 2 24 2 44
321
Bluetooth 1 20 1 4 P
min
,24 P
min
to P
max
24 2 6 P
min
,230 P
min
to P
max
30 – P
min
,230 P
min
to P
max
Band (MHz) Power (dBm)
HIPERLAN/2 5150–5350 23 EIRP
5470–5725 30 EIRP
2.2 Receiver Design Considerations
2.2.1 Basic Considerations
The basic receiver function is to take a real, low power, RF signal and down-convert it to a
complex (in-phase and quadrature, I/Q) baseband signal. During this process, the signal
power level is increased. The following list describes the characteristics of the input signal
to a hypothetical SDR receiver and the output signal from that receiver.
The characteristics of the input signal are:
X
signal type real
X
low power down to –107 dBm
X
high dynamic range up to 2 15 dBm
X
spectrum band pass, with center frequencies varying from
876 MHz to 5725 MHz
Radio Frequency Translation for Software Defined Radios 29
Table 2.2 Input signal level specifications
Air interface standard Reference
sensitivity level
(dBm)
Maximum input level (dBm)
GSM 900 Small MS 2 102 2 15
Other MS 2 104
DCS 1800 Class 1 or Class 2 2 100/ 2 102 2 23
Class 3 2 102
PCS 1900 Normal 2 102 2 23
Other 2 104
DECT 2 86 2 33
UMTS (FDD) 12.2 kbps 2 92
64 kbps 2 99.2
144 kbps 2 102.7
384 kbps 2 107
UMTS (TDD) 2 105
Bluetooth 2 70 2 20
HIPERLAN/2 6 Mbps 2 85 Receiver class 1 ¼ 2 20
9 Mbps 2 83 Receiver class 2 ¼ 2 30
12 Mbps 2 81
18 Mbps 2 79
27 Mbps 2 75
36 Mbps 2 73
54 Mbps 2 68
Worst case parameter 2 107 2 15
The characteristics of the output signal (to a digital subsystem) are:
X
signal type complex (I/Q)
X
spectrum baseband, with bandwidth up to 20 MHz
X
dynamic range reduced by AGC to meet requirements of the ADC
In doing this, the receiver must
X
keep the signal power sufficiently greater than the noise power, to ensure the output
signal-to-noise ratio is sufficiently high to allow appropriate BER performance of the
modulation scheme used;
X
ensure that high power input signals do not overload components of the receiver;
X
ensure that high power nearby signals (blockers) do not effect detection of the wanted
signal;
X
ensure that signals of the wanted frequency can be separated from signals at the image
3
frequency.
The first two points on this list are generally accommodated by careful design. The latter two
points are problems that can be tackled by selection of an appropriate architecture and
Software Defined Radio: Enabling Technologies30
3
Image signals are discussed further under ‘Image Rejection’ within this section on receiver design.
Table 2.3 Frequency of operation of major European air interface standards
Air interface standard Uplink (MHz) Downlink (MHz) Duplex spacing
(MHz)
GSM 900 890–915 935–960 45
E-GSM 900 880–915 925–960 45
R-GSM 900 876–915 921–960 45
DCS 1800 1710–1785 1805–1880 95
PCS 1900 1850–1910 1930–1990 80
DECT 1881.792–1897.344 1881.792–1897.344 Not applicable
– a TDD system
UMTS FDD (Europe) 1920–1980 2110–2170 190
UMTS FDD (CDMA 2000) 1850–1910 1930–1990 80
UMTS TDD 1900–1920 1900–1920 –
(Europe) 2010–2025 2010–2025
UMTS TDD (CDMA 2000) 1850–1910 1850–1910 –
1930–1990 1930–1990
1910–1930 1910–1930
Bluetooth USA, Europe, &
most other countries
2400–2483.5 2400–2483.5 –
Spain 2455–2475 2455–2475 –
France 2446.5–2435 2446.5–2435 –
HIPERLAN\2 5150–5350 5150–5350
5470–5725 5470–5725 –
application of appropriate technological ‘fixes’ such as image reject mixing, linearization,
and variable preselect filters.
Important commercial requirements, which place constraints on this, are:
X
ability to be manufactured as an integrated circuit, with a minimum of external compo-
nents;
X
low power consumption to allow portable operation with long battery life.
The next section discusses the comparative advantage of various receiver architectures;
subsequent sections describe important considerations in practical receiver design.
Radio Frequency Translation for Software Defined Radios 31
Figure 2.1 Diagrammatic representation of the operating frequencies of the major European air
interface standards (excluding HIPERLAN/2)
2.2.2 Receiver Architectures
The primary distinction between receivers is the number of stages taken to down-convert a
signal to baseband. Direct conversion takes one down-conversion; superheterodyne receivers
employ two or more. In general, complexity increases with the number of down-conversions.
As we explore alternative architectures it will be shown that the simplicity of direct conver-
sion brings with it several technical problems which would appear to make direct conversion
architecture inappropriate for an SDR receiver. These issues are treated in more detail later in
the chapter.
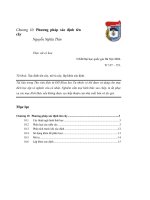
2.2.2.1 Direct Conversion Architecture
A basic direct conversion receiver architecture is shown in Figure 2.2. This receiver consists
of a low noise amplifier (LNA) which provides modest RF gain at a low noise figure. The
output signal from the LNA is filtered in a preselect filter, and down-converted in a complex
(I,Q) mixer. The majority of the gain and automatic gain control (AGC) is provided in a high
gain baseband amplifier.
Its advantages are:
X
low complexity
X
suitable for integrated circuit realization
X
simple filtering requirements
X
image signal suppression is easier (compared to multiple conversion architecture)
Its disadvantages are:
X
A local oscillator is required, in which the two output signals are accurately in phase
quadrature and amplitude balance, over a frequency range equal to the frequency range
of the input signal.
Software Defined Radio: Enabling Technologies32
Figure 2.2 Direct conversion receiver architecture
X
The mixers needs to be balanced and to be able to operate over a correspondingly wide
frequency band.
X
Local oscillator leakage through the mixer and LNA will be radiated from the antenna
and reflected back into the receiver from that antenna. The reflected signal will vary with
the physical environment in which the antenna is placed. This ‘time varying’ DC offset
caused by ‘self-mixing’ is a problem.
X
Most of the signal gain occurs in one frequency band creating the potential for instabil-
ity.
X
1/f noise is a major problem.
X
Second order distortion product mix down ‘in-band’.
All of these points are explained in more detail later in the chapter.
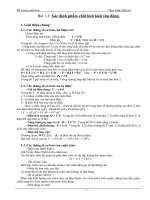
2.2.2.2 Multiple Conversion Architecture
A multiple conversion receiver is shown in Figure 2.3.
Its advantages are:
X
good selectivity (due to the presence of preselect and channel filters;
X
gain is distributed over several amplifiers operating in different frequency bands;
X
conversion from a real to a complex signal is done at one fixed frequency; therefore a
phase quadrature, amplitude balanced, local oscillator is only required at a single
frequency.
Its disadvantages are:
X
the complexity is high;
X
several local oscillator signals may be required;
X
specialized IF filters are required; this makes it impossible to achieve single chip reali-
zation of a superheterodyne receiver.
Radio Frequency Translation for Software Defined Radios 33
Figure 2.3 Multiple conversion superheterodyne architecture
Although the multiple conversion stage of Figure 2.3 only shows two explicit down-
conversions (one in the RF hardware and one in digital signal processing (DSP)), further
conversions can be done in the DSP via the processes of ‘decimation’ and/or ‘sub-
sampling’. Such a receiver architecture may represent the best choice for an SDR receiver
design today, given that the two principal disadvantages
4
of direct conversion are practically
insurmountable for a wideband SDR application with current technology. With this archi-
tecture, the first conversion may be done in RF hardware, and all of the others are done in
DSP.
2.2.2.3 Low IF Architecture
Use of the frequency conversion architecture with a low IF represents a pragmatic attempt to
combine the advantages of a superheterodyne structure with the advantages of a direct
conversion architecture (see [9,10]). Having a low IF means that the image rejection require-
ments are not as onerous as with the superheterodyne structure, and the fact that the LO signal
is not the same frequency as the wanted signal minimizes the DC offset problems inherent in
the direct conversion architecture.
Its advantages are:
X
the DC Offset problems associated with direct conversion architecture can be overcome
while retaining most of the benefits of this architecture;
X
lower complexity than the superheterodyne approach (but slightly greater than the direct
conversion).
Its disadvantages are:
X
better image rejection is required from a low IF receiver than that required of the direct
conversion receiver.
2.2.3 Dynamic Range Issues and Calculation
In this section we develop equations that are essential for the design of receivers and trans-
mitters for SDR applications.
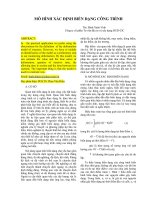
2.2.3.1 Third-order Distortion Components and Third-Order Intercept
Figure 2.4 shows the relationship of the output power of the fundamental signal component,
and the third-order distortion component, of an RF device, as the input signal power level is
increased. This plot is typical for most nonlinear devices that make up a receiver or trans-
mitter (although, of course, the power levels will be different). Two features may be observed
from this characteristic.
The first feature is that the third-order distortion component increases at three times the rate
at which the fundamental component increases. This is because the power in the third-order
component is proportional to the cube of the input power.
Software Defined Radio: Enabling Technologies34
4
Local oscillator balance and DC offset.
Second, were it not for saturation at the output, the third-order distortion product would
eventually reach the same power as the fundamental component. This point is known as
the ‘third-order intercept’ (TOI).
5
The TOI of the example of Figure 2.4 can be seen to be
144 dBm.
A typical spectrum analyzer display showing the results of a two-tone test
6
is shown in
Figure 2.5. The third-order components that will appear ‘in-band’
7
are those at frequencies
2f
1
2 f
2
and 2f
2
2 f
1
. These components increase at three times the rate of the fundamental
components.
Radio Frequency Translation for Software Defined Radios 35
Figure 2.4 Illustration of the concept of third-order intercept
5
An alternative terminology for third-order intercept is IP
3
(intercept point – third-order). This is a useful notation
when dealing with intercept points of other orders (second-order intercept point IP
2
).
6
The ‘two tones’ refers to the two input signals, at frequencies f
1
and f
2
.
7
Other components such as 2f
1
1 f
2
will appear a long way out-of-band, and will thus not pass through the IF
filtering.
With reference to Figure 2.5 again, it can be shown that:
TOI dBmðÞ¼P
1
o
ðdBmÞ 1
AðdBÞ
2
ð1Þ
Equation (1) gives us a convenient way of calculating the TOI given a spectrum analyzer
display of the results of a two-tone test. The measurements required are the power of the two-
tone test signals, P
o
1
(dBm), and the difference between the power of the two test signals, and
the third-order distortion components, A (dB).
2.2.3.2 Cascading Devices with Known TOI and Noise Figure
The noise performance of the receiver will never be better than the input stage noise figure
and the distortion performance will never be better than the final stage output TOI.
When designing a receiver chain it can be difficult to know where to put effort into
improving TOI and noise figure. For example, although it is obvious that the noise figure
of the first stage is crucial, by how much can we allow the noise figures of subsequent stages
to deteriorate, without greatly degrading the overall noise performance of the receiver? By
the same token, although we realize that the distortion performance of the final amplifier is
crucial in setting the overall distortion performance of the receiver, what distortion perfor-
mance is required of the earlier stages in the chain?
A cascade connection of amplifiers is shown in Figure 2.6. The overall noise figure of such
a cascade of amplifiers is given by
F ¼ F
1
1
F
2
2 1
G
1
1
F
3
2 1
G
1
:G
2
1
F
4
2 1
G
1
:G
2
:G
3
1
…
ð2Þ
The worst case output TOI of such a cascade of amplifiers is given by
TOI ¼
1
1
TOI
1
G
4
G
3
G
2
1
1
TOI
2
G
4
G
3
1
1
TOI
3
G
4
1
1
TOI
4
1
…
ð3Þ
Equation (2) is extremely well known and is quoted in a number of references; see for
example [11], pp. 169–171. Equation (3) is less well known, and is a worst case description
Software Defined Radio: Enabling Technologies36
Figure 2.5 Typical spectrum analyzer display used to calculate TOI
of the overall distortion performance of an amplifier chain; see [12], pp. 219–232 and pp.
367–371. Although Equations (2) and (3) have been developed for amplifiers, they are
equally applicable to lossy elements such as filters and mixers.
2.2.3.3 Relationship of Distortion Performance of an SDR Receiver Chain to Blocker
Specifications
Dynamic range describes the ability of a receiver to receive a small wanted signal in the
presence of a nearby (in frequency), large, unwanted signal. One of the unique problems of an
SDR receiver is the necessity of keeping the input RF bandwidth as wide as possible, to
accommodate wide bandwidth signals (e.g. universal mobile telecommunications service
(UMTS) with a bandwidth of 5 MHz), while at the same time preventing high power inter-
fering signals affecting narrow band channels (e.g. GSM style radios with a bandwidth of 200
kHz). As it is practically impossible to introduce a very narrow bandwidth filter at RF
frequencies, then the linearity of the RF stage must be maintained until a filter stage is
reached that will allow a narrow band channel to be selected from the wideband channel.
The worst case situation arises when a narrow band channel, such as GSM, is exposed to
blockers over the wideband UMTS channel. A graphical interpretation of the blocking
specifications for a GSM channel is shown in Figure 2.7.
A situation that will lead to blockers having an effect on the wanted channel is illustrated in
Figure 2.8. Here, two high power blockers are assumed to be present in channels separated
from each other and from the wanted channel by 2.4 MHz
8
. A third-order product will be
produced within the wanted channel due to the blockers being distorted by the implicit
nonlinearity of the receiver hardware. It can be seen from Figure 2.7 that the blockers are
permitted to have an amplitude of up to 2 23 dBm.
Radio Frequency Translation for Software Defined Radios 37
8
2.4 MHz is chosen because it is the maximum separation of blockers from the wanted signal, and from each other,
that can fit inside the 5 MHz UMTS bandwidth (allowing for 200 kHz of the wanted signal). This number is not
critical, as the blockers need to be well outside the GSM frequency band before their allowed power jumps to 0 dBm.
Figure 2.6 Cascade connection of amplifiers
The cochannel interference specification for a GSM system demands that the carrier to
interference (C/I) ratio is at least 9 dB. This implies that, with an input signal of 3 dB above
the reference level ( 2 101 dBm in the case of a GSM mobile station), the cochannel
interference is required to be less than 2 110 dBm.
If the blockers are at the maximum level of 2 23 dBm, then the difference between the two
tones at a power level of 2 23 dBm and the distortion products (at 2 110 dBm), is 87 dB.
This figure can be now substituted into Equation (1) to derive the required input TOI of the
receiver as
Software Defined Radio: Enabling Technologies38
Figure 2.7 GSM blocker specifications
Figure 2.8 Scenario of blockers producing in-band third-order products
TOI
in
¼ 223 1
87
2
¼ 120:5 dBm ð4Þ
The output TOI is calculated by adding the receiver gain (in dB) to the input TOI specifica-
tions (in dBm). The further we progress down the receiver chain before inserting a filter to
remove these blockers, the greater the required TOI of the receiver. As it stands, an input TOI
of 20.5 dBm is a very demanding linearity requirement.
The example shown in Figure 2.9 illustrates the above point. As before, the blockers are
assumed to be at a level of 2 23 dBm and the wanted signal at a level of 2 101 dBm. We
assume the low noise amplifier (LNA) has a gain of 20 dB. With reference to the previous
calculation, it can be seen that an input TOI of 1 20.5 dBm or an output TOI of 1 40.5 dBm
will maintain the 9 dB C/I ratio. The wanted signal will be amplified to a level of 2 81 dBm,
and the blockers will generate an ‘in-band’ distortion component of 2 90 dBm. This leaves a
SINAD figure at the output of both LNAs of 9 dB.
We now consider the effect of inserting a narrowband filter in the right-hand path of Figure
2.9. It is assumed that this filter has a sufficiently sharp cut off to prevent the blocking signals
from reaching the nonlinearity of the IF amplifier. No new distortion products are produced
and the SINAD at the output of the right-hand signal path is preserved at 9 dB. The distortion
output of the left-hand signal path is a combination of the distortion product of the LNA
amplifier by the IF amplifier, plus the distortion product of the IF amplifier itself. This effect
has been shown to be equivalent to an effective TOI (TOI
out
) (see Equation (3)) given by
TOI
out
¼
1
1
TOI
LNA
G
IF
1
1
TOI
IF
¼
1
1
11:22 £ 10
4
1
1
100
¼ 99:9W< 50 dBm
Radio Frequency Translation for Software Defined Radios 39
Figure 2.9 Mitigation of the effects of nearby blockers by using a channelization filter high up in the
RF chain
where TOI
LNA
is the TOI of the LNA (W), TOI
IF
is the TOI of the IF amplifier (W) and G
IF
is
the power gain of the LNA (linear ratio). This yields a distortion component of 1 11 dBm
and a SINAD of 2 50 dB, which would be unworkable. Note the TOI of the LNA is bigger
than it needs to be for the signal path on the left-hand side of Figure 2.9
9
; however, it is
needed to achieve reasonable distortion performance for the example on the right-hand side
(even when a channelization filter is included).
2.2.3.4 Measurement and Calculation of Dynamic Range: Spurious Free Dynamic
Range (SFDR)
Maximizing the dynamic range of a receiver implies that the receiver has a maximum TOI
and a minimum noise figure. Improving one of these parameters, at the expense of the other,
will not increase the dynamic range of the receiver. One measure of the dynamic range is the
spurious free dynamic range (SFDR). The SFDR measures the difference in power between
the noise floor, and a signal power that would just cause a third-order distortion component to
emerge from the noise.
It can be shown that the SFDR is given by
SFDR ¼
2
3
TOI 22174 1 10log B
w
ÀÁ
1 NF 1 G
ÀÁÀÁ
ð5Þ
where TOI is the output third-order intercept of the device (dBm), B
w
is the device bandwidth
(Hz), G is the device gain (dB) and NF is the device noise figure (dB).
Examination of Equation (5) shows that SFDR is determined by the difference between the
TOI and the noise figure (NF). So a large SFDR is obtained by having a low NF and a high
TOI. Equation (5) can be rewritten to give the SFDR at the input as
SFDR ¼
2
3
TOI
in
22174 1 10log B
w
ÀÁ
1 NF
ÀÁÀÁ
ð6Þ
where TOI
in
is the input TOI of the receiver. Equation (6) essentially restates Equation (5).
2.2.4 Adjacent Channel Power Ratio (ACPR) and Noise Power Ratio (NPR)
The broadband nature of the signals used in modern radio systems, combined with the close
spacing of the channels, has produced important changes in the way of characterizing distor-
tion. The TOI figure of merit is often replaced, or at least augmented, by parameters that
employ measurement techniques more directly related to the system that the engineer is
trying to characterize.
The adjacent channel power ratio (ACPR) is one such parameter. This parameter measures
the effect of a signal from one channel appearing in the adjacent channel. ACPR is the ratio of
the average power in the adjacent channel to the average power in the desired channel. Figure
2.10 shows how measurement of ACPR is calculated. This is conveniently done using a
spectrum analyzer. P
DC
and P
AC
are measured by integrating the respective desired channel
and adjacent channel powers over the channel bandwidth.
Software Defined Radio: Enabling Technologies40
9
In other words, even if the TOI of the LNA were 20 dBm, the overall TOI
OUT
would still be about 50 dBm
(actually 49.6 dBm).
Noise power ratio (NPR) is an alternative way of characterizing distortion. A white noise
signal with a notch in its normally flat spectrum is applied to the system under test. Distortion
products generated by the system will tend to fill the spectral notch (see Figure 2.10). The
ratio of the average power in the signal to average power in the notch is the NPR. The smaller
the NPR, the greater the distortion.
TOI, ACPR, and NPR are not vastly different in their interpretation of a distortion situa-
tion. For example, a system with high third-order components on a two-tone test will exhibit
high ACPR and a low NPR. Note that ACPR and NPR are parameters whose value changes
with input power level, whereas TOI is a fixed single value for a particular system. This
makes TOI an invaluable tool for design calculations.
2.2.5 Receiver Signal Budget
With the design of any type of receiver, a good insight into the operation of that receiver can
be obtained by plotting a diagram showing the minimum and maximum signal levels as the
signal progresses down the receiver chain towards the ADC. The signal level will increase as
it passes through amplifiers and active mixers, and decrease as it passes through passive
filters, mixers, and duplexers.
The minimum input signal level will be specified for a particular air interface standard as a
‘reference sensitivity level’. The maximum signal level will also need to be specified. The
AGC will be required to act on the high level signal, to reduce it sufficiently to fit within the
ADC headroom. The minimum signal level will need to be maintained sufficiently above the
noise floor to achieve the required BER performance. This distance will vary with the type of
modulation used.
This type of diagram can also incorporate the rise in the noise floor through the receiver.
Finite noise figures mean that there is an ‘excess’ rise in the noise floor, over and above and
above what would occur through amplification.
Such a signal budget diagram for a hypothetical receiver is shown in Figure 2.11. (For
clarity, the maximum input signal and its associated automatic gain control (AGC) charac-
teristics have been omitted from the diagram.)
Radio Frequency Translation for Software Defined Radios 41
Figure 2.10 Different ways of quantifying the IMD distortion for wideband modulated or multi-
channel signals
A 100 kHz signal bandwidth has been assumed for this receiver, thus the effective thermal
noise input is 2174 1 10logð10
5
Þ dBm. The signal level increases by an amount equal to
the gain, or decreases by an amount equal to the loss, as the signal progresses down the
receiver chain. The noise level increases or decreases by an amount equal to the gain or loss
plus an amount given by the progressive noise figure (see Equation (2)). The difference
between the input signal-to-noise ratio and the output signal-to-noise ratio gives the overall
receiver noise figure (4.62 dB in this example).
An ADC will have a noise floor set by the quantization noise of the converter itself.
Quantization noise occurs because the converter output only ever approximates the analog
signal that it is converting. It can be shown that the signal-to-noise ratio of an ADC is given
by
SNR
QF
dBðÞ¼6:02b 1 1:76 1 10log
F
S
2B
C
dB ð7Þ
Software Defined Radio: Enabling Technologies42
Figure 2.11 Signal and noise levels throughout a hypothetical receiver chain
where b is the resolution of the ADC in bits, F
S
is the sampling frequency and B
C
is the
bandwidth of the channel being sampled.
We will now redraw Figure 2.11 to concentrate on issues associated with the ADC and the
AGC (see Figure 2.12). No attempt has been made to show losses that occur in mixers, filters
and duplexers. Focusing on the analog to digital conversion (ADC), and with reference to this
diagram, the following points can be made.
†
The maximum gain of the receiver is set by the difference between the minimum input
signal power, and the power of a signal placed at a position suitably above the noise floor
of the ADC to maintain the BER of the modulation being used. The noise floor of the ADC
is set by the resolution of the ADC, combined with the maximum input signal of the ADC.
†
The required AGC range is set by the difference between maximum input signal to the
radio and the minimum input signal to the radio (P
in(max)
2 P
in(min)
) dB, less the difference
between the maximum input power to the ADC and the noise floor of the ADC (P
ADCmax
2
n
ADC
) dB, plus the E
b
/N
0
for the modulation scheme used, i.e. AGC range ¼ [(P
in(max)
2
P
in(min))
2 (P
ADC(min)
2 n
ADC
) 1 E
b
/N
0
] dB.
†
The noise floor at the output of the receiver can be determined by either the noise floor of
the ADC or the thermal noise floor. For narrow band systems it tends to be the noise floor
of the ADC which determines the receiver noise floor. For wide band systems, it is the
thermal noise floor (in which case the ADC has more resolution than required).
2.2.5.1 An Approach to Receiver Design
To make a start on the design of the receiver, we need to know certain parameters. From
knowledge of these parameters, the design calculations (also listed) can be made.
1. The maximum signal input level to the ADC. This establishes point A in Figure 2.12.
2. The maximum blocker level likely to be present in the signal at the ADC expressed in dB
relative to the minimum signal level (usually the reference signal level plus 3 dB). This
establishes the separation of point A from point B and hence establishes point B in Figure
2.12. The required net gain of the receiver channel can now be calculated.
3. The minimum signal-to-noise ratio for the narrowest band air interface standard being
used. This will establish the separation of B and C in Figure 2.12 and hence establish point
C. The required resolution of the ADC can now be calculated.
4. Given the receiver gain calculated with the minimum input signal (from point (2)), the
position of point D can now be derived by adding this receiver gain (in dB) to the
maximum input signal level (in dBm). The required AGC range can be calculated as
the difference between point D and point A.
5. Given the maximum receiver gain, the position of the noise floor for a noiseless amplifier
can be calculated to give point E.
6. By setting the thermal noise floor, below or equal to the quantization noise of the ADC,
point F can be established. Subtracting the value of point E (in dBm) from the value of
point F(in dBm) will give the maximum noise figure for the receiver chain (in dB).
This procedure will allow for partial design of the receiver chain.
Radio Frequency Translation for Software Defined Radios 43
2.2.5.2 Approach when using WCDMA signals
The approach to receiver design, discussed in the previous section, is modified slightly in the
case where the signal being processed is a WCDMA signal. In this case, the signal is buried in
the noise and is only retrieved when the signal is despread. This will not occur in the RF
chain, so the function of the RF hardware is to keep the added noise low enough, so that when
the signal is in fact despread, the signal to noise will remain high enough so that a low error
rate results. The notion of a processing gain reflects the fact that the receiver can construct a
received signal from a number of samples and thus averaging the signal is possible. Proces-
sing gain is expressed as:
Processing gain ¼ 10:log
Chipping rate
data rate
The fact that the signal is essentially buried in noise, makes a slight variation to our
graphical representation of the receiver signal budget of Figure 2.12. Figure 2.13 shows
this variation. Note that because of the wideband nature of the signal, the thermal noise
floor will almost certainly exceed the noise floor of the ADC.
2.2.6 Image Rejection
A problem that arises uniquely with software radio RF design is how to accommodate image
signals. An image signal is a signal of such a frequency that, along with the wanted signal, it
Software Defined Radio: Enabling Technologies44
Figure 2.12 Receiver signal levels
will be mixed down to the set IF frequency. Image signals differ in frequency from the wanted
signal by twice the IF frequency.
10
Image signals are removed in a conventional receiver via the use of preselect filters. The
receiver in a GSM mobile station, for instance, should be set to receive signals in the range of
935–960 MHz. The preselect filter could thus have a bandwidth of 25 MHz based on a center
frequency of 947.5 MHz ((935 1 960)/2). Assuming an IF frequency of 80 MHz, the image
frequency bands would be 1095–120 MHz (for high side mixing) and 775–800 MHz (for low
side mixing). Both of these bands would be eliminated by any preselect filter of modest
performance.
Such a comparatively narrow band image filter is not a simple option with a proper SDR
receiver as the frequency band of signals it will be set to receive should be software
determined, although switchable or electronically tuneable preselect filters are one possible
solution.
Radio Frequency Translation for Software Defined Radios 45
Figure 2.13 Received signal levels for W-CDMA
10
Twice the IF frequency higher than the IF frequency, in the case of high side mixing, and twice the IF frequency
lower than the IF frequency, in the case of low side mixing.
Image reject mixing is another way of dealing with image signals. It is typically used with
low IF, or zero IF, receivers.
11
To get an image reject mixer to function satisfactorily, the two
local oscillator signals need to be in precise phase quadrature, and have precise amplitude
balance. Zero IF and low IF receivers can get away with relatively poor image rejection
performance. Image rejection performance of the order of 40 dB is satisfactory for a direct
conversion receiver (where the image signal is in fact a frequency reversed version of the
wanted signal). The image rejection performance required of the conventional superheter-
odyne stage is, however, much greater, and will be determined by the blocker specifications.
Consider the previous example with a signal at 1095 MHz, 160 MHz away from the wanted
signal (935 MHz); GSM blocker specifications allow a signal level of 0 dBm (see Figure 2.7)
at that frequency. A blocking signal at this level is not allowed to introduce a signal of more
than the reference sensitivity 1 3 dB minus 9 dB (i.e. 2 110 dBm). This would mean that the
required image rejection is 0 2 ( 2 110 dB) or 110 dB. This degree of performance is
impractical. Low IF receivers require an image rejection performance somewhere between
the two extremes because the image signals will result from blocker signals that are closer to
the wanted signal. A further discussion of image rejection techniques is pursued in Sections
2.4.2 and 2.4.3 (see also [13,14]).
As the image signal differs from the wanted signal by twice the IF frequency, if the first IF
is made high enough, then the image signals will be out-of-band, even for an SDR. Thus,
maximizing the first IF may be a desirable option. There is a limit to how high the first IF
frequency can be made however.
First, it is necessary to apply some filtering to the first IF stage to at least help with the
linearity demands of the receiver and make some inroads into rejecting unwanted signals. At
high IF frequencies, the design of such filters becomes more problematic. At 500 MHz, for
example, there is a choice of a surface acoustic wave (SAW) filter or a helical filter; the
former is lossy and the latter is bulky.
Second, if there has only been a small conversion in the first IF, then the second IF will
require a bigger down-conversion. This will cause the image signal to ‘close in’ on the wanted
Software Defined Radio: Enabling Technologies46
Figure 2.14 Image problems arising from a large second conversion
signal. For example Figure 2.14 shows an E-GSM signal being down-converted to a 500 MHz
first IF. The local oscillator is set to perform a high side conversion and its frequency will vary
from 1425 to 1460 MHz accordingly. The resultant image of the first down-conversion
appears at a frequency of 1925–1960 MHz. This signal will be easily eliminated by any
RF preselect filter. The second down-conversion to 20 MHz will cause problems. For this
conversion, the image signal will be at 540 MHz. If 80 dB image rejection is required, then
the first IF filter must be 80 dB down at 540 Hz. This places quite a restriction on the first IF
filter. These specifications can be met with an SAW filter. However, the effect is described
because it is all too easy to assume that because the image signals have been removed from
the first down-conversion, then subsequent down-conversions will not produce image
problems. The effect could be summarized by saying that the filter prior to any down-
conversion acts to provide an RF preselection function to remove image signals and therefore
this filter should be designed accordingly.
2.2.7 Filter Functions within the Receiver
To summarize the points raised in this section, in any superheterodyne receiver architecture,
filters are required to perform three functions.
X
First, they band limit the signal to the frequency of interest. This function is often referred
to as ‘channelization’ and is achieved, for preference, in the baseband of the receiver.
X
Second, filters are used to allow the image signal to be separated from the wanted signal.
This function is performed at the first opportunity in the receiver chain.
X
Third, filters should prevent nearby but out-of-band ‘blocker’ signals generating suffi-
cient ‘in-band’ power to interfere with the wanted signal. It should be noted that if the
receiver amplifier were perfectly linear, then it would not be possible for out-of-band
signals to generate in-band products, and a filter to achieve this function would not be
required. In practice, some nonlinearity exists in all amplifiers and mixers that make up
the receiver chain. This means that some degree of channelization needs to occur at a
fairly early stage in the amplifier-mixer chain.
2.3 Transmitter Design Considerations
The design of the transmitter is somewhat similar to the design of the receiver in that there are
elements in the receiver design which appear, slightly disguised in format, within the design
of the transmitter. We first discuss these features before moving on to issues more particularly
related to transmitter design.
2.3.1 Filtering Analogies between Receiver and Transmitter
The three functions performed by filters in the receiver are also performed by filters in the
transmitter. With the transmitter, a filter is required to define the channel, as in the receiver. A
filter is required to remove the unwanted outputs of the final up-conversion; this is compar-
able to removing the image signal in the receiver. A filter is also required to prevent spurious
or out-of-band emissions, analogous to preventing blocking signals generating ‘in-band’
interference in the receiver case. Filters required to perform these various functions are
placed at corresponding points in the receiver and transmitter chains (see Figure 2.15).
Radio Frequency Translation for Software Defined Radios 47
High linearity is required from the high power amplifier (HPA) to prevent spurious emis-
sions, and from the low noise amplifier (LNA) to prevent blocker signals generating in-band
interference. Overall linearity of the IF and HPA for the transmitter, and the LNA and the IF
amplifier for the receiver, is required to preserve the integrity of any linear modulation being
used. The linearity requirement, in this regard, is unlikely to be as critical as the linearity
requirements for preventing spurious emissions and dealing with blockers. It does, however,
mean that the amplifiers in the IF of both the transmitter and receiver still need to be ‘near
linear.’
2.3.2 Transmitter Architectures
Basically the same choice applies to transmitter architectures as applies to receiver architec-
tures. The advantages and disadvantages associated with receiver architectures more or less
translate to transmitters. There is no advantage in having the equivalent of a low IF receiver.
In the transmitter this will cause the wanted sideband to be closer to the unwanted sideband,
making it difficult to remove by filtering.
Software Defined Radio: Enabling Technologies48
Figure 2.15 Duality of filters functions within a superheterodyne receiver and transmitter