Tài liệu Practice Made Perfect 25 doc
Bạn đang xem bản rút gọn của tài liệu. Xem và tải ngay bản đầy đủ của tài liệu tại đây (161.97 KB, 11 trang )
PROFITABILITY RATIOS
!
Gross profit margin
(Gross profit ÷ total revenue) × 100% = gross profit margin
(
÷ ) × 100% =
!
Operating profit margin
(Operating profit ÷ total revenue) x 100% = operating profit margin
(
÷ ) × 100% =
!
Overhead percentage
(Total overhead ÷ total revenue) × 100% = overhead percentage
(
÷ ) × 100% =
!
Average total income per owner
(Owner’s base draw + operating profit) ÷ no. of owners = average total
income per owner
(
+ ) ÷ =
PRODUCTIVITY RATIOS
!
Revenue per professional
Total revenue ÷ no. of professionals = revenue per professional
÷ =
!
Revenue per staff
Total revenue ÷ no. of total staff = revenue per staff
÷ =
!
Clients per professional
Total clients ÷ no. of professionals = clients per professional
÷ =
218
WORKSHEET 9
Calculations for Ratios
Source: © Moss Adams LLP
!
Clients per staff
Total clients ÷ no. of total staff = clients per staff
÷ =
!
Operating profit per professional
Operating profit ÷ no. of professionals = operating profit per professional
÷ =
!
Operating profit per staff
Operating profit ÷ no. of total staff = operating profit per staff
÷ =
CLIENT-SELECTION RATIOS
!
Revenue per client
Total revenue ÷ no. of clients = revenue per client
÷ =
!
Assets under management per client
Assets under management ÷ no. of clients = assets under management
per client
÷ =
!
Gross profit per client
Gross profit ÷ no. of clients = gross profit per client
÷ =
!
Operating profit per client
Operating profit ÷ no. of clients = operating profit per client
÷ =
C
ALCULATIONS
FOR
R
ATIOS
219
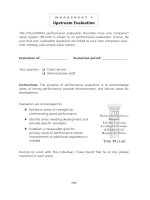
ACCOUNT ITEM
1
Net income after tax
2
Depreciation and amortization
3
+/– Changes in accounts receivable
4
+/– Changes in inventory
5
+/– Changes in other current assets
6
+/– Changes in accounts payable
7
+/– Changes in accrued expenses
8
+/– Changes in income tax payable and
deferred taxes
9
+/– Changes in other current liabilities
10
+/– Changes in other noncurrent liabilities
11 Operating cash flow (OCF)
12
+/– Changes in marketable securities
13
+/– Changes in long-term investment
14
+/– Changes in gross fixed assets
15
Nonrecurring gain (loss)
16
+/– Changes in intangible and other
noncurrent assets
17 Investing cash flow (ICF)
18
Cash flow before financing
(sum 11 and 17)
19
+/– Changes in short-term bank debt
20
+/– Changes in long-term bank debt
21
+/– Changes in subordinated debt
22
+/– Changes in capital stock
23
– Dividends paid
24
+/– Adjustments to retained earnings
25
+/– Changes in minority interest
26 Financing cash flow (FCF)
27 Total cash flow
(sum 11, 17, and 26
)
220
WORKSHEET 10
Cash Flow Calculator
Index
accounting
accrual, 146
cash-basis, 145–146
fundamentals of, 137–138
Accredited Investors, 25–26, 39–40
accrual accounting, 146
administrative staff, use of, 54–56
Advisor Impact, 5, 39, 40, 56
Client Audit process, 43, 45, 46
advisory firms, top challenges facing,
6–7
affiliation model, 66–70
American Express Financial Advisors,
68
American Marketing Association,
46
Applied Business Solutions, 16
assets
current, 140
f ixed, 140 –141
Atlas Shrugged (Rand), 95
Bachrach, Bill, xiv, 23
balance sheets
analysis of, 162–168
description of, 139–143, 214–215
Balasa, Mark, 15–16
BAM Advisor Services LLC, 68
base pay, 117–118, 120–124
benchmarking
compensation, 121–124, 212–213
hiring employees and, 86–88
Beyond Survival: A Guide for Business
Owners and Their Families
(Danco), 7
bonuses and incentives, 118–119,
124–128
Boston Private, 24
Bowen, John, xiv
break-even analysis, 159
Bruckenstein, Joel, xv, 4, 54
capabilities (core) perspective, 23
cash-basis accounting, 145–146
cash flow calculator, 220
cash flow statements
analysis of, 168–169
description of, 146–148
CEO, hiring a, 104
common mistakes, 105–109
CFA Institute, 151, 152
Christopher Street Financial, Inc.,
17–18, 45
client
analysis of, 26–27, 194–197
demands, 2–3
entrepreneurs and relationships
with, 56–58
satisfaction affected by growth, 60
selection ratio, 219
surveys, 39–47
Client Audit process, 43, 45, 46
Collins, Jim, 185, 186
common sizing, 160
221
compensation
base pay, 117–118, 120–124
benchmarking, 121–124, 212–213
benefits, 119
bonuses and incentives, 118–119,
124–128
commission-based/variable base
pay, 117–118, 120
fixed pay, 117, 120
long-term wealth-building, 120,
127–128, 129–136
owner’s, 128–129
perquisites, 119–120
compensation plans
affordability issues, 115–116
common mistakes, 111–112
developing, 112–117
establishing incentive, 124–128
reinforcing behavior with, 115
staff expectations, 116–117
strategic alignment and, 113–115
competition
perspective, 23
training staff that becomes your,
60–61
costs
creeper, 160
growth and, 59–60
Covey, Stephen, 186
Dalbar, 43
Danco, Leon, 7
DataLynx, 68
debt, long-term, 142
debt-to-equity ratio, 166–167
DESCO model, 102
Dinverno, Armond, 15–16
diversification, 19, 21
Drucker, David, xv, 4, 54
employees. See staff
E Myth: Why Most Businesses Don’t
Work and What to Do About It,
The (Gerber), 3
E Myth Revisited: Why Most Small
Businesses Don’t Work and
What to Do About It, The
(Gerber), 72
ensemble practitioners, versus solo
practitioners, 51–54
entrepreneurs
common characteristics, 51
difference between self-employed
and, 49–50
efficiency limitations, 54–56
growth, dealing with, 50–51,
59–61
solo versus ensemble practitioners,
51–54
time spent with clients, 56–58
equity, 142, 167–168
equity-type offerings, 120, 127–128,
129–136
evaluation, strategic plans and,
29–33
expenses
direct, 144
overhead, 145
fees, margin squeeze and, 5
Fidelity Registered Investment
Adviser Group, 68
financial analysis
of balance sheet, 162–168
of cash f low statement, 168–169
of income statement, 151–162
process, 150
financial-impact analysis, 169–170
Financial Planning Association
(FPA), 52, 55
Compensation and Staffing Study,
66, 72, 77, 104, 121, 122–123,
151, 152, 169, 178, 212–213
financial statements
balance sheets, 139–143, 214–215
cash flow statements, 146–148
222 I
NDEX