Tài liệu Memory Dump Analysis Anthology- P11 docx
Bạn đang xem bản rút gọn của tài liệu. Xem và tải ngay bản đầy đủ của tài liệu tại đây (618.82 KB, 30 trang )
No Component Symbols 301
No Component Symbols pattern can be easily identified in stack traces by huge
function offsets or no exported functions at all:
STACK_TEXT:
WARNING: Stack unwind information not available. Following frames may be
wrong.
00b2f42c 091607aa mydll!foo+0×8338
00b2f4cc 7c83ab9e mydll2+0×8fe3
Please purchase PDF Split-Merge on www.verypdf.com to remove this watermark.
302 PART 3: Crash Dump Analysis Patterns
INSUFFICIENT MEMORY (COMMITTED MEMORY)
Insufficient Memory pattern can be seen in many complete and kernel memory
dumps. This condition can cause a system to crash, become slow, hang or refuse to pro-
vide the expected functionality, for example, refuse new terminal server connections.
There are many types of memory resources and we can classify them initially into the
following categories:
Committed memory
Virtual memory
o Kernel space
Paged pool
Non-paged pool
Session pool
PTE limits
Desktop heap
GDI limits
o User space
Virtual regions
Process heap
What we outline here is committed memory exhaustion. Committed memory is
an allocated memory backed up by some physical memory or by a reserved space in the
page file(s). Reserving the space needs to be done in case OS wants to swap out that
memory data to disk when it is not used and there is no physical memory available for
other processes. If that data is needed again OS brings it back to physical memory. If
there is no space in page file(s) then physical memory is filled up. If committed memory
is exhausted most likely the system will hang or result in a bugcheck soon so checking
memory statistics shall always be done when we get a kernel or a complete memory
dump. Even access violation bugchecks could result from insufficient memory when
some memory allocation operation failed but a kernel mode component didn’t check
the return value for NULL. Here is an example:
BugCheck 8E, {c0000005, 809203af, aa647c0c, 0}
0: kd> !analyze -v
...
...
...
TRAP_FRAME: aa647c0c -- (.trap ffffffffaa647c0c)
...
Please purchase PDF Split-Merge on www.verypdf.com to remove this watermark.
Insufficient Memory (Committed Memory) 303
...
...
0: kd> .trap ffffffffaa647c0c
ErrCode = 00000000
eax=00000000 ebx=bc1f3cfc ecx=89589250 edx=000018c1 esi=bc1f3ce0
edi=aa647d14
eip=809203af esp=aa647c80 ebp=aa647c80 iopl=0 nv up ei pl zr na pe nc
cs=0008 ss=0010 ds=0023 es=0023 fs=0030 gs=0000 efl=00010246
nt!SeTokenType+0x8:
809203af 8b8080000000 mov eax,dword ptr [eax+80h]
ds:0023:00000080=????????
0: kd> k
ChildEBP RetAddr
aa647c80 bf8173c5 nt!SeTokenType+0x8
aa647cdc bf81713b win32k!GreGetSpoolMessage+0xb0
aa647d4c 80834d3f win32k!NtGdiGetSpoolMessage+0x96
aa647d4c 7c82ed54 nt!KiFastCallEntry+0xfc
If we enter !vm command to display memory statistics we would see that all
committed memory is filled up:
0: kd> !vm
*** Virtual Memory Usage ***
Physical Memory: 999294 ( 3997176 Kb)
Page File: \??\C:\pagefile.sys
Current: 4193280 Kb Free Space: 533744 Kb
Minimum: 4193280 Kb Maximum: 4193280 Kb
Available Pages: 18698 ( 74792 Kb)
ResAvail Pages: 865019 ( 3460076 Kb)
Locked IO Pages: 290 ( 1160 Kb)
Free System PTEs: 155265 ( 621060 Kb)
Free NP PTEs: 32766 ( 131064 Kb)
Free Special NP: 0 ( 0 Kb)
Modified Pages: 113 ( 452 Kb)
Modified PF Pages: 61 ( 244 Kb)
NonPagedPool Usage: 12380 ( 49520 Kb)
NonPagedPool Max: 64799 ( 259196 Kb)
PagedPool 0 Usage: 40291 ( 161164 Kb)
PagedPool 1 Usage: 2463 ( 9852 Kb)
PagedPool 2 Usage: 2455 ( 9820 Kb)
PagedPool 3 Usage: 2453 ( 9812 Kb)
PagedPool 4 Usage: 2488 ( 9952 Kb)
PagedPool Usage: 50150 ( 200600 Kb)
PagedPool Maximum: 67584 ( 270336 Kb)
********** 18 pool allocations have failed **********
Shared Commit: 87304 ( 349216 Kb)
Special Pool: 0 ( 0 Kb)
Please purchase PDF Split-Merge on www.verypdf.com to remove this watermark.
304 PART 3: Crash Dump Analysis Patterns
Shared Process: 56241 ( 224964 Kb)
PagedPool Commit: 50198 ( 200792 Kb)
Driver Commit: 1892 ( 7568 Kb)
Committed pages: 2006945 ( 8027780 Kb)
Commit limit: 2008205 ( 8032820 Kb)
********** 1216024 commit requests have failed **********
There might have been a memory leak or too many terminal sessions with fat
applications to fit in physical memory and the page file.
Please purchase PDF Split-Merge on www.verypdf.com to remove this watermark.
Spiking Thread 305
SPIKING THREAD
The next pattern is Spiking Thread. If we have a process dump with many threads
it is sometimes difficult to see which thread there was spiking CPU. This is why it is al-
ways good to have some screenshots or notes from QSlice or Process Explorer showing
spiking thread ID and process ID. The latter ID is to make sure that the process dump
was from the correct process. New process dumpers and tools from Microsoft (user-
dump.exe, for example) save thread time information so we can open the dump and see
the time spent in kernel and user mode for any thread by entering !runaway command.
However if that command shows many threads with similar CPU consumption it will not
highlight the particular thread that was spiking at the time the crash dump was saved so
screenshots are still useful in some cases.
What to do if we don’t have the spiking thread ID? We need to look at all threads
and find those that are not waiting. Almost all threads are waiting most of the time. So
the chances to dump the normal process and see some active threads are very low. If
the thread is waiting the top function on its stack usually is (for XP/W2K3/Vista):
ntdll!KiFastSystemCallRet
and below it we can see some blocking calls waiting for some synchronization object,
Sleep API call, IO completion or for LPC reply:
0:085> ~*kv
...
...
...
64 Id: 1b0.120c Suspend: -1 Teb: 7ff69000 Unfrozen
ChildEBP RetAddr Args to Child
02defe18 7c90e399 ntdll!KiFastSystemCallRet
02defe1c 77e76703 ntdll!NtReplyWaitReceivePortEx+0xc
02deff80 77e76c22 rpcrt4!LRPC_ADDRESS::ReceiveLotsaCalls+0xf4
02deff88 77e76a3b rpcrt4!RecvLotsaCallsWrapper+0xd
02deffa8 77e76c0a rpcrt4!BaseCachedThreadRoutine+0×79
02deffb4 7c80b683 rpcrt4!ThreadStartRoutine+0×1a
02deffec 00000000 kernel32!BaseThreadStart+0×37
65 Id: 1b0.740 Suspend: -1 Teb: 7ff67000 Unfrozen
ChildEBP RetAddr Args to Child
02edff44 7c90d85c ntdll!KiFastSystemCallRet
02edff48 7c8023ed ntdll!NtDelayExecution+0xc
02edffa0 57cde2dd kernel32!SleepEx+0×61
02edffb4 7c80b683 component!foo+0×35
02edffec 00000000 kernel32!BaseThreadStart+0×37
Please purchase PDF Split-Merge on www.verypdf.com to remove this watermark.
306 PART 3: Crash Dump Analysis Patterns
66 Id: 1b0.131c Suspend: -1 Teb: 7ff66000 Unfrozen
ChildEBP RetAddr Args to Child
02f4ff38 7c90e9c0 ntdll!KiFastSystemCallRet
02f4ff3c 7c8025cb ntdll!ZwWaitForSingleObject+0xc
02f4ffa0 72001f65 kernel32!WaitForSingleObjectEx+0xa8
02f4ffb4 7c80b683 component!WorkerThread+0×15
02f4ffec 00000000 kernel32!BaseThreadStart+0×37
67 Id: 1b0.1320 Suspend: -1 Teb: 7ff65000 Unfrozen
ChildEBP RetAddr Args to Child
02f8fe1c 7c90e9ab ntdll!KiFastSystemCallRet
02f8fe20 7c8094e2 ntdll!ZwWaitForMultipleObjects+0xc
02f8febc 7e4195f9 kernel32!WaitForMultipleObjectsEx+0×12c
02f8ff18 7e4196a8 user32!RealMsgWaitForMultipleObjectsEx+0×13e
02f8ff34 720019f6 user32!MsgWaitForMultipleObjects+0×1f
02f8ffa0 72001a29 component!bar+0xd9
02f8ffb4 7c80b683 component!MonitorWorkerThread+0×11
02f8ffec 00000000 kernel32!BaseThreadStart+0×37
68 Id: 1b0.1340 Suspend: -1 Teb: 7ff63000 Unfrozen
ChildEBP RetAddr Args to Child
0301ff1c 7c90e31b ntdll!KiFastSystemCallRet
0301ff20 7c80a746 ntdll!ZwRemoveIoCompletion+0xc
0301ff4c 57d46e65 kernel32!GetQueuedCompletionStatus+0×29
0301ffb4 7c80b683 component!AsyncEventsThread+0×91
0301ffec 00000000 kernel32!BaseThreadStart+0×37
…
…
…
# 85 Id: 1b0.17b4 Suspend: -1 Teb: 7ffd4000 Unfrozen
ChildEBP RetAddr Args to Child
00daffc8 7c9507a8 ntdll!DbgBreakPoint
00dafff4 00000000 ntdll!DbgUiRemoteBreakin+0×2d
Therefore if we have a different thread like this one below the chances that it
was spiking are bigger:
58 Id: 1b0.9f4 Suspend: -1 Teb: 7ff75000 Unfrozen
ChildEBP RetAddr Args to Child
0280f64c 500af723 componentB!DoSomething+32
0280f85c 500b5391 componentB!CheckSomething+231
0280f884 500b7a3f componentB!ProcessWorkIteme+9f
0301ffec 00000000 kernel32!BaseThreadStart+0x37
There is no KiFastSystemCallRet on top and if we look at the currently executing
instruction we see that it does some copy operation:
Please purchase PDF Split-Merge on www.verypdf.com to remove this watermark.
Spiking Thread 307
0:085> ~58r
eax=00000000 ebx=0280fdd4 ecx=0000005f edx=00000000 esi=03d30444
edi=0280f6dc
eip=500a4024 esp=0280f644 ebp=0280f64c iopl=0 nv up ei pl nz na po nc
cs=001b ss=0023 ds=0023 es=0023 fs=003b gs=0000 efl=00010202
componentB!DoSomething+32:
500a4024 f3a5 rep movs dword ptr es:[edi],dword ptr [esi]
es:0023:0280f6dc=00000409 ds:0023:03d30444=00000409
In a kernel or a complete memory dump we can see CPU spikes by checking
KernelTime and UserTime:
0: kd> !thread 88b66768
THREAD 88b66768 Cid 01fc.1550 Teb: 7ffad000 Win32Thread: bc18f240 RUNNING
on processor 1
IRP List:
89716008: (0006,0094) Flags: 00000a00 Mdl: 00000000
Impersonation token: e423a030 (Level Impersonation)
DeviceMap e3712480
Owning Process 8a0a56a0 Image: SomeSvc.exe
Wait Start TickCount 1782229 Ticks: 0
Context Switch Count 877610 LargeStack
UserTime 00:00:01.0078
KernelTime 02:23:21.0718
By default !runaway shows only user mode time. By specifying additional flags it
is possible to see both kernel and user time:
0:000> !runaway 3
User Mode Time
Thread Time
8:15a4 0 days 0:12:32.812
0:1c00 0 days 0:00:00.312
9:1b50 0 days 0:00:00.296
22:2698 0 days 0:00:00.046
17:22b8 0 days 0:00:00.031
14:2034 0 days 0:00:00.031
21:21b4 0 days 0:00:00.000
20:27b0 0 days 0:00:00.000
19:278c 0 days 0:00:00.000
18:2788 0 days 0:00:00.000
16:2194 0 days 0:00:00.000
15:2064 0 days 0:00:00.000
13:2014 0 days 0:00:00.000
12:1e38 0 days 0:00:00.000
11:1c54 0 days 0:00:00.000
10:1d40 0 days 0:00:00.000
7:1994 0 days 0:00:00.000
6:1740 0 days 0:00:00.000
5:1c18 0 days 0:00:00.000
4:c10 0 days 0:00:00.000
Please purchase PDF Split-Merge on www.verypdf.com to remove this watermark.
308 PART 3: Crash Dump Analysis Patterns
3:1774 0 days 0:00:00.000
2:1a08 0 days 0:00:00.000
1:fb8 0 days 0:00:00.000
Kernel Mode Time
Thread Time
9:1b50 0 days 1:21:54.125
8:15a4 0 days 0:02:48.390
0:1c00 0 days 0:00:00.328
14:2034 0 days 0:00:00.234
22:2698 0 days 0:00:00.156
17:22b8 0 days 0:00:00.015
21:21b4 0 days 0:00:00.000
20:27b0 0 days 0:00:00.000
19:278c 0 days 0:00:00.000
18:2788 0 days 0:00:00.000
16:2194 0 days 0:00:00.000
15:2064 0 days 0:00:00.000
13:2014 0 days 0:00:00.000
12:1e38 0 days 0:00:00.000
11:1c54 0 days 0:00:00.000
10:1d40 0 days 0:00:00.000
7:1994 0 days 0:00:00.000
6:1740 0 days 0:00:00.000
5:1c18 0 days 0:00:00.000
4:c10 0 days 0:00:00.000
3:1774 0 days 0:00:00.000
2:1a08 0 days 0:00:00.000
1:fb8 0 days 0:00:00.000
We see that the thread #15a4 spikes mostly in user mode but the thread #1b50
spikes mostly in kernel mode!
In kernel and complete memory dumps we can scan all threads with Ticks: 0 or
Elapsed Ticks: 0 to check their kernel and user times:
PROCESS 8782cd60 SessionId: 52 Cid: 4a58 Peb: 7ffdf000 ParentCid: 1ea4
DirBase: 0a0260c0 ObjectTable: 88ab33a8 TableSize: 486.
Image: IEXPLORE.EXE
VadRoot 87f59ea8 Clone 0 Private 2077. Modified 123. Locked 0.
DeviceMap 880f6828
Token e8217cd0
ElapsedTime 0:03:09.0765
UserTime 0:00:00.0890
KernelTime 0:00:10.0171
QuotaPoolUsage[PagedPool] 100320
QuotaPoolUsage[NonPagedPool] 58100
Working Set Sizes (now,min,max) (4944, 50, 345) (19776KB, 200KB, 1380KB)
PeakWorkingSetSize 4974
VirtualSize 83 Mb
PeakVirtualSize 83 Mb
PageFaultCount 8544
MemoryPriority FOREGROUND
BasePriority 8
CommitCharge 2262
Please purchase PDF Split-Merge on www.verypdf.com to remove this watermark.
Spiking Thread 309
THREAD 87836580 Cid 4a58.57cc Teb: 7ffde000 Win32Thread: a224f1d8 WAIT:
(Executive) KernelMode Non-Alertable
89dee788 Semaphore Limit 0×7fffffff
87836668 NotificationTimer
Not impersonating
Owning Process 8782cd60
Wait Start TickCount 123758 Elapsed Ticks: 0
Context Switch Count 97636 LargeStack
UserTime 0:00:00.0593
KernelTime 0:00:08.0359
Start Address 0×7c57b70c
Win32 Start Address 0×00401ee6
Stack Init ac154770 Current ac154320 Base ac155000 Limit ac14d000 Call
ac15477c
Priority 11 BasePriority 8 PriorityDecrement 0 DecrementCount 0
ChildEBP RetAddr Args to Child
ac154338 8042d8d7 00000000 8047bd00 00000001 nt!KiSwapThread+0×1b1
ac154360 80415d61 89dee788 00000000 00000000
nt!KeWaitForSingleObject+0×1a3
ac15439c 8041547c 00000000 00000001 8051c501 nt!ExpWaitForResource+0×2d
ac1543b4 8046907a 8047bd00 00000001 805225e9
nt!ExAcquireResourceSharedLite+0xc6
ac1543c0 805225e9 00000000 00000001 8051c501 nt!CmpLockRegistry+0×18
ac154430 8051c718 e7c5fd08 ac15448c 00000001 nt!CmSetValueKey+0×31
ac1544b4 8046b2a9 00000798 00125c04 00000000 nt!NtSetValueKey+0×196
ac1544b4 77f88de7 00000798 00125c04 00000000 nt!KiSystemService+0xc9
00125bb0 00000000 00000000 00000000 00000000 +0×77f88de7
For complete and kernel dumps we can also pay attention to the output of
!running command and to the output of !stacks command (Ticks and ThreadState col-
umns).
Please purchase PDF Split-Merge on www.verypdf.com to remove this watermark.
310 PART 3: Crash Dump Analysis Patterns
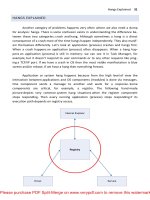
MODULE VARIETY
Sometimes when we look at the list of loaded modules in a process address
space we see an instance of the pattern that I call Module Variety. It means, literally,
that there are so many different loaded modules that we start thinking that their coexis-
tence created the problem. We can also call this pattern Component Variety or DLL Va-
riety but I prefer the former because WinDbg refers to loaded executables, dlls, drivers,
ActiveX controls as modules.
Modules can be roughly classified into 4 broad categories:
Application modules - components that were developed specifically for this
application, one of them is the main application module.
3rd-party modules - we can easily identify them if the company name is the
same in the output of lmv WinDbg command.
Common system modules - Windows dlls supplied by OS and implementing na-
tive OS calls, Windows API and also C/C++ runtime functions, for example,
ntdll.dll, kernel32.dll, user32.dll, gdi32.dll, advapi32.dll, msvcrt.dll.
Specific system modules - optional Windows dlls supplied by Microsoft that are
specific to the application functionality and implementation, like MFC dlls, .NET
runtime or tapi32.dll.
Although lmv is verbose for quick check of component timestamps we can use
lmt WinDbg command. Here is an example of the great module variety from Windows
Server 2003:
Loading Dump File [application.dmp]
...
...
...
Windows Server 2003 Version 3790 (Service Pack 1)
...
...
...
0:001> lmt
start end module name
00400000 030ba000 app_main Mon Dec 04 21:22:42 2006
04120000 04193000 Dformd Mon Jan 31 02:27:58 2000
041a0000 04382000 sqllib2 Mon May 29 22:50:11 2006
04490000 044d3000 udNet Mon May 29 23:22:43 2006
04e30000 04f10000 abchook Wed Aug 01 20:47:17 2006
05e10000 05e15000 token_manager Fri Mar 12 11:54:17 1999
06030000 06044000 ODBCINT Thu Mar 24 22:59:58 2005
Please purchase PDF Split-Merge on www.verypdf.com to remove this watermark.
Module Variety 311
06150000 0618d000 sgl5NET Mon May 29 23:25:22 2006
06190000 0622f000 OPENGL32 Mon Nov 06 21:30:52 2006
06230000 06240000 pwrpc32 Thu Oct 22 16:22:40 1998
06240000 07411000 app_dll_1 Tue Aug 08 12:14:39 2006
07420000 07633000 app_dll_2 Mon Dec 04 22:11:59 2006
07640000 07652000 zlib Fri Aug 30 08:12:24 2002
07660000 07f23000 app_dll_3 Wed Oct 19 11:43:34 2005
0dec0000 0dedc000 app_dll_4 Mon Dec 04 22:11:36 2006
10000000 110be000 des Tue Jul 18 20:42:02 2006
129c0000 12f1b000 xpsp2res Fri Mar 25 00:26:47 2005
1b000000 1b170000 msjet40 Tue Jul 06 19:16:05 2004
1b2c0000 1b2cd000 msjter40 Thu May 09 19:09:53 2002
1b2d0000 1b2ea000 msjint40 Thu May 09 19:09:53 2002
1b570000 1b5c5000 msjetoledb40 Thu Nov 13 23:40:06 2003
1b5d0000 1b665000 mswstr10 Thu May 09 19:09:56 2002
1e000000 1e0f0000 python23 Fri Jan 30 13:03:24 2004
4b070000 4b0c1000 MSCTF Fri Mar 25 02:10:36 2005
4b610000 4b64d000 ODBC32 Fri Mar 25 02:09:33 2005
4b9e0000 4ba59000 OLEDB32 Fri Mar 25 02:09:56 2005
4c310000 4c31d000 OLEDB32R Fri Mar 25 02:09:57 2005
4c3b0000 4c3de000 MSCTFIME Fri Mar 25 02:10:37 2005
5f400000 5f4f2000 mfc42 Wed Oct 27 22:35:22 1999
62130000 6213d000 mfc42loc Wed Mar 26 03:35:58 2003
62460000 6246e000 msadrh15 Fri Mar 25 02:10:29 2005
63050000 63059000 lpk Fri Mar 25 02:09:21 2005
63270000 632c7000 hnetcfg Fri Mar 25 02:09:11 2005
65340000 653d2000 OLEAUT32 Wed Sep 01 00:15:11 1999
68000000 6802f000 rsaenh Fri Mar 25 00:30:55 2005
68a50000 68a70000 glu32 Fri Mar 25 02:09:03 2005
71990000 71998000 wshtcpip Wed Mar 26 03:34:24 2003
719d0000 71a11000 mswsock Fri Mar 25 02:12:06 2005
71a60000 71a6b000 wsock32 Wed Mar 26 03:34:24 2003
71a80000 71a91000 mpr Wed Mar 26 03:34:24 2003
71aa0000 71aa8000 ws2help Fri Mar 25 02:10:19 2005
71ab0000 71ac7000 ws2_32 Fri Mar 25 02:10:18 2005
71ad0000 71ae2000 tsappcmp Fri Mar 25 02:09:56 2005
71af0000 71b48000 netapi32 Fri Aug 11 11:00:07 2006
72ec0000 72ee7000 winspool Fri Mar 25 02:09:48 2005
73290000 73295000 riched32 Wed Mar 26 03:34:14 2003
73ee0000 73ee5000 icmp Wed Mar 26 03:34:09 2003
74920000 7493a000 msdart Fri Mar 25 02:10:48 2005
74b10000 74b80000 riched20 Fri Mar 25 02:09:36 2005
75220000 75281000 usp10 Fri Mar 25 02:09:51 2005
75810000 758d0000 userenv Fri Mar 25 02:09:50 2005
75d00000 75d27000 apphelp Fri Mar 25 02:09:21 2005
76120000 7613d000 imm32 Fri Mar 25 02:09:37 2005
76140000 76188000 comdlg32 Fri Mar 25 02:10:11 2005
76810000 76949000 comsvcs Fri Aug 26 23:19:45 2005
76a60000 76a6b000 psapi Fri Mar 25 02:09:57 2005
76c00000 76c1a000 iphlpapi Fri May 19 04:21:07 2006
76de0000 76e0f000 dnsapi Wed Jul 12 20:02:12 2006
76e20000 76e4e000 wldap32 Fri Mar 25 02:09:59 2005
76e60000 76e73000 secur32 Fri Mar 25 02:10:01 2005
76e80000 76e87000 winrnr Fri Mar 25 02:09:45 2005
Please purchase PDF Split-Merge on www.verypdf.com to remove this watermark.
312 PART 3: Crash Dump Analysis Patterns
76e90000 76e98000 rasadhlp Wed Jul 12 20:02:15 2006
76f20000 77087000 comres Wed Mar 26 03:33:48 2003
77330000 773c7000 comctl32 Mon Aug 28 09:26:02 2006
77470000 775a4000 ole32 Thu Jul 21 04:25:12 2005
77640000 776c3000 clbcatq Thu Jul 21 04:25:13 2005
77b30000 77b38000 version Fri Mar 25 02:09:50 2005
77b40000 77b9a000 msvcrt Fri Mar 25 02:11:59 2005
77ba0000 77be8000 gdi32 Tue Mar 07 03:55:05 2006
77bf0000 77c8f000 rpcrt4 Fri Mar 25 02:09:42 2005
77ca0000 77da3000 comctl32_77ca0000 Mon Aug 28 09:25:59 2006
77db0000 77dc1000 winsta Fri Mar 25 02:09:51 2005
77de0000 77e71000 user32 Fri Mar 25 02:09:49 2005
77e80000 77ed2000 shlwapi Wed Sep 20 01:33:12 2006
77ee0000 77ef1000 regapi Fri Mar 25 02:09:51 2005
77f20000 77fcb000 advapi32 Fri Mar 25 02:09:06 2005
780a0000 780b2000 MSVCIRT Wed Jun 17 19:45:46 1998
780c0000 78121000 MSVCP60 Wed Jun 17 19:52:10 1998
79040000 79085000 fusion Fri Feb 18 20:57:41 2005
79170000 79198000 mscoree Fri Feb 18 20:57:48 2005
791b0000 79417000 mscorwks Fri Feb 18 20:59:56 2005
79510000 79523000 mscorsn Fri Feb 18 20:30:38 2005
79780000 7998c000 mscorlib Fri Feb 18 20:48:36 2005
79990000 79cce000 mscorlib_79990000 Thu Nov 02 04:53:27 2006
7c340000 7c396000 msvcr71 Fri Feb 21 12:42:20 2003
7c800000 7c93e000 kernel32 Tue Jul 25 13:37:16 2006
7c940000 7ca19000 ntdll Fri Mar 25 02:09:53 2005
7ca20000 7d20a000 shell32 Thu Jul 13 13:58:56 2006
Note: we can use lmtD command to take the advantage of WinDbg hypertext
commands. In that case we can quickly click on a module name to view its detailed
information.
We see that some components are very old, 1998-1999, and some are from
2006. We also see 3rd-party libraries: OpenGL, Visual Fortran RTL, Python language run-
time. Common system modules include two versions of C/C++ runtime library, 6.0 and
7.0. Specific system modules include MFC and .NET, MSJET, ODBC and OLE DB support.
There is a sign of DLL Hell (
here too. OLE Automation DLL in system32 folder seems to be very old and doesn’t
correspond to Windows 2003 SP1 which should have file version 5.2.3790.1830:
0:001> lmv m OLEAUT32
start end module name
65340000 653d2000 OLEAUT32 (deferred)
Image path: C:\WINDOWS\system32\OLEAUT32.DLL
Image name: OLEAUT32.DLL
Timestamp: Wed Sep 01 00:15:11 1999 (37CC61FF)
CheckSum: 0009475A
ImageSize: 00092000
File version: 2.40.4277.1
Please purchase PDF Split-Merge on www.verypdf.com to remove this watermark.