Tài liệu Memory Dump Analysis Anthology- P14 docx
Bạn đang xem bản rút gọn của tài liệu. Xem và tải ngay bản đầy đủ của tài liệu tại đây (700.29 KB, 30 trang )
Coincidental Symbolic Information 391
00b1ed18 00720065
00b1ed1c 005b0020
00b1ed20 00500055
00b1ed24 003a0044
00b1ed28 00430050 Application!Print::DocumentLoad+0x5f
00b1ed2c 0035004c
00b1ed30 005d0063
00b1ed34 00630000
...
...
...
However this is the pure coincidence. The data pattern 00NN00NN clearly be-
longs to a Unicode string:
0:020> du 00b1ed00
00b1ed00 "ocument Loader [UPD:PCL5c]"
It just happens that 00430050 value can be interpreted as an address that falls
into Application module address range and its code section:
0:020> lm
start end module name
00400000 0044d000 Application
In the second example, the crash dump is from some 3rd-party application called
AppSql for which we don’t have PDB files. Also we know that myhook.dll is installed as a
system wide hook and it had some problems in the past. It is loaded into any address
space but is not necessarily used. We want to see if there are traces of it on the problem
thread stack. Dumping stack contents shows us the only one reference:
...
...
...
00118cb0 37302f38
00118cb4 00000000
00118cb8 10008e00 myhook!notify_me+0×22c
00118cbc 01400000
00118cc0 00118abc
00118cc4 06a129f0
00118cc8 00118d04
00118ccc 02bc57d0
00118cd0 04ba5d74
00118cd4 00118d30
00118cd8 0000001c
00118cdc 00000010
00118ce0 075922bc
00118ce4 04a732e0
00118ce8 075922bc
Please purchase PDF Split-Merge on www.verypdf.com to remove this watermark.
392 PART 3: Crash Dump Analysis Patterns
00118cec 04a732e0
00118cf0 0066a831 AppSql+0×26a831
00118cf4 04a732d0
00118cf8 02c43190
00118cfc 00000001
00118d00 0000001c
00118d04 00118d14
00118d08 0049e180 AppSql+0×9e180
00118d0c 02c43190
00118d10 0000001c
00118d14 00118d34
…
…
…
0:020> lm
start end module name
00400000 00ba8000 AppSql
...
...
...
10000000 100e0000 myhook
The address 10008e00 looks very “round” and it might be the set of bit flags and
also, if we disassemble the code at this address backwards, we don’t see the usual call
instruction that saved that address on the stack:
0:000> ub 10008e00
myhook!notify_me+0x211
10008de5 81c180000000 add ecx,80h
10008deb 899578ffffff mov dword ptr [ebp-88h],edx
10008df1 89458c mov dword ptr [ebp-74h],eax
10008df4 894d98 mov dword ptr [ebp-68h],ecx
10008df7 6a01 push 1
10008df9 8d45ec lea eax,[ebp-14h]
10008dfc 50 push eax
10008dfd ff75e0 push dword ptr [ebp-20h]
In contrast, the other two addresses are return addresses saved on the stack:
0:000> ub 0066a831
AppSql+0x26a81e:
0066a81e 8bfb mov edi,ebx
0066a820 f3a5 rep movs dword ptr es:[edi],dword ptr [esi]
0066a822 8bca mov ecx,edx
0066a824 83e103 and ecx,3
0066a827 f3a4 rep movs byte ptr es:[edi],byte ptr [esi]
0066a829 8b00 mov eax,dword ptr [eax]
0066a82b 50 push eax
0066a82c e8affeffff call AppSql+0×26a6e0 (0066a6e0)
Please purchase PDF Split-Merge on www.verypdf.com to remove this watermark.
Coincidental Symbolic Information 393
0:000> ub 0049e180
AppSql+0x9e16f:
0049e16f cc int 3
0049e170 55 push ebp
0049e171 8bec mov ebp,esp
0049e173 8b4510 mov eax,dword ptr [ebp+10h]
0049e176 8b4d0c mov ecx,dword ptr [ebp+0Ch]
0049e179 50 push eax
0049e17a 51 push ecx
0049e17b e840c61c00 call AppSql+0×26a7c0 (0066a7c0)
Therefore the appearance of myhook!notify_me+0×22c could be a coinci-
dence unless it was a pointer to a function. However, if it was the function pointer ad-
dress then it wouldn’t have pointed to the middle of the function call sequence that
pushes arguments:
0:000> ub 10008e00
myhook!notify_me+0x211
10008de5 81c180000000 add ecx,80h
10008deb 899578ffffff mov dword ptr [ebp-88h],edx
10008df1 89458c mov dword ptr [ebp-74h],eax
10008df4 894d98 mov dword ptr [ebp-68h],ecx
10008df7 6a01 push 1
10008df9 8d45ec lea eax,[ebp-14h]
10008dfc 50 push eax
10008dfd ff75e0 push dword ptr [ebp-20h]
0:000> u 10008e00
myhook!notify_me+0×22c
10008e00 e82ff1ffff call myhook!copy_data (10007f34)
10008e05 8b8578ffffff mov eax,dword ptr [ebp-88h]
10008e0b 3945ac cmp dword ptr [ebp-54h],eax
10008e0e 731f jae myhook!notify_me+0×25b (10008e2f)
10008e10 8b4598 mov eax,dword ptr [ebp-68h]
10008e13 0fbf00 movsx eax,word ptr [eax]
10008e16 8945a8 mov dword ptr [ebp-58h],eax
10008e19 8b45e0 mov eax,dword ptr [ebp-20h]
Also, because we have source code and private symbols, we know that if it was a
function pointer then it would have been myhook!notify_me address and not
notify_me+0×22c address.
All this evidence supports the hypothesis that myhook occurrence on the prob-
lem stack is just the coincidence and should be ignored.
To add, the most coincidental symbolic information I have found so far in one
crash dump is accidental correspondence between exported _DebuggerHookData and
the location of the postmortem debugger NTSD:
Please purchase PDF Split-Merge on www.verypdf.com to remove this watermark.
394 PART 3: Crash Dump Analysis Patterns
002dd434 003a0043
002dd438 0057005c
002dd43c 004e0049 LegacyApp!_DebuggerHookData+0xc4a5
002dd440 004f0044 LegacyApp!_DebuggerHookData+0×1c4a0
002dd444 00530057
002dd448 0073005c
002dd44c 00730079
002dd450 00650074
002dd454 0033006d
002dd458 005c0032
002dd45c 0074006e
002dd460 00640073
002dd464 0065002e
002dd468 00650078
0:000> du 002dd434
002dd434 ―C:\WINDOWS\system32\ntsd.exe‖
Please purchase PDF Split-Merge on www.verypdf.com to remove this watermark.
Stack Trace 395
STACK TRACE
The most important pattern that is used for problem identification and resolution
is Stack Trace. Consider the following fragment of !analyze -v output from w3wp.exe
crash dump:
STACK_TEXT:
WARNING: Frame IP not in any known module. Following frames may be wrong.
1824f90c 5a39f97e 01057b48 01057bd0 5a3215b4 0x0
1824fa50 5a32cf7c 01057b48 00000000 79e651c0
w3core!ISAPI_REQUEST::SendResponseHeaders+0x5d
1824fa78 5a3218ad 01057bd0 79e651c0 79e64d9c
w3isapi!SSFSendResponseHeader+0xe0
1824fae8 79e76127 01057bd0 00000003 79e651c0
w3isapi!ServerSupportFunction+0x351
1824fb0c 79e763a3 80000411 00000000 00000000
aspnet_isapi!HttpCompletion::ReportHttpError+0x3a
1824fd50 79e761c3 34df6cf8 79e8e42f 79e8e442
aspnet_isapi!HttpCompletion::ProcessRequestInManagedCode+0x1d1
1824fd5c 79e8e442 34df6cf8 00000000 00000000
aspnet_isapi!HttpCompletion::ProcessCompletion+0x24
1824fd70 791d6211 34df6cf8 18e60110 793ee0d8
aspnet_isapi!CorThreadPoolWorkitemCallback+0x13
1824fd84 791d616a 18e60110 00000000 791d60fa
mscorsvr!ThreadpoolMgr::ExecuteWorkRequest+0x19
1824fda4 791fe95c 00000000 8083d5c7 00000000
mscorsvr!ThreadpoolMgr::WorkerThreadStart+0x129
1824ffb8 77e64829 17bb9c18 00000000 00000000
mscorsvr!ThreadpoolMgr::intermediateThreadProc+0x44
1824ffec 00000000 791fe91b 17bb9c18 00000000 kernel32!BaseThreadStart+0x34
Ignoring the first 5 numeric columns gives us the following trace:
0x0
w3core!ISAPI_REQUEST::SendResponseHeaders+0x5d
w3isapi!SSFSendResponseHeader+0xe0
w3isapi!ServerSupportFunction+0x351
aspnet_isapi!HttpCompletion::ReportHttpError+0x3a
aspnet_isapi!HttpCompletion::ProcessRequestInManagedCode+0x1d1
aspnet_isapi!HttpCompletion::ProcessCompletion+0x24
aspnet_isapi!CorThreadPoolWorkitemCallback+0x13
mscorsvr!ThreadpoolMgr::ExecuteWorkRequest+0x19
mscorsvr!ThreadpoolMgr::WorkerThreadStart+0x129
mscorsvr!ThreadpoolMgr::intermediateThreadProc+0x44
kernel32!BaseThreadStart+0x34
Please purchase PDF Split-Merge on www.verypdf.com to remove this watermark.
396 PART 3: Crash Dump Analysis Patterns
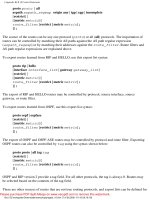
In general we have something like this:
moduleA!functionX+offsetN
moduleB!functionY+offsetM
...
...
...
Sometimes function names are not available or offsets are very big like 0×2380. If
this is the case then we probably don’t have symbol files for moduleA and moduleB:
moduleA+offsetN
moduleB+offsetM
...
...
...
Usually there is some kind of a database of previous issues we can use to
match moduleA!functionX+offsetN against. If there is no such match we can try
functionX+offsetN, moduleA!functionX or just functionX. If there is no such match again
we can try the next signature, moduleB!functionY+offsetM, and moduleB!functionY, etc.
Usually, the further down the trace the less useful the signature is for problem resolu-
tion. For example, mscorsvr!ThreadpoolMgr::WorkerThreadStart+0x129 will probably
match many issues because this signature is common for many ASP.NET applications.
If there is no match in internal databases we can try Google. For our exam-
ple, Google search for SendResponseHeaders+0x5d gives the following search results:
Please purchase PDF Split-Merge on www.verypdf.com to remove this watermark.
Stack Trace 397
Browsing search results reveals the following discussion:
/>ead/34bc2be635b26531?tvc=1
which can be found directly by searching Google groups:
Another example is from BSOD complete memory dump. Analysis command has
the following output:
MODE_EXCEPTION_NOT_HANDLED (1e)
This is a very common bugcheck. Usually the exception address pinpoints
the driver/function that caused the problem. Always note this address as
well as the link date of the driver/image that contains this address.
Arguments:
Arg1: c0000005, The exception code that was not handled
Arg2: bff90ca3, The address that the exception occurred at
Arg3: 00000000, Parameter 0 of the exception
Arg4: 00000000, Parameter 1 of the exception
TRAP_FRAME: bdf80834 -- (.trap ffffffffbdf80834)
ErrCode = 00000000
eax=00000000 ebx=bdf80c34 ecx=89031870 edx=88096928 esi=88096928
edi=8905e7f0
eip=bff90ca3 esp=bdf808a8 ebp=bdf80a44 iopl=0 nv up ei ng nz na po nc
cs=0008 ss=0010 ds=0023 es=0023 fs=0030 gs=0000 efl=00010282
tsmlvsa+0xfca3:
bff90ca3 8b08 mov ecx,dword ptr [eax] ds:0023:00000000=????????
Resetting default scope
Please purchase PDF Split-Merge on www.verypdf.com to remove this watermark.
398 PART 3: Crash Dump Analysis Patterns
STACK_TEXT:
bdf807c4 80467a15 bdf807e0 00000000 bdf80834 nt!KiDispatchException+0x30e
bdf8082c 804679c6 00000000 bdf80860 804d9f69
nt!CommonDispatchException+0x4d
bdf80838 804d9f69 00000000 00000005 e56c6946
nt!KiUnexpectedInterruptTail+0x207
00000000 00000000 00000000 00000000 00000000 nt!ObpAllocateObject+0xe1
Because the crash point tsmlvsa+0xfca3 is not on the stack trace we use .trap
command:
1: kd> .trap ffffffffbdf80834
ErrCode = 00000000
eax=00000000 ebx=bdf80c34 ecx=89031870 edx=88096928 esi=88096928
edi=8905e7f0
eip=bff90ca3 esp=bdf808a8 ebp=bdf80a44 iopl=0 nv up ei ng nz na po nc
cs=0008 ss=0010 ds=0023 es=0023 fs=0030 gs=0000 efl=00010282
tsmlvsa+0xfca3:
bff90ca3 8b08 mov ecx,dword ptr [eax] ds:0023:00000000=????????
1: kd> k
*** Stack trace for last set context - .thread/.cxr resets it
ChildEBP RetAddr
WARNING: Stack unwind information not available. Following frames may be
wrong.
00000000 bdf80afc tsmlvsa+0xfca3
89080c00 00000040 nt!ObpLookupObjectName+0x504
00000000 00000001 nt!ObOpenObjectByName+0xc5
c0100080 0012b8d8 nt!IopCreateFile+0x407
c0100080 0012b8d8 nt!IoCreateFile+0x36
c0100080 0012b8d8 nt!NtCreateFile+0x2e
c0100080 0012b8d8 nt!KiSystemService+0xc9
c0100080 0012b8d8 ntdll!NtCreateFile+0xb
c0000000 00000000 KERNEL32!CreateFileW+0x343
1: kd> lmv m tsmlvsa
bff81000 bff987c0 tsmlvsa (no symbols)
Loaded symbol image file: tsmlvsa.sys
Image path: tsmlvsa.sys
Image name: tsmlvsa.sys
Timestamp: Thu Mar 18 06:18:51 2004 (40593F4B)
CheckSum: 0002D102
ImageSize: 000177C0
Translations: 0000.04b0 0000.04e0 0409.04b0 0409.04e0
Google search for tsmlvsa+0xfca3 fails but if we search just for tsmlvsa we get
the first link towards problem resolution:
Please purchase PDF Split-Merge on www.verypdf.com to remove this watermark.
Stack Trace 399
Please purchase PDF Split-Merge on www.verypdf.com to remove this watermark.
400 PART 3: Crash Dump Analysis Patterns
VIRTUALIZED PROCESS (WOW64)
Sometimes we get a process dump from x64 Windows and when we load it into
WinDbg we get the output telling us that an exception or a breakpoint comes from
wow64.dll. For example:
Loading Dump File [X:\ppid2088.dmp]
User Mini Dump File with Full Memory: Only application data is available
Comment: 'Userdump generated complete user-mode minidump with Exception
Monitor function on SERVER01'
Symbol search path is:
srv*c:\mss*
Executable search path is:
Windows Server 2003 Version 3790 (Service Pack 2) MP (4 procs) Free x64
Product: Server, suite: TerminalServer
Debug session time: Tue Sep 4 13:36:14.000 2007 (GMT+2)
System Uptime: 6 days 3:32:26.081
Process Uptime: 0 days 0:01:54.000
WARNING: tsappcmp overlaps ws2_32
WARNING: msvcp60 overlaps oleacc
WARNING: tapi32 overlaps rasapi32
WARNING: rtutils overlaps rasman
WARNING: dnsapi overlaps rasapi32
WARNING: wldap32 overlaps dnsapi
WARNING: ntshrui overlaps userenv
WARNING: wtsapi32 overlaps dnsapi
WARNING: winsta overlaps setupapi
WARNING: activeds overlaps rtutils
WARNING: activeds overlaps rasman
WARNING: adsldpc overlaps activeds
WARNING: drprov overlaps apphelp
WARNING: netui1 overlaps netui0
WARNING: davclnt overlaps apphelp
...
This dump file has an exception of interest stored in it.
The stored exception information can be accessed via .ecxr.
(2088.2fe4): Unknown exception - code 000006d9 (first/second chance not
available)
wow64!Wow64NotifyDebugger+0×9:
00000000`6b006369 b001 mov al,1
Analysis shows that the run-time exception was raised but the stack trace shows
only WOW64 CPU simulation code in all process threads:
Please purchase PDF Split-Merge on www.verypdf.com to remove this watermark.
Virtualized Process (WOW64) 401
0:000> !analyze -v
*********************************************************
* *
* Exception Analysis *
* *
*********************************************************
FAULTING_IP:
kernel32!RaiseException+53
00000000`7d4e2366 5e pop rsi
EXCEPTION_RECORD: ffffffffffffffff -- (.exr 0xffffffffffffffff)
ExceptionAddress: 000000007d4e2366
(kernel32!RaiseException+0x0000000000000053)
ExceptionCode: 000006d9
ExceptionFlags: 00000001
NumberParameters: 0
DEFAULT_BUCKET_ID: STACK_CORRUPTION
PROCESS_NAME: App.exe
ERROR_CODE: (NTSTATUS) 0x6d9 - There are no more endpoints available from
the endpoint mapper.
NTGLOBALFLAG: 0
APPLICATION_VERIFIER_FLAGS: 0
LAST_CONTROL_TRANSFER: from 000000006b0064f2 to 000000006b006369
FOLLOWUP_IP:
wow64!Wow64NotifyDebugger+9
00000000`6b006369 b001 mov al,1
SYMBOL_STACK_INDEX: 0
SYMBOL_NAME: wow64!Wow64NotifyDebugger+9
FOLLOWUP_NAME: MachineOwner
MODULE_NAME: wow64
IMAGE_NAME: wow64.dll
DEBUG_FLR_IMAGE_TIMESTAMP: 45d6943d
FAULTING_THREAD: 0000000000002fe4
Please purchase PDF Split-Merge on www.verypdf.com to remove this watermark.
402 PART 3: Crash Dump Analysis Patterns
PRIMARY_PROBLEM_CLASS: STACK_CORRUPTION
BUGCHECK_STR: APPLICATION_FAULT_STACK_CORRUPTION
STACK_COMMAND: ~0s; .ecxr ; dt ntdll!LdrpLastDllInitializer BaseDllName ;
dt ntdll!LdrpFailureData ; kb
FAILURE_BUCKET_ID: X64_APPLICATION_FAULT_STACK_CORRUPTION_wow64!Wow64Noti
fyDebugger+9
BUCKET_ID: X64_APPLICATION_FAULT_STACK_CORRUPTION_wow64!Wow64NotifyDebugg
er+9
Followup: MachineOwner
---------
0:000> ~*k
. 0 Id: 2088.2fe4 Suspend: 1 Teb: 00000000`7efdb000 Unfrozen
Child-SP RetAddr Call Site
00000000`0016e190 00000000`6b0064f2 wow64!Wow64NotifyDebugger+0x9
00000000`0016e1c0 00000000`6b006866 wow64!Wow64KiRaiseException+0x172
00000000`0016e530 00000000`78b83c7d wow64!Wow64SystemServiceEx+0xd6
00000000`0016edf0 00000000`6b006a5a wow64cpu!ServiceNoTurbo+0x28
00000000`0016ee80 00000000`6b005e0d wow64!RunCpuSimulation+0xa
00000000`0016eeb0 00000000`77ed8030 wow64!Wow64LdrpInitialize+0x2ed
00000000`0016f3f0 00000000`77ed582f ntdll!LdrpInitializeProcess+0x1538
00000000`0016f6f0 00000000`77ef30a5 ntdll!LdrpInitialize+0x18f
00000000`0016f7d0 00000000`7d4d1510 ntdll!KiUserApcDispatcher+0x15
00000000`0016fcc8 00000000`00000000 kernel32!BaseProcessStartThunk
00000000`0016fcd0 00000000`00000000 0x0
00000000`0016fcd8 00000000`00000000 0x0
00000000`0016fce0 00000000`00000000 0x0
00000000`0016fce8 00000000`00000000 0x0
00000000`0016fcf0 00000000`00000000 0x0
00000000`0016fcf8 00000000`00000000 0x0
00000000`0016fd00 00010007`00000000 0x0
00000000`0016fd08 00000000`00000000 0x10007`00000000
00000000`0016fd10 00000000`00000000 0x0
00000000`0016fd18 00000000`00000000 0x0
1 Id: 2088.280c Suspend: 1 Teb: 00000000`7efd8000 Unfrozen
Child-SP RetAddr Call Site
00000000`0200f0d8 00000000`6b006a5a wow64cpu!WaitForMultipleObjects32+0x3a
00000000`0200f180 00000000`6b005e0d wow64!RunCpuSimulation+0xa
00000000`0200f1b0 00000000`77f109f0 wow64!Wow64LdrpInitialize+0x2ed
00000000`0200f6f0 00000000`77ef30a5 ntdll!LdrpInitialize+0x2aa
00000000`0200f7d0 00000000`7d4d1504 ntdll!KiUserApcDispatcher+0x15
00000000`0200fcc8 00000000`00000000 kernel32!BaseThreadStartThunk
00000000`0200fcd0 00000000`00000000 0x0
00000000`0200fcd8 00000000`00000000 0x0
Please purchase PDF Split-Merge on www.verypdf.com to remove this watermark.