Banks CAMEL 05 07 ( Commercial Bank) Tài liệu Tiếng Anh tham khảo môn Ngân hàng Thương Mại
Bạn đang xem bản rút gọn của tài liệu. Xem và tải ngay bản đầy đủ của tài liệu tại đây (1.42 MB, 29 trang )
Vietnam Banks
July 5, 2019
CAMEL Analysis – The good, the bad, and the chronically mispriced
Ranking the 17 listed banks on our fundamental framework
CAMEL analysis: A fundamental framework for understanding and ranking commercial bank operations. In this report we
examine the entire universe of 17 listed Vietnamese banks based on the old-school CAMEL framework, a fundamental approach
to analyzing banks that focuses on Capital, Asset quality, Management, Earnings, and Liquidity. Our analysis is based on 2018A
audited financial statements and seven-year trends in 67 bank-related metrics (largely financial ratios). Not surprisingly, the results
are a mixed bag: asset quality has improved notably across the sector in recent years, but balance sheets remain highly leveraged
and the liability structure of most banks is somewhat less than ideal.
Stock implications. A bank’s CAMEL score does not by itself imply that the stock is a “Buy” or “Sell”. Valuations and future
expectations of business performance are critical to make that decision. Also, our reliance on FiinPro data for this exercise has
limitations common to all data aggregators; a closer examination of the individual banks’ published disclosures and discussions
with management teams are required for a more complete understanding. However, the CAMEL framework provides us with a good
platform to search for hidden diamonds and/or lumps of coal, as well as a solid reference on the overall sector trends. Among the
four banks in our coverage universe, we continue to recommend a barbell strategy comprising 1) a core long position in VCB as a
proxy on Vietnam’s economic development and 2) an allocation to STB as an undervalued turnaround play (think risk-reward).
Themes and catalysts
Tanh Tran
Banks Analyst
Matthew Smith, CFA
Head of Institutional Research
TCB
1.9
2.1
VCB
2.1
ACB
VIB
VPB
STB
HDB
2.6
2.8
2.9
3.0
3.0
KLB
3.2
BID
3.2
EIB
3.2
BAB
3.2
CTG
3.4
NAB
3.5
LPB
3.5
SHB
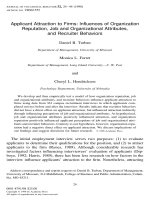
Source: Yuanta Vietnam
Hunting for quality. The sector is
thinly capitalized and poorly funded.
Basel 2 looms, although
forbearance appears likely.
Asset quality has improved
markedly in recent years.
Solvency capital is likely to remain
a key theme. FOL rules reduce the
options; NVDRs would help.
ALM matters. Stable funding
requirements are wise, but will
pressure NIMs.
Asset quality has improved,
but watch consumer finance.
Implications for investors? We believe that banks with stronger CAMEL rankings
deserve a premium valuation relative to weaker banks. This is the case with VCB,
which scores highly and trades at a sector-high 4.2x 2018 P/BV (source: Bloomberg).
By contrast, MBB trades at just 1.5x 2018 P/BV despite generating the same CAMEL
score as VCB. We almost hesitate to mention TCB (Not Rated), but its sector-high
CAMEL score of 1.9 doesn’t match up to its 1.5x P/BV valuation either.
2.3
TPB
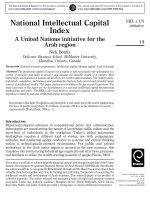
Ranking the banks. In our opinion, bank analysis is a mix of science and art. This
view is reflected in our application of the CAMEL model, an old-school fundamental
analytical framework that takes a bottom-up approach based on quantifiable metrics
(i.e., ratio analysis) with a dash of qualitative judgement. The overall results can be
seen in the chart at left. Note that lower scores representing stronger quality.
CAMEL Rankings
MBB
Risks
3.6
FOL cap drives the anomaly. We attribute the mismatch between fundamentals and
valuation to market inefficiencies created by these banks’ full FOL status. This anomaly
may eventually correct as the market develops (NVDRs might represent a solution).
But reaping the potential rewards is likely to require patience, and foreign investors
must also consider the risks related to FOL premiums and settlement issues.
Ultimately, this exercise bolsters our cautious tactical view on full-FOL stocks.
Vietnam Banks
Yuanta Vietnam Coverage Universe
Market 3-month
Current Target
Up
2019E
Stock
cap
ADT
Yuanta
price
price
(down) Dividend
12-m
Sector
Company
code
(USDm) (USDm)
Rating
(VND)
(VND)
side
yield
TSR*
Banks
BIDV
BID VN
4,722
1.3
BUY
32,100
38,713
21%
2.7%
23%
MB Bank
MBB VN
1,910
2.0
BUY
21,000
29,889
42%
3.4%
46%
Sacombank
STB VN
881
1.4
BUY
11,350
14,101
24%
0.4%
25%
Vietcombank
VCB VN 11,107
1.9
BUY
69,600
75,275
8%
1.4%
10%
Brokers
HCM City Securities
HCM VN
312
0.5
BUY
23,700
36,219
53%
3.9%
57%
Saigon Securities
SSI VN
544
1.3
HOLD
24,850
26,125
5%
4.1%
9%
Viet Capital Securities VCI VN
216
0.2
BUY
30,800
43,850
42%
4.0%
46%
VNDirect Securities
VND VN
136
0.3
BUY
15,100
21,029
39%
4.5%
44%
Consumer Masan Group
MSN VN
4,250
1.4
BUY
84,500
93,035
10%
1.8%
12%
Phu Nhuan Jewelry
PNJ VN
706
1.6
BUY
73,700 118,489
61%
2.7%
63%
Digiworld
DGW VN
39
0.3
BUY
21,850
31,574
45%
5.4%
50%
Oil & GAS PV Drilling
PVD VN
306
3.1
BUY
18,600
24,535
32%
2.7%
35%
Property
Nam Long
NLG VN
298
1.2
BUY
29,000
32,000
10%
1.7%
12%
Vinhomes
VHM VN 13,123
3.3
BUY
82,000
94,860
16%
1.2%
17%
*Note: TSR = Total shareholder return over the next 12 months inclusive of expected share price change and dividends.
Pricing data as of close on July 3, 2019.
TABLE OF CONTENTS
The CAMEL Framework overview…………………………………………………………………………………………………………………………... 3
Implications for Investors……………………………………………………………………………………………………………...……………………... 4
FOL cap drives the anomaly……………………………………………………………………………………………...…………………………….….... 5
The CAMEL Framework: Bank Analysis 101……………………………………………………………………………………………...………….….... 5
CAMEL Ratings…………………………………………………………………………………………………………………………...…...……..….….. 10
ACB…………………………………………………………………………………………………………………………...…...……………………...….. 11
BAB…………………………………………………………………………………………………………………………...…...……………………...….. 12
BID…………………………………………………………………………………………………………………………...…...………….…………...….. 13
CTG…………………………………………………………………………………………………………………………...…...……………………........ 14
EIB.…………………………………………………………………………………………………………………………...…...……………………...….. 15
HDB…………………………………………………………………………………………………………………………...…...…...………………...….. 16
KLB…………………………………………………………………………………………………………………………...…...……………………...….. 17
LPB…………………………………………………………………………………………………………………………...…...……………………...….. 18
MBB…………………………………………………………………………………………………………………………...…...………………...…...….. 19
NAB…………………………………………………………………………………………………………………………...…...……………………...….. 20
SHB…………………………………………………………………………………………………………………………...…...……………………...….. 21
STB…………………………………………………………………………………………………………………………...…...……………………...….. 22
TCB…………………………………………………………………………………………………………………………...…...……………………...….. 23
TPB…………………………………………………………………………………………………………………………...…...……………………...….. 24
VCB…………………………………………………………………………………………………………………………...…...……………………...….. 25
VIB…………………………………………………………………………………………………………………………...…...……………………...…... 26
VPB…………………………………………………………………………………………………………………………...…...……………………...….. 27
Page 2
Vietnam Banks
The CAMEL framework: An old-school fundamental approach to
analyze the Vietnam banks
In this report, we introduce our preferred framework for analyzing commercial banks: the CAMEL
model. In our view, the role of a bank analyst is a healthy (and occasionally dismal) mix of science
and art. This is reflected in our application of the CAMEL model, which is a fundamental analytical
framework that takes a bottom-up approach based largely on quantifiable metrics (i.e., ratio
analysis) with a dash of qualitative judgement on the part of the analyst.
The CAMEL framework is an old-school fundamental approach; we consider it to be akin to “Bank
Analysis 101”. The five components examined by the framework are (C) capital adequacy, (A)
asset quality, (M) management capability, (E) earnings, and (L) liquidity. In this report, the ratios
are calculated based on historical full-year annual financial statements for all of the banks,
including the four stocks in our coverage and the 13 banks for which we do not yet have a rating.
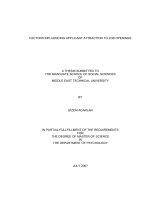
We delve into the details below, but a quick summary of the results of our analysis of Vietnam’s
17 banks is exhibited in the chart below. Each bank’s CAMEL score represents its weighted
ranking on some 67 metrics (largely financial ratios) related to each of the framework’s five
components. Ratings for each bank are applied within a range of 1 (best) to 5 (worst) for each
metric, and each metric is weighted based on our perception of its importance in understanding
the banks.
Listed Vietnam Bank Rankings by CAMEL Scores
TCB
MBB
VCB
ACB
TPB
VIB
VPB
STB
HDB
KLB
BID
EIB
BAB
CTG
NAB
LPB
SHB
1.9
2.1
2.1
2.3
2.6
2.8
2.9
3.0
3.0
3.2
3.2
3.2
3.2
3.4
3.5
3.5
3.6
Source: Yuanta Vietnam
* Note: We define the CAMEL ratings of 1-5 as follows:
1: strong
2: satisfactory
3: weak
4: poor
5: unsatisfactory
Our analysis derives an average CAMEL score of 2.9 for the 17 listed banks, but with a healthy
range and rankings that will probably not surprise investors who are familiar with the Vietnam
banks. TCB (Not rated), MBB (BUY), and VCB (BUY) are at the top of the CAMEL rankings with
scores of 1.9-2.1, followed by ACB (Not rated) at 2.3. By contrast, SHB, LPB, and NAB (all nonrated by Yuanta) are positioned at the bottom with a less impressive average score of 3.5.
Page 3
Vietnam Banks
Notably, STB (BUY – and one of our top picks along with CAMEL leader VCB) does not score
particularly well. This should perhaps come as no surprise given its 20% ratio of non-performing
assets to total assets, which is clearly not a great number. Our positive view on STB is based on
our expectation that its turnaround efforts will succeed, and we believe that the bank’s CAMEL
score is likely to improve substantially in the years ahead (as will its share price, in our view).
Weighted ratings for each component of the CAMEL model
SUMMARY
Capital Adequacy
Asset Quality
Management
Earnings
Liquidity
CAMEL Score
ACB
3.0
1.7
2.1
2.1
2.4
2.3
BAB
3.3
2.0
4.0
3.8
3.0
3.2
BID
3.7
3.4
3.4
3.4
2.2
3.2
CTG
4.4
2.3
3.6
4.0
2.6
3.4
EIB
3.4
3.0
3.5
3.7
2.4
3.2
HDB
3.4
3.1
3.0
1.88
3.8
3.0
KLB
2.9
2.6
3.3
3.9
3.3
3.2
LPB
3.9
2.8
3.8
3.9
3.2
3.5
MBB
2.1
2.2
2.0
1.8
2.3
2.1
NAB
4.3
2.4
3.8
3.6
3.3
3.5
SHB
3.7
3.9
3.2
3.9
3.5
3.6
STB
3.6
2.9
2.4
3.7
2.2
3.0
TCB
1.6
2.8
1.7
1.4
2.1
1.9
TPB
2.9
2.3
2.2
1.8
3.6
2.6
VCB
2.9
1.5
2.6
2.0
1.6
2.1
VIB
2.6
3.6
2.0
1.9
3.8
2.8
VPB
2.2
3.9
2.5
2.3
3.7
2.9
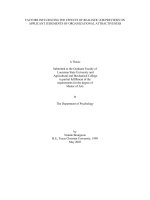
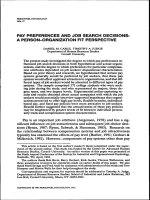
Implications for investors?
We believe in our fundamentalist hearts that banks with stronger CAMEL rankings deserve a
premium valuation relative to weaker banks. This should be intuitive – stronger banks are more
likely to create value over time, and investors in an efficient market should recognize this and
price it into such banks’ stock valuations.
This is the clearly case for VCB, which both scores highly on our CAMEL framework and trades
at a sector-high 4.2x 2018 P/BV (source: Bloomberg). The same can be said for the banks with
less-optimal scores, which tend to trade at relatively low valuations.
However, this happy coincidence with market efficiency does not appear to be universal across
the banks. For example, MBB trades at just 1.5x 2018 P/BV despite generating the same CAMEL
score as VCB. We almost hesitate to mention TCB (Not Rated), but its sector-high CAMEL score
of 1.9 doesn’t appear to be reflected in its 1.5x P/BV valuation. Of course, these prices are
typically only available to domestic investors; foreign investors would have to find a willing seller
who would no doubt demand a premium price for his/her full-FOL shares. Even so, the valuation
mismatch is striking.
2018A P/BV vs. CAMEL Scores
4.50
VCB
4.00
2018A
3.50
Red font indicates full FOL (or near-full FOL) stocks,
3.00
2.50
BID
TPB
2.00
HDB
1.50
BAB
EIB
VPB
TCB
ACB
1.00
CTG
MBB
VIB
0.50
STB
SHB
KLB
LPB
1.5
2.0
←Stronger,
2.5
3.0
CAMEL Scores
Weaker→
,,,,,,,,,,,,,,,,,,
3.5
4.0
Source: Bloomberg, Yuanta Vietnam
Page 4
Vietnam Banks
FOL cap drives the anomaly
We attribute the mismatch between fundamentals and valuation to market inefficiencies created
by these banks’ full FOL status. We think it is highly unlikely that domestic investors (who largely
determine the share prices and valuations exhibited in the chart above) are bearish on the
fundamentals of banks such as TCB and MBB. Instead we would argue that they are avoiding
these stocks due to their full-FOL status, which implies no further net buying by foreigners.
This anomaly may eventually correct as the market develops in the years ahead. For example,
the potential implementation of nonvoting depository receipts (NVDRs) might create a more
efficient pricing environment. If implemented, the capital-hungry banking sector is likely to be
among the early adopters of such instruments. The effect of NVDRs on existing FOL premiums
is perhaps worthy of consideration for investors holding full-FOL stocks, although the NVDR
pricing could also encompass existing premiums. We will reserve this particular guessing game
for subsequent consideration given that NVDR adoption is not likely to happen until 2H20 at the
very earliest (if it happens at all).
Our main point here is that reaping the potential rewards of high-quality full-FOL bank stocks is
likely to require patience among investors. Ultimately, if our CAMEL exercise does nothing else,
it bolsters our cautious tactical view on full-FOL stocks in Vietnam. For details, please see our
strategy note of April 9 titled Of FOLs and Money.
The CAMEL Framework: Banks Analysis 101
The CAMEL framework is an old-school fundamental approach; we consider it to be akin to “Bank
Analysis 101”. The five components examined by the framework are (C) capital adequacy, (A)
asset quality, (M) management capability, (E) earnings, and (L) liquidity. In this report, the ratios
are calculated based on historical full-year annual financial statements for all of the banks,
including the four stocks in our coverage and the 13 banks for which we do not yet have a rating.
In truth, each of these five components could (and probably should) be treated as a separate
theme, with a more thorough assessment than we provide here. However, as we are still in the
process of ramping up our coverage of the Vietnamese banks, we believe that a more general
overview of the aggregate data is an appropriate means of identifying opportunities in the banks
that may be worthy of greater focus. To be clear, we are not suggesting that bank with a high
CAMEL score is necessarily a “Buy”, nor that a low CAMEL score relegates a weaker bank to
“Sell” status. However, we believe that a rigorous fundamental overview of the banks is the best
place to start looking for such opportunities.
In an efficient market, banks with superior CAMEL scores would trade at higher multiples than
banks with lower CAMEL rankings. But of course, that doesn’t always happen; markets (not just
in Vietnam) are not always efficient, and stock investors often fail to recognize the underlying
trends in a bank’s fundamentals (i.e., improving or decaying). Thus, a thorough combination of
CAMEL analysis with an assessment of market valuation vs estimated fair value is likely to be a
winning investment strategy, in our opinion – and research coverage decisions are supported by
this approach.
Our assessment of the Vietnam banks comprises the calculation of 67 metrics (largely financial
ratios) corresponding to the five CAMEL components for each of the 17 listed banks. Based on
the ranges of these ratios among the banks (with some room for judgement calls on our part),
our model then generates a score (1-5, with 1 being the best) for each individual component at
each individual listed bank. Most of these scores are based on ratio analysis of the banks’ 2018
audited results, but we also give ourselves some flexibility for judgement based on improvement
or decay in their fundamental trends in recent years, or for items that are inherently difficult to
Page 5
Vietnam Banks
quantify (e.g., transparency of financial disclosures, or openness of investor relations
departments).
We then generate an overall ranking for each bank by calculating the average of the respective
bank’s component scores.
Crucially, the scores generated by this analysis only serve to rank each individual bank against
its peers – specifically, where its ratios fall within the range of the group of listed Vietnamese
banks. Extending our CAMEL analysis to include regional ASEAN banks would very likely
illustrate the weaknesses of Vietnam’s banking system in crucial items such as bank
capitalization, funding, and management. However, such a comparison is well beyond our scope
at this time.
The sections below present an introduction to the ratios and other measures that we have applied
for each component of the CAMEL analysis.
1) We apply a total of 13 metrics in ratings the banks’ balance sheet solvency capital.
Capital ratios and other measures
Ratio
Tier 1 CAR
Tier 2 CAR
CAR
Equity / Assets
Equity / Assets + Off BS
5 exposures
6 VAMC-adj equity / Adj Assets
7 Tangible Equity / Tangible Assets
8 VAMC adj TE / VAMC adj TA
9 Interbank / Assets
10 Loans / Assets
11 Current FOL room (%)
12 Basel II approval
13 Trend
Source: Yuanta Vietnam
1
2
3
4
Weight (%)
0%
0%
10%
15%
5%
5%
5%
5%
5%
5%
15%
15%
15%
Comment
Disclosure issues caused us to weight Tier 1 and 2 at zero
Disclosure issues caused us to weight Tier 1 and 2 at zero
Based on the Basel 1 approach (Circular 36)
Straightforward leverage.
Stripping out VAMC assets shows "clean book".
Intangible assets are a small component of VN bank balance sheets.
Historical practice of booking credit assets as "interbank" is less prevalent today.
Open FOL room means that a bank has greater flexibility to raise new capital.
Seven banks have achieved this so far (some won't be ready in 2020).
The recent trend is more important than a static snapshot.
These measures include several fairly straightforward items such as reported CAR ratios under
the Basel 1 approach with extra points for the seven listed banks that have achieved Basel 2
approval. We tried to include measures of Tier 1 and Tier 2 CAR, but weak disclosure standards
overcame our ambitions so we gave up that effort – for now. Other measures include straight
equity / assets, straight equity / assets plus off-balance sheet exposures, and tangible equity /
tangible assets.
In addition, we delved a bit deeper into a some of the standard ratios discussed above with
Vietnam bank-specific idiosyncrasies in mind. Thus, we also measured some of the capital ratios
after adjusting for VAMC exposures and “other assets”, including interest receivables. In addition,
we rate the banks with substantial remaining FOL room (foreign ownership room) more highly
than full-FOL banks when thinking about capital. This might be counterintuitive (the full-FOL
banks tend to be of better quality, right?). But foreign investment is the only obvious source of
new capital for a bank, and open FOL room implies greater flexibility for a bank to raise capital
than a that is already at full FOL.
Page 6
Vietnam Banks
2) We examine 16 metrics to rank the banks’ asset quality.
Asset quality ratios and measures
Ratio
1 SML ratio
2 Type 3 NPL ratio
3 Type 4 NPL ratio
4 Type 5 NPL ratio
5 NPL & SML ratio
6 Gross NPL ratio
7 Net NPL ratio
8 LLR / Gross loans
9 LLR / NPLs
10 GPs / Performing loans
11 SPs / NPLs
12 SPs / NPLs + SMLs
13 VAMC bonds / Assets
14 Accrued interest / Assets
15 Other receivables / Assets
16 Trend
Source: Yuanta Vietnam
Weight
5%
5%
5%
5%
5%
10%
5%
5%
10%
5%
5%
5%
5%
5%
5%
15%
Comment
Special mention loans (SMLs) are excluded from reported NPLs.
This reflects the amount of specific provisions.
Also known as NPL reserve coverage.
General provisions are a bullwark against future NPL formation.
Specific NPL coverage.
VAMC bonds = NPAs that have been converted pending resolution.
High levels of accrued interest are reflective of high NPAs.
High levels of "other receivables" are reflective of high NPAs.
The recent trend is more important than a static snapshot.
Most of these ratios are common to banks everywhere and are likely familiar to investors. The
Vietnam banks disclose their loan books on a five-tier scale of quality. Type 1 loans are
performing loans. Type 2 loans are special mention loans (SMLs), which are problematic assets
but are not included in the banks’ reported NPL figures. However, we think it makes sense to
consider the banks’ SMLs when assessing their asset quality. Loan Types 3, 4, and 5 are all
official NPLs, with Type 5 as the lowest ranked in terms of quality (i.e., a loss requiring 100%
provisioning). The gross NPL ratio represents the headline NPL number, but net NPLs (which
account for specific provisions that have already been recognized) are perhaps a more important
indicator of determining future credit costs.
We also present various measures of loan loss reserve (LLR) coverage to total loans, NPLs, and
NPLs plus SMLs. Items 13-15 are Vietnam-specific ratios that include VAMC bonds (i.e., NPLs
that have been transferred to the Vietnam AMC in line with a restructuring plan with the State
Bank of Vietnam), as well as accrued interest and “other receivables” – the latter of which, for a
few banks, include large proportions of assets that are nonperforming in economic terms. As a
general statement, we find that asset quality has improved markedly across the sector over the
past several years, in line with policy-led restructuring efforts post the 2011-12 banking crisis, a
reflation of the property market, and (we believe and hope) much-improved credit risk
management practices on the part of the banks.
3) Our assessment of management comprises 10 items. But to be fair, more thorough
examinations of the individual banks is probably required here.
Management ratios and other measures
Ratio
Weight
1
2
3
4
5
6
7
Fees / Adj income
Fees / Assets
Costs / Adj income
Costs / Assets
CASA growth
Credit costs / Assets
Credit cost adjusted NIM
10%
10%
10%
5%
15%
5%
15%
8
Governance rating
5%
9
Management acumen
10 Trend
Source: Yuanta Vietnam
10%
15%
Comment
Fee generation as a function of operational excellence.
Opex control is a key area where management can drive value.
Structural preference for banks that are focused on liability structure.
Are they lending, or giving it away?
NIM as a reflection of asset risks. Are they lending, or giving it away?
Based on items such as proactive disclosure, regulatory compliance, investor
relations.
More art than science, this is a judgement call based on and modifying the above.
The recent trend is more important than a static snapshot.
Page 7
Vietnam Banks
Based on our experience, we believe that bank managers are best able to drive long-term value
by focusing on defense – in other words, cost efficiencies and credit risk management, as well
as prioritizing cheap funding. A myopic focus on asset growth and asset market share rarely
impresses us. After all, the main product here is money, so finding a willing customer is not
particularly difficult (the tricky part is to ensure that you’re lending rather than giving it away).
Given the relatively undeveloped state of the Vietnamese banks, we also think that a focus on
generating fee income can also help banks to stand out in terms of returns on risk-weighted
capital.
Ultimately, however, forming a view on a bank’s management is a necessarily subjective process.
This component of the CAMEL framework is perhaps least well-served by our reliance on
aggregate data. A fair assessment of each bank’s management would require a closer bottomup focus as well as deeper conversations with the bankers to understand their operational plans
and forward strategies. The top-down approach that we apply for this exercise (i.e., our reliance
on the data aggregator FiinPro) is admittedly insufficient for a thorough assessment of all of the
management teams – but at least it’s a start.
4) We look at 15 metrics to assess the banks’ earnings.
Earnings ratios and other measures
Ratio
1
2
3
4
5
6
7
8
9
Weight
Comment
NIM
Fees / adj revenue
Investment inc / adj revenue
10%
10%
5%
Total adj non-int inc / adj revenue
5%
Cost / adj revenue
PPOP / Assets
Provisioning / assets
OROA
5%
10%
5%
10%
Other income / assets
5%
This is reported in "other income" on bank balance sheets but we see it as
credit-related.
5%
5%
0%
5%
5%
15%
Not meaningful for most of the Vietnam banks.
Used to calculate ROE
10 Pretax ROA
11 PAT ROA
12 Minority interests / assets
13 Average Leverage
14 PATMI ROE
15 Trend
Source: Yuanta Vietnam
NIM is a key major driver of earnings.
Fees are a minor driver of earnings but are a key driver of ROE.
Investment income is worth less in valuation terms, in our view.
We have stripped out "other income" here given its dominance by
nonoperating revenues, including loan loss recoveries.
Cost control is a key area where management can drive value.
Indicator of ongoing business operations for banks under restructuring.
The recent trend is more important than a static snapshot.
The 15 earnings metrics listed in the table above should be fairly straightforward. Bank earnings
(which are the key driver of balance sheet solvency) can be simplistically broken down as being
driven by four ratios: 1) net interest margin (NIM, or net interest income divided by assets), 2)
non-interest income to revenues, 3) operating costs to revenues, and 4) credit costs as defined
by provisioning as a percentage of assets. From these four ratios we derive an operating return
on assets (OROA) ratio which ignores taxes and one-off items but is useful in gauging underlying
bank profitability, especially when engaging in cross-bank comparisons as we have done in this
report. We also apply a high weighting to the ratio of pre-provisioning operating profit to average
assets (PPOP ROA) which is helpful in understanding the underlying profitability of a bank that
is engaged in NPL restructuring (such as STB).
The key Vietnam-specific change that we have made here is in handling “other income”. We
retain fees and investment income as “above the line” components of operating revenues, but
we strip out “other income”, which for many banks includes substantial credit cost recoveries and
other asset divestment gains. We think that this lumpy and occasionally large item obscures the
underlying operational trends and we also view loan loss recoveries as a credit cost item. Thus,
we adjust the reported P&L statements of the banks in our models by moving this item down to
Page 8
Vietnam Banks
the credit cost level. The bottom line is not affected, and we think this approach gives a more
accurate view on the operating trends of the banks.
5) Liquidity is a weak point with many banks, according to our 13 measures of the final
CAMEL component.
Liquidity ratios and other measures
Ratio
Weight
1
2
3
4
5
6
Gross LDR
Net LDR
Net VND LDR
Net FX LDR
Deposits / Assets
Deposits / Liabilities
7
Current accounts / Deposits
8
SOE deposit ratio
10%
5%
9
LTMT loans/Current deposits
10%
10
11
MT loans / Total loans
LT loans / Total loans
5%
5%
12
ST deposits / LTMT loans
10%
13 Trend
Source: Yuanta Vietnam
10%
10%
0%
0%
10%
10%
15%
Comment
Gross loans to deposits, an indicator of potential funding pressures.
Loans net of provisions to deposits.
Weighted at zero due to limited disclosure in recent years.
Weighted at zero due to limited disclosure in recent years.
Also known as the CASA ratio -- VN banks tend to be weak, with a few
exceptions.
Higher is better -- the state banks dominate this bracket.
An indicator of the asset-liability duration gap and required boost to
stable funding. For liquidity, a lower ratio here is better.
Capped at 30% by regulation, which is driving a search for stable
funding and pressuring NIM.
The recent trend is more important than a static snapshot.
Across the region, banks with strong funding franchises tend to be rewarded with sector-high or
near-high valuation multiples. The Vietnam banking system overall has rather low current account
/ savings account (CASA) deposits, a sad fact that is not likely to disappear anytime soon.
According to our informal discussions with bankers, competition for deposits is such that the
banks willingly allow early withdrawal of large time deposits with no or limited financial penalty,
which means that liquidity is not really a concern for corporate treasurers. The result is that really
only two banks – VCB and MBB – have substantial CASA franchises and this is among the core
competitive advantages that these banks offer.
Although the State Bank of Vietnam is in the process of enforcing Basel 2 standards, we also
see prudent application of the liquidity-related asset/liability management which are really more
a feature of Basel 3. Specifically, the authorities have been gradually requiring banks to curtail
the funding of long-term assets with short-term liabilities, and the ratio of short-term deposits to
long- and medium-term loans has been reduced to 30%. In our view, this increased focus on
stable funding a key reason for increased bond issuance among the banks in recent months.
As a general statement, the state banks (including most notably VCB but also BID and CTG) and
quasi-state banks (e.g., MBB) tend to enjoy stronger deposit franchises than their private sector
peers, but liabilities-focused private banks (e.g., TCB) have been making inroads. But given the
large proportion of the population that remains unbanked (we have seen estimates ranging from
50% to 65%), we think that unlocking liquidity in Vietnam is likely to be a key theme in the years
ahead.
The table below presents the CAMEL scores for each bank and each metric. Yuanta clients who
would like to see the underlying ratios for any of the banks (or all of them) are welcome to request
this data (see our contact details on Page 1).
Page 9
Vietnam Banks
BID
4
5
5
5
5
5
2
5
1
5
1.9
CTG
5
4
4
4
4
4
3
5
5
5
3.8
EIB
1
2
4
3
3
4
3
5
5
5
2.8
HDB
2
3
4
3
3
3
4
3
4
5
2.9
KLB
1
3
2
2
3
3
3
5
1
5
3.5
LPB
3
4
4
4
4
4
1
5
5
5
2.5
MBB
3
2
4
2
2
2
3
3
1
1
2.8
NAB
3
4
4
4
4
4
3
5
5
5
4.8
SHB
3
4
5
5
5
5
2
5
1
5
3.4
STB
3
4
4
5
4
5
1
4
2
5
3.3
TCB
2
1
3
1
1
1
3
1
3
1
1.2
TPB
3
3
4
3
3
3
3
3
5
1
2.0
VCB
2
4
4
4
4
4
5
3
3
1
1.8
VIB
2
3
4
3
3
3
2
5
2
1
3.1
VPB
2
2
3
2
2
2
2
5
3
1
2.1
1
1
1
2
1
1
1
3
1
2
3
2
1
2
2
2.4
1
1
1
1
1
1
2
4
1
2
4
3
1
5
1
3.2
3
2
5
3
5
3
3
3
5
1
4
4
4
1
3
3.6
1
1
2
4
3
3
2
1
2
1
3
2
4
1
2
3.1
1
3
1
4
3
3
4
4
5
1
4
4
5
1
4
1.8
2
1
5
2
3
3
3
3
4
1
4
4
3
4
4
3.0
1
1
1
2
2
1
2
5
2
2
4
5
1
5
5
3.3
2
1
1
3
3
2
2
3
3
2
3
4
3
5
3
3.4
2
2
3
1
4
2
2
1
1
1
2
3
1
1
4
3.4
2
1
1
4
4
3
1
1
2
5
1
1
2
4
2
3.0
3
1
4
5
5
4
4
2
5
2
4
4
5
5
5
3.6
1
1
1
5
3
4
3
2
5
2
3
3
5
5
2
1.4
2
1
5
4
4
3
3
1
3
1
3
3
1
5
2
3.1
3
1
3
1
4
2
2
3
1
1
3
4
1
1
5
2.6
1
1
1
3
2
1
1
1
1
1
1
1
1
1
4
2.1
2
1
4
5
4
4
5
4
5
2
5
5
1
2
3
3.5
5
5
5
3
5
5
5
1
5
1
4
4
3
3
5
3.3
Asset Quality
BAB
5
3
3
3
4
3
3
5
1
5
2.4
SML ratio
Type 3 NPL ratio
Type 4 NPL ratio
Type 5 NPL ratio
NPL & SML ratio
Gross NPL ratio
Net NPL ratio
LLR / Gross loans
LLR / NPLs
GPs / Performing loans
SPs / NPLs
SPs / NPLs + SMLs
VAMC bonds / Assets
Accrued interest / Assets
Other receivables / Assets
Trend
Management
ACB
2
4
4
3
4
3
2
5
5
1
1.7
Fees / Adj income
Fees / Assets
Costs / Adj income
Costs / Assets
CASA growth
Credit costs / Assets
Credit cost adjusted NIM
Governance rating
Quality of current
management
Trend
3
3
3
4
1
2
1
3
5
5
2
1
5
1
4
5
4
3
1
2
4
5
5
3
3
4
3
2
3
3
5
4
4
4
4
3
2
2
4
5
5
4
2
4
5
2
1
3
5
4
5
4
1
1
3
4
5
5
3
3
5
2
2
4
3
2
2
5
1
4
1
2
5
5
4
3
5
1
2
5
3
4
2
2
3
2
5
4
1
2
5
4
1
2
4
3
1
1
1
3
1
3
1
4
3
2
3
4
1
2
2
3
4
3
1
2
2
4
4
2
3
2
2
4
3
2
1
2
4
2
2
5
1
5
1
2
1
2.6
5
3.8
3
3.1
4
3.6
5
2.9
2
2.2
3
3.4
4
3.8
1
2.4
4
3.3
3
2.8
1
2.3
2
2.7
2
2.2
1
2.4
1
1.5
2
4.1
Earnings
FY2018
CAR
Equity / Assets
Equity / Assets + Off BS
VAMC-adj equity / Adj Assets
Tangible Equity / T. Assets
VAMC adj TE / VAMC adj TA
Interbank / Assets
Loans / Assets
Current FOL room (%)
Basel II approval
Trend
NIM
Fees / adj revenue
Investment inc / adj revenue
Total adj non-II / adj revenue
Cost / adj revenue
PPOP / Assets
Provisioning / assets
OROA
Other income / assets
Pretax ROA
PAT ROA
Minint / assets
Average Leverage
PATMI ROE
Trend
2
3
5
2
3
2
1
2
3
1
1
1
3
1
1.6
5
5
3
3
2
5
1
4
5
4
4
1
2
4
3.3
3
4
4
3
1
2
3
5
4
4
4
1
5
2
3.2
5
3
4
2
3
5
1
5
5
5
5
1
3
5
3.7
4
4
1
1
4
5
1
5
5
5
5
1
2
5
3.3
1
5
2
3
2
1
1
1
5
1
1
1
2
1
1.2
4
5
1
2
5
5
1
5
5
5
4
1
2
5
3.3
3
5
5
5
3
4
1
4
5
5
4
1
3
4
3.8
1
3
4
2
2
1
1
1
4
1
1
1
2
1
1.9
3
5
5
5
4
5
1
3
5
3
3
1
3
3
2.8
5
3
4
2
2
5
1
5
5
5
4
1
3
4
4.1
5
1
5
1
5
5
1
5
5
5
5
1
3
5
2.1
1
1
1
1
1
1
1
1
3
1
1
1
1
1
2.8
2
3
3
1
3
1
1
1
5
1
1
1
3
1
1.2
3
4
1
1
1
1
1
2
4
1
1
1
3
1
1.8
1
3
5
3
2
1
1
1
4
1
1
1
2
1
1.8
1
4
5
4
2
1
5
1
1
1
1
1
1
1
3.4
Liquidity
Capital Adequacy
CAMEL RATINGS
Gross LDR
Net LDR
Deposits / Assets
Deposits / Liabilities
Current accounts / Deposits
LTMT loans/Current deposits
MT loans / Total loans
LT loans / Total loans
ST deposits / LTMT loans
Trend
2
2
1
1
2
3
1
3
5
3.7
2
2
2
1
5
5
3
3
5
3.6
3
3
1
2
2
3
1
3
2
2.4
4
4
2
2
2
4
1
3
2
2.5
2
2
1
1
3
4
1
4
2
4.1
3
3
5
5
4
5
4
2
3
4.4
4
4
3
2
5
5
3
2
2
3.9
3
3
2
2
2
5
5
2
5
4.4
2
2
3
3
1
1
3
3
2
4.3
3
3
2
2
5
5
2
1
5
4.3
3
3
3
3
4
5
5
3
5
3.1
1
1
1
1
3
3
4
2
3
3.9
1
1
4
3
1
2
4
3
2
2.4
4
4
5
5
2
5
5
4
2
3.3
1
1
2
2
1
1
1
3
1
3.3
5
5
4
4
3
5
5
5
3
2.8
5
5
5
5
3
5
5
2
2
2.5
Page 10
Vietnam Banks
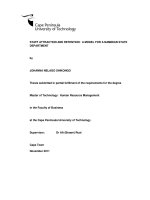
ACB VN: Asia Commercial Bank
CAMEL ranking: 4th, with total score of 2.3, of which:
ACB's CAMEL Rating: 2.3
Capital Adequacy, 3.0
5
4
Liquidity, 2.1
Asset Quality, 1.7
3
2
Asset Quality (Rating: 1.7): Low NPL ratio (0.73%) thanks to substantial
NPL recoveries (related to a scandal of former Vice Chairman) in 2017 and
2018, non-VAMC exposure, and a high loan loss coverage ratio (152%) give
ACB a high rating score for asset quality.
1
Management, 2.1
Earnings, 2.1
Capital (Rating: 3.0): This rating rests largely on: 1) CAR of 12.8% under
Basel I (or 1.5ppt lower (or 11.3%) under Basel II in our estimate), which is
well-above the Basel II minimum requirement of 8%. 2) Basel II approval
from the SBV is another plus score. 3) We also ranked based on the trend
over the last three years, and ACB’s capital trend stayed at the upper end of
the ranking, with a score of 1.7, well below the median value of 2.8.
However, equity/asset is at a low level of 6%, which is below the median of
all listed banks of 7%. Full-FOL is another factor that drags down the rating
of ACB.
Management (Rating: 2.1): We highly value the quality of ACB that brought
up the Bank from the brink of bankruptcy to a strong bank as it is today.
CASA growth showed an impressive growth among banks with 18%, staying
at the top of the rank. We see rating can be higher if ACB can increase fee
income to total adj. income (which was 12% in 2018A) and reduce the cost
to income ratio (55%).
Earnings (Rating: 2.1): Earnings stay at the top of the rank with superior
ROA (1.67%) and ROE (27.7%), and the trend looks pretty strong.
Liquidity (Rating: 2.1): Liquidity position appears to be solid. Deposit
franchise is above the median of the 17 listed banks, with CASA ratio of
16.7% vs. the median of 14.8%.
Company Profile
Ticker
ACB VN
Target price
Not Rated
Total Asset
VND 355 tn
(USD 14 bn)
Total Chartered capital
VND 12.9 tn
(USD 553 mn)
Shareholders
Company overview
ACB is the 3rd largest
JOCB by assets, with
5% market share.
Revenue breakdown
Retail is the key driver of
the Bank, contributing
60% of the total loans.
Interest
income
accounted for 85% of the
adjusted revenue, and
non-interest
income
represented 15% (12%
from fee income)
Asset Quality
In 2018, the Bank made
good progress from NPL
recoveries from group of
six companies (G6) related
to ex-Vice Chairman of
ACB. NPL was 0.68% as
at 1Q19, which is well
below the SBV’s target of
3%. NPL (cat. 2-5) was
only 0.98%.
Whistler First Burns
Dragon
Financial Investments Investment
Holdings, , 6.27%
s, 5.54%
9.44%
Dang
Ngoc
Lan,
5.72%
Remaining FOL: 0%
Premium: 10%-20%
Others
,
68.4%
Asia Reach
Investment,
4.52%
Tran Hung
Huy
(Chairman
), 4.67%
Valuation
Market cap:
VND 36 tn (USD 1.6 bn)
2019E P/BV (**): 1.4x
Capital Adequacy
ACB is quite well-capitalized
with CAR at 12.8% under
Basel I (or 11.3% under Basel
II in our estimate).
Loan loss coverage ratio
was 158% as at 1Q19.
Note: (*): Yuanta’s estimate; (**) Bloomberg Data
Page 11
Vietnam Banks
BAB VN: North Asia Bank
CAMEL ranking: 13th, with total score of 3.2, of which:
BAB's CAMEL Rating: 3.2
Capital (Rating: 3.3): We grant this rating due to: 1) current FOL of 30%,
2) but low equity/asset of 7%, 3) non-approval Basel II and undisclosed
CAR.
Capital Adequacy, 3.3
Asset Quality (Rating: 2.0): Same as ACB, low NPL ratio (0.76%) and
high loan loss coverage ratio (122%) give BAB a high score for asset
quality.
5
4
3
Liquidity, 3.0
Asset Quality, 2.0
2
Management (Rating: 4.0): Low fee income to the total adj. income, a
negative CASA growth, and a low score for governance rating in our view
bring a significant low rating for management.
1
Earnings (Rating: 3.8): BAB deserves a low earnings rating due to its
below the sector’s median of NIM (1.80% vs. 2.78%), ROA (0.72% vs.
0.91%), and ROE (10.1% vs. 15.1%).
Earnings, 3.8
Management, 4.0
Liquidity (Rating: 3.0): A rating of 3.0 is based on a reasonable deposit
to asset and LDR ratios but an extremely low CASA ratio. Undisclosed
short-term deposit to medium and long term loans also downgrades the
rating.
Company Profile
Ticker
BAB VN
Target price
Not Rated
Total Asset
VND 97 tn
(USD 4 bn)
Total Chartered capital
VND 5.5 tn
(USD 236 mn)
Shareholders
Company overview
Revenue breakdown
Net interest income
accounted for 89% of the
total adjusted revenue,
while
non-interest
income represented only
11%. Of which, fee
income contribution is
insignificant with only
4%.
Asset Quality
NPL was quite low at
0.43% in 1Q19, and NPL
(cat. 2-5) was 0.81%.
Thai
Huong
(CEO),
4.79%
Nguyen
Trong
Tran Thi
Trung,
Thoang
4.23% (Chairwoman),
3.55%
BAB is one of the
medium-size
commercial
banks,
with 30 branches, and
90
transactions
offices
in
27
provinces/cities
of
Vietnam.
Valuation
Market cap:
VND 11.3 tn (USD 484 mn)
2019E P/BV (**): 1.7x
Capital Adequacy
Remaining FOL: 30%
Others,
87.43%
Page 12
Vietnam Banks
BID VN: Bank for Investment and Development of Vietnam
CAMEL ranking: 11th, with total score of 3.2, of which:
BID's CAMEL Rating: 3.2
Capital Adequacy, 3.7
5
4
Liquidity, 2.2
3
Asset Quality, 3.4
2
1
Management, 3.4
Earnings, 3.4
Capital (Rating: 3.7): Low rating is mainly due to low CAR of 9.0% under
Basel I (or 7.5% under Basel II in our estimate), highly leverage, and nonBasel II approval. Vietnam’s overly leveraged banks are under pressure to
raise capital to comply with Basel 2 accords, and BID is among this group.
Unlike most other banks, BID’s FOL room is currently 26.9%, which is more
than sufficient for the plan 15% (603.3 mn share) sale to KEB Hana Bank.
We believe that the successful of stake sale would address the capital
deficiency, and strengthen the balance sheet (i.e. reduce leverage), which
would enhance the rating.
Asset Quality (Rating: 3.4): Above the sector’s median of 2.83%, NPL
ratio (including SML) of BID was 4.23%. Moreover, a low loan loss
coverage ratio of 66% also downgrades its asset quality rating. BID still had
a significant of amount of VAMC bond (1.08% of the total asset as at
2018A), and we expect BID to clear 100% of its remaining net VAMC
exposure in 2019E.
Management (Rating: 3.4): A rating of 3.4 derives from a low fee to the
total adj. income of 9%, a significantly low CASA growth of only 1% YoY.
Credit cost adjusted NIM of 1.28% was also far below the sector’s median
of 2.60%.
Earnings (Rating: 3.4): Profitability of the Bank is slightly below the
sector’s median, while leverage is off the roof with 25.8x – the highest
among banks. We expect the stake sale will help reduce leverage, which
will lower funding cost and NIM.
Liquidity (Rating: 2.2): The Bank’s LDR of 99.9% was already above the
regulatory cap for State-owned banks (90%). Short-term deposit to
medium-and long term loans of 31.1% was below the regulatory
requirement of 40%.
Company Profile
Ticker
BID VN
(SOCB)
(Initiated in Mar 2019)
Target price
VND 38,713
(Upside: +18%)
Total Asset
VND 1,343 tn
(USD 58 bn)
Total Chartered capital
VND 34.2 tn
(USD 1.5 bn)
Shareholders
Company overview
BID is the Vietnam’s
largest
SOCB
by
assets, with 20%
market share as at
1Q19 among listed
banks.
Revenue breakdown
BID’s loan book reflects
its retail & SME focused,
with 55% of the total
loan was retail and
SME.
Net
interest
income accounted for
86%
of
the
total
adjusted income while
non-interest
income
represented only 14%.
Asset Quality
Current NPL ratio of 1.74%
was still under control
(below the SBV’s target of
3%). However, NPL ratio
(including special mention
loans) was 4.37%, which is
quite high and causes a
concern.
Currently, BID has a net
VAMC bond of VND 6.6 tn,
and the Bank had been
increased
provisions
against the VAMC bond
over the last 3 years from
27% in 2016 to 54% in
2018. Thus, we expect BID
will fully provisioned VAMC
exposure in 2019 and this
would help profit in 2020E.
Major shareholders
Others,
4.72%
State Bank of
Vietnam (SBV),
95.28%
It has broad retail and
SME-focused footprint
with 190 branches and
854
transaction
offices.
Remaining
26.9%
FOL:
Market Cap
Market cap:
VND 110 tn (USD 4.7 bn)
2019E P/BV (*): 1.7x
Capital Adequacy
BIDs need additional capital
to meet Basel II accords as its
current CAR is just slightly at
the limit, with 10% under
Basel I or roughly 8% under
Basel II (in our estimate). BID
plans to raise VND6,033 bn
by issuing 603.3 mn shares to
KEB Hana Bank, but the deal
remains subject to regulatory
approval.
Page 13
Vietnam Banks
CTG VN: Vietnam Bank for Industrial and Trade
CAMEL ranking: 14th, with total score of 3.4, of which:
CTG's CAMEL Rating: 3.4
Capital (Rating: 4.4): CTG is really in need of capital, and it has no room
to raise Tier 1 capital via selling capital to foreign investors as well as Tier
2 capital. It has a low rating due to its capital constraints and of course nonBasel II approval.
Capital Adequacy, 4.4
5
4
Liquidity, 2.6
3
Asset Quality, 2.3
2
Asset Quality (Rating: 2.3): Asset quality is bit better than its SOCB peer
(BID), with NPL ratio (including SML) of 2.19% below the sector’s median
of 2.83%. As at 2018A, CTG’s VAMC exposure was at 1.15% of the total
asset. Remember that CTG’s asset is the 2nd largest among listed banks
with VND1,164 tn, and VAMC exposure amount turns out to be a huge
amount of VND13.4 tn.
1
Management (Rating: 3.6): Cost controlling is less efficient than the
sector’s median, and the credit cost adjusted NIM of 1.31% is significant
lower than the sector’s median of 2.60%.
Earnings, 4.0
Management, 3.6
Earnings (Rating: 4.0): With capital constraint and high leverage, it is no
doubt that profitability of the bank is well below the sector’s median.
Liquidity (Rating: 2.6): LDR of 105%, which exceeds the regulatory cap
of 90% for SOCBs, causing liquidity concern for the Bank.
Company Profile
Ticker
CTG VN
(SOCB)
Target price
Not Rated
Total Asset
VND 1,147 tn
(USD 49 bn)
Total Chartered capital
VND 37.2 tn
(USD 1.6 bn)
Shareholders
Company overview
Revenue breakdown
84% of the total adjusted
revenue came from net
interest income and 16%
were from non-interest
income (fee income was
10%) as at 2018A.
Asset Quality
NPL ratio: 1.85%
NPL ratio (cat.2-5): 2.44%
IFC (World
Bank),
2.63%
Others,
7.79%
IFC L.P,
5.39%
SBV,
64.46%
CTG is the second
largest listed SOCB,
just behind BID in
terms of total assets.
It has 155 branches
and 1,000 transaction
offices across 63
provinces/cities.
Valuation
Market cap:
VND 75.4 tn (USD 3.2 bn)
2019E P/BV (**): 1.0x
Capital Adequacy
The Bank is under-capitalized
and looking for new capital to
boost CAR. However, there is
limited option for it to raise Tier
1 or Tier 2 capital because of
its full-FOL and zero quota for
Tier 2.
Remaining FOL: 0.1%
The Bank of
TokyoMitsubishi
UFJ, 19.73%
Page 14
Vietnam Banks
EIB VN: Eximbank
CAMEL ranking: 12th, with total score of 3.2, of which:
EIB's CAMEL Rating: 3.2
Capital (Rating: 3.4): CAR as at 2018A was 15% under Basel I (or 13.5%
under Basel II in our estimate), and equity to asset of 10% was above the
sector’s median of 7%. However, EIB was highly exposure to off-balance
sheet item, with equity/ (asset + off-balance sheet exposures) was only 6%.
Non-Basel II approval and full-FOL room are another downside to the
rating.
Capital Adequacy, 3.4
5
4
3
Liquidity, 2.4
Asset Quality, 3.0
2
Asset Quality (Rating: 3.0): On the surface, NPL ratio (including SML) of
2.45% seems to be low; however, it was highly exposure to VAMC bond
(3.59% of the total asset as at 2018A). Loan loss coverage ratio of 56%
was far below the sector’s median of 88%.
1
Management (Rating: 3.5): The issue from the corporate governance
results in less favorable rating. An Annual General Meeting (AGM) has
been delayed up until now due to an ongoing shareholders dispute.
Management, 3.5
Earnings, 3.7
Earnings (Rating: 3.7): Business performance was poor. NIM of 2.12%
was below the sector’s median, while ROA and ROE stayed at the low end
of the range.
Liquidity (Rating: 2.4): Liquidity seems to be fine, with short-term deposit
to medium-and long term loans at 33.9%, which is below the regulatory
requirement of 40%.
Company Profile
Ticker
EIB VN
Target price
Not Rated
Total Asset
VND 151 tn
(USD 6 bn)
Total Chartered capital
VND 12.4 tn
(USD 1.6 bn)
Shareholders
Company overview
Revenue breakdown
Net interest income: 76%
Non-interest
income:
24% (fee income was
only 8%) as at 2018A.
Asset Quality
NPL: 1.88%
NPL (cat. 2-5): 2.49% as at
1Q19
Sumitomo Mitsui,
15%
VOF Investment,
4.97%
VCB,
4.82%
EIB is the mid-size
joint stock commercial
bank,
with
44
branches and 163
transaction offices.
Valuation
Market cap:
VND 22.9 tn (USD 981 mn)
2019E P/BV (**): 1.4x
Capital Adequacy
CAR: 15% as at 2018A.
Remaining FOL: 0.3%
Others,
75.21%
Page 15
Vietnam Banks
HDB VN: Ho Chi Minh City Development Bank
CAMEL ranking: 9th, with total score of 3.0, of which:
HDB's CAMEL Rating: 3.0
Capital (Rating: 3.4): CAR was at 12% under Basel I (or 10.5% under
Basel II in our estimate), which is above the minimum requirement of 8%
under Basel II. However, non-Basel II approval drags down the rating for
the Bank, but it expects to receive approval by the end of 2Q19. As of now,
the SBV has not announced the result yet.
Capital Adequacy, 3.4
5
4
3
Liquidity, 3.8
Asset Quality, 3.1
2
1
Earnings, 1.9
Asset Quality (Rating: 3.1): Asset quality rating is in middle of the range.
NPL ratio (even including SML) was 2.83%, still below the regulatory
requirement of 3%. Loan loss coverage ratio was low of 71% and below the
sector’s median of 88%.
Management (Rating: 3.0): Cost to the total adjusted income was in line
with the sector’s median of 50%, while credit cost adjusted NIM was far
above the median. However, low fee income ratio of 5% and a negative
CASA growth of -26% bring down the rating.
Management, 3.0
Earnings (Rating: 1.9): Earnings was superior with NIM, ROA and ROE
far above the median of 17 listed banks. These positive earnings mainly
came from its subsidiary in consumer finance field – HD Saison. In 2018,
HD Saison contributed 22% to the consolidated net profit of HDBank.
Liquidity (Rating: 3.8): LDR was above the regulatory cap of 80% for
JOCBs, and short-term deposit to medium-and long term loans was already
at the limit, which causes a liquidity concern.
Company Profile
Ticker
HDB VN
Target price
Not Rated
Total Asset
VND 203 tn
(USD 9 bn)
Total Chartered capital
VND 9.8 tn
(USD 421 mn)
Shareholders
Company overview
Revenue breakdown
Net interest income: 85%
Asset Quality
NPL: 1.45%
NPL (cat. 2-5): 3.56% as at
1Q19
Nguyen Thi Phuong Thao
(Vice President), 3.67%
Pham Van
Dau,
4.30%
Sovico,
13.34%
HDB
has
283
branches/transaction
offices
across
Vietnam.
Non-interest
income:
15%
(fee
income
contributed only 5%) as
at 2018A.
Valuation
Market cap:
VND 25.5 tn (USD 1.1 bn)
2019E P/BV (**): 1.5x
Capital Adequacy
CAR: 15% as at 2018A.
It owns a subsidiary in
consumer
finance,
namely HD Saison
Remaining FOL: 5.5%
Agribank
Securities, 4.47%
Page 16
Vietnam Banks
KLB VN: Kien Long Bank
CAMEL ranking: 10th, with total CAMEL score of 3.2, of which:
KLB's CAMEL Rating: 3.2
Capital (Rating: 2.9): Capital seems to be more than sufficient for this
Bank, with CAR of 17% under Basel I (or 15.5% under Basel II in our
estimate), and FOL room of 30% is another plus. However, non-Basel II
approval diminishes the rating.
Capital Adequacy, 2.9
5
4
Liquidity, 3.3
3
Asset Quality, 2.6
2
1
Earnings, 3.9
Management, 3.3
Asset Quality (Rating: 2.6): Asset quality looks pretty strong, with low
NPL ratio (including SML) of 1.93%, well below the sector’s median of
2.83% and the regulatory requirement of 3.0%. The Bank had no exposure
to VAMC bonds; however, we should be cautious with accrued interest that
accounted for 3.69% of the total assets.
Management (Rating: 3.3): Same as most other banks, fee income still
accounted for a small portion of the total adjusted income, with only 5% as
at 2018A. Cost management seems to be the least efficient among banks,
with cost to income ratio of 80% at the top of the range
Earnings (Rating: 3.9): With really high CIR, it is no surprise that
profitability was poor. OROA was extremely low of 0.49%, and ROA, ROE
were far below the sector’s median.
Liquidity (Rating: 3.3): Liquidity appears to cause concern, with gross
LDR of 101%.
Company Profile
Ticker
KLB VN
Target price
Not Rated
Total Asset
VND 44 tn
(USD 2 bn)
Total Chartered capital
VND 3.2 tn
(USD 139 mn)
Shareholders
Company overview
Revenue breakdown
Net interest income: 84%
Asset Quality
NPL: 1.00%
NPL (cat. 2-5): 2.19% as at
1Q19
Duy Huyen,
4.78%
Vo Quoc
Loi, 4.74%
Quynh
Huong,
4.46%
KLB has 31 branches
and 103 transaction
offices, mainly in
Mekong Delta area.
Non-interest
income:
16%
(fee
income
contributed only 5%) as
at 2018A.
Valuation
Market cap:
VND 3.2 tn (USD 139 mn)
Capital Adequacy
CAR: 16.6% as at 2018A.
Remaining FOL: 30%
Others,
86.02%
Page 17
Vietnam Banks
LPB VN: Lien Viet Post Bank
CAMEL ranking: 16th, with total score of 3.5, of which:
LPB's CAMEL Rating: 3.5
Capital (Rating: 3.9): Capital rating is poor due to its low CAR, and highly
leverage. Its CAR was 10.9% as at 2018A under Basel I (or 9.4% under
Basel II in our estimate), and it has less room to raise Tier 1 capital via
selling to foreign investors as its current FOL is only 0.9%. The Bank has
not applied Basel II is another downside.
Capital Adequacy, 3.9
5
4
Liquidity, 3.2
3
Asset Quality, 2.8
2
Management (Rating: 3.8): Poor performance on fee income (3% of the
total adjusted revenue), inefficient cost control (CIR: 59%), and negative
CASA growth (-36% YoY) lead to a low rating for management.
1
Earnings, 3.9
Asset Quality (Rating: 2.8): Asset quality rating of 2.8 rests largely on low
NPL ratio. Gross NPL was 1.41% and gross NPL & SML ratio was 2.61%,
which were both below the sector’s median of 1.54% and 2.83%.
Management, 3.8
Earnings (Rating: 3.9): High cost to income ratio was the main reason that
contracted the profitability of the Bank.
Liquidity (Rating: 3.2): Liquidity seems not to be a problem, but need to
watch out as LDR exceeded the regulatory cap of 80%. Low rating was also
due to non-disclosure of the short-term deposit to medium-and long term
loans.
Company Profile
Ticker
LPB VN
Target price
Not Rated
Total Asset
VND 182 tn
(USD 8 bn)
Total Chartered capital
VND 8.9 tn
(USD 381 mn)
Shareholders
Company overview
Revenue breakdown
Net interest income: 97%
Asset Quality
NPL: 1.36%
NPL (cat. 2-5): 2.73% as at
1Q19
Vietnam Post
Office,
11.45%
Others,
80.77%
H.T.H Ltd.,
4.52%
Nguyen
Dinh
Thang,
3.26%
LPB is one of the
commercial bank that
owns
the
largest
operation
network
nationwide, including
388 branches and
transaction
offices,
917 post-offices, and
10,000
transaction
locations in the postal
network.
Non-interest income: 3%
(mainly fee income with
3%) as at 2018A.
Valuation
Market cap:
VND 6.9 tn (USD 297 mn)
2019E P/BV (**): 0.6x
Capital Adequacy
CAR: 10.9% as at 2018A.
Remaining FOL: 0.9%
Page 18
Vietnam Banks
MBB VN: Military Bank
CAMEL ranking: 2nd, with total CAMEL score of 2.1, of which:
MBB's CAMEL Rating: 2.1
Capital (Rating: 2.1): Capital status of MBB looks solid, with current CAR
above the Basel II requirement and low leverage. The Bank also plans to
sell at least some proportion (or all) of the 10% remaining FOL room by the
end of 2019, this would further improve capital adequacy. MBB is also one
the first nine banks as at 2Q19 that received Basel II approval from the
SBV.
Capital Adequacy, 2.1
5
4
3
Liquidity, 2.3
Asset Quality, 2.2
2
1
Asset Quality (Rating: 2.2): The asset quality sounds solid, with low NPL
and high loan loss coverage ratio. It has no exposure to VAMC bond, which
helps profitability.
Management (Rating: 2.0): We highly value the management quality of
MBB, with efficient cost management and high CASA growth (+16% YoY).
Management, 2.0
Earnings, 1.8
Earnings (Rating: 1.8): Strong deposit franchise is the key driver of MBB’s
profitability. With its sector-high ratio of current account and saving
accounts (CASA) deposits to total deposits, MBB is better positioned than
other banks to sustain and improve its net interest margin (NIM) without
taking on undue credit risk. MBB’s CASA ratio is 34%, far above the median
of 14% among listed peers as at 1Q19. We also see further room for NIM
improvement from a shifting more to retail and SME.
Liquidity (Rating: 2.3): Net LDR of 88% was above the cap for JOCBs
(80%), but MBB states that its LDR strictly complies with the SBV’s
regulations. The seeming disconnect here could be due to a portion of loans
possibly being excluded from the LDR calculation based on SBV policy.
That said, we do not believe that the LDR has room to expand
Company Profile
Ticker
MBB VN
(Initiated in Jun 2019)
Target price
VND 29,880
(Upside: +41%)
Total Asset
VND 383 tn
(USD 16 bn)
Total Chartered capital
VND 21.6 tn
(USD 927 mn)
Valuation
Market cap:
VND 44 tn (USD 1.9 bn)
Shareholders
Company overview
MBB is the 2nd largest
listed
JOCB
by
assets,
with
6%
market share.
It has the sector’s
highest CASA ratio
with 34% as at 1Q19.
Revenue breakdown
Net interest income
accounted
for
81%
(mostly come from retail
and SME, representing
88% of the total loans),
and another 19% came
from non-interest income
(mostly fee income with
14%) in 2018A.
Asset Quality
NPL ratio (cat. 3-5) was
1.41% in 1Q19; however, if
including special mention
loans (cat. 2), the NPL
ratio was 3.26%, slightly
above the 3% of the SBV’s
target.
2019E P/BV (*): 1.1x
Capital Adequacy
The current CAR is 10.9%
under Basel I or 9.5% under
Basel II (1.5ppt lower in our
estimate). The Bank’s plan to
unlock the remaining FOL
room (about 10%) to foreign
investors by the end of 2019
will boost CAR further.
Major Shareholders
Other
s,
35.4%
Viettel
,
14.6%
Foreign
Investors,
20.0%
VCB,
5.0%
Vietnam
Helicopter,
7.8%
SCIC,
9.7%
Remaining FOL: 0.0%
(10% FOL is currently
locked by the bank)
Saigo
n New
Port,
7.5%
Subsidiaries: MCredit,
MB Ageas Life, MBS,
MIC,
Loan loss coverage ratio
was 96% as at 1Q19.
We expect fee income
trend will continue to
accelerate with a strong
support
from
its
insurance arm – MB
Ageas Life.
Premium: 7%-30%
Page 19
Vietnam Banks
Nam A Bank (OTC traded)
CAMEL ranking: 15th, with total score of 3.5, of which:
Capital (Rating: 4.3): Capital rating was weak mainly due to its lack of
information (currently not listed), and the trend had declined for both CAR
and Equity/Asset ratio over the period 2016-2018.
NAB's CAMEL Rating: 3.5
Capital Adequacy, 4.3
5
4
Liquidity, 3.3
3
Asset Quality, 2.4
2
Management (Rating: 3.8): Low fee income proportion, negative CASA
growth, and lack of transparency information results in a low rating for
management.
1
Earnings, 3.6
Asset Quality (Rating: 2.4): Asset quality seems to be fine, with low gross
NPL ratio of 1.54% and low exposure to VAMC bonds (0.22% of the total
assets). However, accrued interest (which considered as bad asset)
accounted for 1.57% of the total asset (vs. the sector’s median of 1.37%),
which causes a bit concern.
Management, 3.8
Earnings (Rating: 3.6): Earnings were in line with the sector’s median;
however, cost controlling (CIR: 65.9% in 2018A) needs to be more efficient
to bring down CIR and improve profitability going forward.
Liquidity (Rating: 3.3): Net LDR of 92% was higher than the JOCB’s cap
(80%), which is not serious issue but need to reduce to meet the
requirement. Once again, lack of information on short-term deposit to
medium-and long term loans drags down the rating.
Company Profile
Ticker
NAB: (OTC)
Target price
Not Rated
Total Asset
VND 75 tn
(USD 3.2 bn)
Total Chartered capital
VND 3.4 tn
(USD 144 mn)
Valuation
Shareholders
Company overview
Revenue breakdown
Net interest income: 97%
Asset Quality
NPL: 1.54%
NPL (cat. 2-5): 3.11% as at
2018A
Capital Adequacy
CAR: 11.2% as at 2018A.
NAB operates mainly
in the Southern of
Vietnam, with 52
branches
and
transaction offices.
Non-interest income: 3%
(mainly fee income with
3%) as at 2018A.
Remaining FOL: 0.9%
Page 20
Vietnam Banks
SHB VN: Saigon Hanoi Bank
CAMEL ranking: 17th, with total score of 3.6, of which:
Capital (Rating: 3.7): CAR ratio was 11.8%, which is above the Basel II
requirement (8%). However, the Bank was highly leverage, especially
exposure to VAMC bonds (2.32% of the total assets). VAMC adjusted
tangible equity/VAMC adjusted tangible asset was only 1.5%, which is
far below the sector’s median of 6.2%. Current FOL room 20% gives it
more flexibility to raise more capital and reduce leverage.
SHB's CAMEL Rating: 3.6
Capital Adequacy, 3.7
5
4
3
Liquidity, 3.5
Asset Quality, 3.9
2
1
Management (Rating: 3.2): Management rating is in line with the
sector’s average rating.
Management, 3.2
Earnings, 3.9
Asset Quality (Rating: 3.9): Asset quality appears to be problematic
since its loan loss coverage ratio of 58% was far below the sector’s
median of 88%. Its asset structure was highly exposure to VAMC bonds
(2.32% of the total assets), accrued interest (2.82% of the total assets),
and other receivables (1.32% of the total assets), which are considered
as legacy asset.
Earnings (Rating: 3.9): Business performance was inefficient. OROA of
0.64% was 0.44ppt below the sector’s median of 1.08%, ROA and ROE
was also underperformed the sector’s median. The earnings trend
showed a declining momentum since 2016.
Liquidity (Rating: 3.5): Just like NAB, high LDR and lack of information
on short-term deposit to medium-and long-term loans results in a low
liquidity rating.
Company Profile
Ticker
SHB VN
Shareholders
Vinacomin Market
T&T , 5.06%
Vector
Group,
Vietnam
13.53%
ETF, 4.66%
Deuts
che
Bank,
4.24%
Others
,
68.79
%
Do Quang
Hien
(Chairman)
, 3.72%
Target price
Not Rated
Total Asset
VND 333 tn
(USD 14 bn)
Total Chartered capital
VND 12 tn
(USD 517 mn)
Company overview
SHB
has
400
branches
and
transaction
offices,
and 3 branches in Lao
and Cambodia. It has
more than 2 million
clients.
Revenue breakdown
Net interest income: 97%
Asset Quality
NPL: 2.40%
NPL (cat. 2-5): 4.56% as at
2018A.
Remaining
20.2%
Non-interest income: 3%
(mainly fee income with
3%) as at 2018A.
Valuation
Market cap:
VND 8.4 tn (USD 361 mn)
Capital Adequacy
CAR: 11.8% as at 2018A.
FOL:
Page 21
Vietnam Banks
STB VN: Sacombank
CAMEL ranking: 8th, with total score of 3.0, of which:
Capital (Rating: 3.6): Capital is the key risk to STB. Its NPL prudential
restructuring plan implies gradual loss recognition based on topline
profitability in the next several years. We view this workout as entirely
appropriate from a prudential perspective. But investors could face equity
dilution if a one-off recapitalization were adopted, which necessitates an
assessment of the potential risk.
STB's CAMEL Rating: 3.0
Capital Adequacy, 3.6
5
4
3
Liquidity, 2.2
Asset Quality, 2.9
2
1
Earnings, 3.7
Management, 2.4
Asset Quality (Rating: 2.9): A merger with the former Southern Bank in
2015 resulted in substantial asset quality woes, a challenge that the
Bank’s management is now addressing with strong support from
government policy. However, the trend showed a significant improvement
from 2016A-18A.
Management (Rating: 2.4): Fee income proportion of STB came out on
top of the sector’s rank, with 25%. Admittedly, CIR of 73% in 2018A was
really high, but the management did a good job to bring it down from 98%
in 2016A to 73% in 2018A. We believe in the management’s capability
in resolving legacy asset. Sacombank brought in Chairman Duong
Cong Minh, who has deep experience in real estate and banking, to
execute the restructuring.
Earnings (Rating: 3.7): In our view, topline PPoP growth is a better
indicator of the strength of the bank’s underlying business than net profit,
which we assume will continue to be flattened by provisioning for legacy
assets. Topline growth should be driven by improving NIMs as the Bank’s
very low LDR rises toward the regulatory cap, higher consumer banking
fee income as the bank better leverages its attractive retail franchise, and
improved efficiencies as management shakes off the effects of the 2015
merger with Southern Bank. PPOP/assets showed a significant
improvement from 0.04% in 2016A to 0.75% in 2018A.
Liquidity (Rating: 2.2): Liquidity seems not to be a problem for STB as it
has focused on resolving legacy assets rather boosting loan growth. Net
LDR was only 72.4% as at 2018A, which is well below the cap of 80% for
JOCBs. We see this as a key attractive feature for STB, given that it has
room to increase its LDR, and thus also improve its NIM, going forward.
Company Profile
Ticker
STB VN
(Initiated in Jan 2019)
Target price
VND 14,049
(Upside: +23%)
Total Asset
VND 425 tn
(USD 18 bn)
Total Chartered capital
VND 18.9 tn
(USD 810 mn)
Market Cap
Market cap:
VND 21 tn (USD 900 mn)
Shareholders
Company overview
STB is the largest
listed JOCB by assets
with
roughly
6%
market share.
It has a wide range of
networks with 566
branches nationwide
and about 5 million
active clients.
Revenue breakdown
It operates a primarily
retail banking business.
Loans are the heart of
the
business,
with
interest income accounts
for 71% of the total
adjusted income. While
non-interest
income
portion is the largest
among banks with 29%
(mainly fee income with
25%)
Asset Quality
After the merger with
Southern Bank in 2015,
STB has to deal with
problematic assets of VND
82 tn as at 2018A (or 20%
of assets). The Bank’s
strategy is to focus
strongly
on
“quality”
instead of “quantity” with
the main goals of cleaning
up the balance sheet, and
raising capital to adapt
Basel II accords.
2019E P/BV (*): 0.8x
Capital Adequacy
The current CAR of about 11%
(under Circular 36, or 9%
under Basel II in our estimate)
is still above the Basel II
requirement; however, the risk
of losing some portion of the
problematic assets still exists,
which requires an additional
capital in order to meet the
Basel II. In our view, the
capital raising is not likely to
happen soon as the top
priority of the Bank now is to
clean up the balance sheet.
Saigon Exim
Investment,
3.81%
Eximbank,
4.91%
Others,
87.97%
Duong
Cong Minh
(Chairman)
, 3.31%
Remaining FOL: 9.3%
Page 22
Vietnam Banks
TCB VN: Techcombank
CAMEL ranking: 1st, with total score of 1.9, of which:
Capital (Rating: 1.6): Based on ratio analysis, TCB appears to be the best
bank in terms of capital. CAR was 14.3% under Basel I (or 12.8% under
Basel II in our estimate), which is well above the Basel II’s minimum
requirement of 8%. Its leverage was the lowest among banks with
equity/asset of 16% in 2018A. Meeting Basel II standards also boost the
rating.
TCB's CAMEL Rating: 1.9
Capital Adequacy, 1.6
5
4
Liquidity, 2.1
3
Asset Quality, 2.8
2
Asset Quality (Rating: 2.8): Asset quality seems to be under controlled,
but one should be noted that its loan portfolio was highly exposure to real
estate, with 8.5% in 2018A vs. the sector’s average of 7% (according to
the local media).
1
Earnings, 1.4
Management, 1.7
Management (Rating: 1.7): Management performance was impressive,
with the most effective cost control (CIR of 35% - the lowest among banks),
and the highest CASA growth of 43% YoY.
Earnings (Rating: 1.4): With effective cost control and strong CASA
deposit franchise, it’s no surprise that TCB was among the top banks in
terms of profitability. NIM, OROA, ROA, and ROE were far above the
sector’s median, with 3.77%, 3.06%, 2.87%, and 21.5%, respectively.
Liquidity (Rating: 2.1): Liquidity looks strong, with net LDR below 80%,
and short-term deposit to medium-and long term loans (31.5%) was below
the regulatory requirement of 40%.
Company Profile
Ticker
TCB VN
Target price
Not Rated
Total Asset
VND 326 tn
(USD 14 bn)
Total Chartered capital
VND 34.9 tn
(USD 1.5 bn)
Shareholders
Company overview
Revenue breakdown
Net interest income: 67%
Asset Quality
NPL: 1.78%
NPL (cat. 2-5): 3.95% as at
1Q19.
Masan,
15%
Thanh Tam
(Chairman's
Family), Thanh Thuy
4.98% (Chairman's
Family),
4.98%
TCB is third largest
commercial bank in
terms of network, with
2 representatives and
314
transaction
offices.
Non-interest
income:
33% (mainly fee income
with 21%) as at 2018A.
Valuation
Market cap:
VND 70.3 tn (USD 3.0 bn)
2019E P/BV (**): 1.2x
Capital Adequacy
CAR: 14.3% as at 2018A.
Remaining FOL: 0.0%
Others,
71.09%
Premium: 7%-10%
Anh Minh
(Chairman's
Family),
3.95%
Page 23
Vietnam Banks
TPB VN: Tien Phong Bank
CAMEL ranking: 5th, with total score of 2.6, of which:
Capital (Rating: 2.9): The Bank already met Basel II; however, the
CAR still caused concern, with only 10.2% under Basel I. In our estimate
under Basel II, CAR was only 8.7%, which is just slightly above the
requirement of 8%. TPB has no FOL room, but management intends to
implement a rights issue.
TPB's CAMEL Rating: 2.6
Capital Adequacy, 2.9
5
4
3
Liquidity, 3.6
Asset Quality, 2.3
2
Management (Rating: 2.2): Management did a good job in boosting
fee income and reducing operating cost from 2016A-18A. Credit cost
adjusted NIM of 2.96% was higher than the sector’s median, which
showed the quality in risk management.
1
Earnings, 1.8
Asset Quality (Rating: 2.3): Asset quality was strong, with gross NPL
ratio of 1.12%, and NPL (including SML) was only 3.18%. Loan loss
coverage ratio (103%) was high and above the sector’s median of 88%.
Management, 2.2
Earnings (Rating: 1.8): Effective management results in a high profit,
with NIM, OROA, ROA, ROE outperformed the sector’s median. In
particular, the earnings trend revealed a strong increasing momentum
from 2016A-18A.
Liquidity (Rating: 3.6): Liquidity ratio causes a bit concern here, with
net LDR of 100% was far above the cap of 80% for JOCBs.
Company Profile
Ticker
TPB VN
Target price
Not Rated
Total Asset
VND 140 tn
(USD 6 bn)
Total Chartered capital
VND 8.6 tn
(USD 368 mn)
Shareholders
Company overview
Revenue breakdown
Net interest income: 80%
Asset Quality
NPL: 1.39%
NPL (cat. 2-5): 3.74% as at
1Q19.
Doji,
8.25%
FPT,
9.42%
SBI Ven
Holdings,
5.76%
IFC
(World
Bank),
5.16%
Others,
66.39%
TPB has 75 branches
and
transaction
offices,
1
representative,
and
1,000
Livebank
outlets.
Non-interest
income:
20% (mainly fee income
with 12%) as at 2018A.
Valuation
Market cap:
VND 19.9 tn (USD 854 mn)
2019E P/BV (**): 1.6x
Capital Adequacy
CAR: 10.2% as at 2018A.
Remaining FOL: 0.0%
PYN Elite
Fund,
5.02%
Page 24
Vietnam Banks
VCB VN: Vietcombank
CAMEL ranking: 3rd, with total score of 2.1, of which:
Capital (Rating: 2.9): Vietcombank is one of the first banks that met Basel
II standards. After issuing 111 mn shares to Mizuho Bank (16.7 mn
shares) and GIC (94.4 mn shares) in 2018, CAR under Basel I increased
from 10.7% to 11.5% and we estimate that the bank’s CET1 ratio
increased from 7.8% to 8.6%. our estimate of VCB’s 2019E Basel II CAR
is 10% (in line with current guidance of 9.7%), which is 1.5ppt below its
Basel I CAR.
VCB's CAMEL Rating: 2.1
Capital Adequacy, 2.9
5
4
Liquidity, 1.6
3
Asset Quality, 1.5
2
Asset Quality (Rating: 1.5): VCB’s asset quality was the strongest
among banks, with low NPL ratio (0.98%) and the highest loan loss
coverage of 165%. It has no remaining exposure to VAMC bonds.
1
Earnings, 2.0
Management, 2.6
Management (Rating: 2.6): VCB’s management team is one of the most
efficient teams among banks. Management is successful in building a
strong CASA deposit franchise, which produces the sector’s lowest
funding cost at 2.8% (vs. sector’s average of 5.1%).
Earnings (Rating: 2.0): Banks with sustainably low funding costs
typically generate relatively high ROA without taking on undue credit risks.
We believe VCB’s superior earnings will persist due to: 1) sector-low cost
of funds which is driven by a relatively high CASA ratio of c.30%. 2)
superior credit growth outlook given its compliance with Basel II. 3) the
application of its competitive strengths in retail banking.
Liquidity (Rating: 1.6): Liquidity appears to be the best among banks,
with net LDR of only 77.5%, which is well-below the regulatory cap of 90%
for SOCBs.
Company Profile
Ticker
VCB VN
(SOCB)
(Initiated in Jun 2019)
Target price
VND 75,270
(Upside: +4%)
Total Asset
VND 1,073 tn
(USD 46 bn)
Total Chartered capital
VND 37.1 tn
(USD 1.6 bn)
Shareholders
Company overview
VCB is the 3rd largest
listed
SOCB
by
assets, with 16%
market share in 1Q19
among listed banks.
VCB’s
strong
competitive
rests
largely on a high
CASA ratio of 30% as
at 1Q19, reasonable
Basel II CAR of 9.7%,
and broad national
footprint (with 552
branches
and
transaction office and
16.8 million e-banking
users).
Revenue breakdown
Net interest income
accounted for 79% of the
total adjusted revenue.
Retail loan was 46% of
the total loan in 2018 vs.
just 28% in 2015, and we
think the retail-focused
strategy coupled with the
Bank’s sustained relative
low funding cost should
drive NIM higher in the
coming years.
Asset Quality
Sound asset quality. The
Bank’s NPL ratio was at a
low level of 1.03% in 1Q19
(below the SBV’s target of
3%). The NPL ratio
(including special mention
loan) was only 1.61% in
1Q19.
Major Shareholders
Others,
7.65%
Mizuho,
15.00%
GIC,
2.55%
SBV,
74.8
0%
Currently, the Bank has no
exposure to VAMC bond
as it cleared in 2016.
Market Cap
Market cap:
VND 257 tn (USD 11 bn)
2019E P/BV (*): 3.3x
Capital Adequacy
After issuing 111.1 mn shares
to Mizuho Bank (16.7 mn
shares) and GIC (94.4 mn
shares) in 2018, CET1 ratio
and CAR ratio jumped from
7.8% and 10.7% to 8.6% and
11.5%, respectively. However,
we estimate that CAR under
Basel II is 10% (1.5ppt lower
under Circular 36 and in line
with guidance of 9.7%).
The
Bank
is
quite
conservative with a high
loan loss coverage ratio of
169% as at 1Q19.
Subsidiaries & JV:
VCBS, VCBF, VCB
Cardif…
Remaining FOL: 6.2%
Page 25