Tài liệu Service Level and Performance Monitoring pptx
Bạn đang xem bản rút gọn của tài liệu. Xem và tải ngay bản đầy đủ của tài liệu tại đây (166.99 KB, 26 trang )
Service Level and
Performance
Monitoring
W
indows 2000 Server is being widely considered as an
alternative to mainframe-type systems for high-end
computing requirements. This will place tremendous burden
and responsibility on Windows 2000 administrators to ensure
maximum availability of systems. This chapter thus discusses
service level and provides an introduction to Windows 2000
Server performance monitoring.
What Is Service Level?
If there is anything you have learned in this book, it is this:
Windows 2000 is a major-league operating system. In our opin-
ion, it is the most powerful operating system in existence . . .
for the majority of needs of all enterprises. Only time and ser-
vice packs will tell if Windows 2000 can go up against the big
irons such as AS/400, Solaris, S/390, and the like.
Microsoft has aimed Windows 2000 Server squarely at all lev-
els of business and industry and at all business sizes. You will
no doubt feel the rush of diatribe in the industry: 99.9 this,
10,000 concurrent hits that, clustering and load balancing, and
more. But every system, server or OS, has its meltdown point,
weak links, single point of failure (SPOF), “tensile strength,”
and so on. Knowing, or at least predicting, the meltdown
“event horizon” is more important than availability claims.
Trust us, poor management will turn any system or service
into a service level nightmare.
20
20
CHAPTER
✦✦✦✦
In This Chapter
Service Level
Management
Windows 2000
Service Level Tools
Task Manager
The Performance
Console
Performance
Monitoring
Guidelines
✦✦✦✦
4667-8 ch20.f.qc 5/15/00 2:08 PM Page 719
720
Part V ✦ Availability Management
One of the first things you need to ignore in the press from the get-go is the crazy
comparisons of Windows 2000 to $75 operating systems, and so on. If your busi-
ness is worth your life to you and your staff, you need to invest in performance and
monitoring tools, disaster recovery, Quality of Service tools, service level tools, and
more. Take a survey of what these tools can cost you. Windows 2000 Server out of
the box has more built in to it than anything else, as this chapter will illustrate.
On our calculators, Windows 2000 Server is the cheapest system going on
performance-monitoring tools alone.
Windows 2000 is no doubt going to be adopted by many organizations; it will cer-
tainly replace Windows NT over the next few years and will probably become the
leading server operating system on the Internet. With application service providing
(ASP), thin-client, Quality of Service, e-commerce, distributed networking architec-
ture (DNA), and the like becoming implementations everywhere as opposed to
being new buzzwords, you, the server or network administrator, are going to find
yourself dealing with a new animal in your server room. This animal is known as
the service level agreement (SLA).
Before we discuss the SLA further, we should first define service level and, second,
how Windows 2000 addresses it.
Service Level (SL) is simply the ability of IT management or MIS to maintain a con-
sistent, maximum level of system uptime and availability. Many companies may
understand SL as quality assurance and quality control (QA/QC). Examples will
better explain it, as follows.
Service Level: Example 1
Management comes to MIS with a business plan for application services providing
(ASP). If certain customers can lease applications online, over reliable Internet con-
nections, for x rate per month, they will forgo expensive in-house IT budgets and
outsource instead. An ASP can, therefore, make its highly advanced network opera-
tions center and a farm of servers available to these businesses. If enough cus-
tomers lease applications, the ASP will make a profit.
The business plan flies if ASP servers and applications are available to customers
all the time from at least 7 a.m. to 9 p.m. The business plan will only tolerate a .09
percent downtime during the day. Any more and customers will lose respect for the
business and rather bring resources back in house. This means that IT or MIS must
support the business plan by ensuring that systems are never offline for more than
.09 percent of the business day. Response, as opposed to availability, is also a criti-
cal factor. And Quality of Service, or QoS, addresses this in SL. This will be dis-
cussed shortly in this chapter.
Note
4667-8 ch20.f.qc 5/15/00 2:08 PM Page 720
721
Chapter 20 ✦ Service Level and Performance Monitoring
Service Level: Example 2
Management asks MIS to take its order-placing system, typically fax-based and pro-
cessed by representatives in the field, to the extranet. Current practice involves a
representative going to a customer, taking an order for stock, and then faxing the
order to the company’s fax system, where the orders are manually entered into the
system. The new system proposes that customers be equipped with an inexpensive
terminal or terminal software and place the orders directly against their accounts
on a Web server.
MIS has to ensure that the Web servers and the backend systems, SQL Server 2000,
Windows 2000 Server, the WAN, and so on, are available all the time. If customers
find the systems offline, they will swamp the phones and fax machines, or simply
place their orders with the competition. The system must also be reliable, informa-
tive, and responsive to the customers’ needs.
The Service Level Agreement
The first example may require a formal service level agreement. In other words, the
SLA will be a written contract signed between the client and the provider. The cus-
tomer demands that the ASP provide written—signed—guarantees that the sys-
tems will be available 99.9 percent of the time. The customer demands such an SLA,
because it cannot afford to be in the middle of an order-processing application, or
sales letter, and then have the ASP suddenly disappear.
The customer may be able to tolerate a certain level of unavailability, but if SL
drops beyond what’s tolerable, the customer needs a way to obtain redress from
the ASP. This redress could be the ability to cancel the contract, or the ability to
hold the ASP accountable with penalties, such as fines, discount on service costs,
waiver of monthly fees, and so on. Whatever the terms of the SLA, if the ASP cannot
meet it, then MIS gets the blame.
In the second example, there is unlikely to be a formal SLA between a customer and
the supplier. Service level agreements will be in the form of memos between MIS
and other areas of management. MIS will agree to provide a certain level of avail-
ability to the business model or plan. These SLAs are put in writing and usually
favored by the MIS, who will take the SLA to budget and request money for systems
and software to meet the SLA.
However, the SLA can work to the disadvantage of MIS, too. If SL is not met, the MIS
staff or CTO may get fired, demoted, or reassigned. The CEO may also decide to
outsource or force MIS to bring in expensive consultants (which may help or hurt
MIS).
4667-8 ch20.f.qc 5/15/00 2:08 PM Page 721
722
Part V ✦ Availability Management
In IT shops that now support SL for mission-critical applications, there are no mar-
gins for tolerating error. Engineers who cannot help MIS meet SL do not survive
long. Education and experience are likely to be high on the list of employment
requirements.
Service Level Management
Understanding Service Level Management (SLM) is an essential requirement for MIS
in almost all companies today. This section examines critical SLM factors that have
to be addressed.
Problem Detection
This factor requires IT to be constantly monitoring systems for advanced warnings
of system failure. You use whatever tools you can obtain to monitor systems and
focus on all the possible points of failure. For example, you will need to monitor
storage, networks, memory, processors, power, and so on.
Problem detection is a lot like earthquake detection. You spend all of your time lis-
tening to the earth, and the quake comes when you least expect it and where you
least expect it. Then, 100 percent of your effort is spent on disaster recovery (DR).
Your DR systems then need to kick in to recover. According to research from the
likes of Forrester Research, close to 40 percent of IT management resources are
spent on problem detection.
Performance Management
Performance Management accounts for about 20 percent of MIS resources. This fac-
tor is closely related to problem detection. You can hope that poor performance in
areas such as networking, access times, transfer rates, restore or recover perfor-
mance, and so on, will point to problems that can be fixed before they turn into dis-
asters. However, most of the time a failure is usually caused by failures in another
part of the system. For example, if you get a flood of continuous writes to a hard
disk that does not let up until the hard disk crashes, is the hard disk at fault or
should you be looking for better firewall software?
The right answer is a combination of both factors. The fault is caused by the poor
quality of firewall software that gives passage to a denial-of-service attack. But in
the event this happens again, we need hard disks that can stand the attack a lot
longer.
4667-8 ch20.f.qc 5/15/00 2:08 PM Page 722
723
Chapter 20 ✦ Service Level and Performance Monitoring
Availability
Availability, for the most part, is a post-operative factor. In other words, availability
management covers redundancy, mirrored or duplexed systems, fail-overs, and so
on. Note that fail-over is emphasized because the term itself denotes taking over
from a system that has failed.
Clustering of systems or load balancing, on the other hand, is also as much disaster
prevention as it is a performance-level maintenance practice. Using performance
management, you would take systems to a performance point that is nearing
threshold or maximum level, then you switch additional requests for service to
other resources. A fail-over, on the other hand, is a machine or process that picks
up the users and processes that were on a system that has just failed, and it is sup-
posed to allow the workload to continue uninterrupted on the fail-over systems. A
good example of fail-over is a mirrored disk, or a RAID-5 storage set: The failure of
one disk does not interrupt the processing, which carries on oblivious to the failure
on the remaining disks, giving management time to replace the defective compo-
nents.
There are several other SL-related areas that IT spends time on and which impact
SLM. These include change management and control, software distribution, and
systems management. See Chapter 11 for an extensive discussion of Change
Management.
SLM by Design
SLM combines tools and metrics or analysis to meet the objectives of SL and
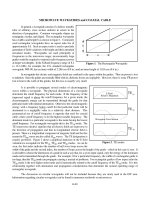
Service Level Agreements. The SLM model is a three-legged stool, as illustrated
in Figure 20-1.
The availability leg supports the model by guaranteeing availability of critical sys-
tems. The administration leg ensures 24×7 operations and administrative house-
keeping. The performance leg supports the model by assuring that systems are able
to service the business and keep systems operating at threshold points considered
safely below bottleneck and failure levels. If one of the legs fails or becomes weak,
the stool may falter or collapse, which puts the business at risk.
When managing for availability, the enterprise will ensure it has the resources to
recover from disasters as soon as possible. This usually means hiring gurus or
experts to be available on-site to fix problems as quickly as possible. Often, man-
agement will pay a guru who does nothing for 95 percent of his or her time, which
seems a waste. But if they can fix a problem in record time, they will have earned
their keep several times over.
Note
4667-8 ch20.f.qc 5/15/00 2:08 PM Page 723
724
Part V ✦ Availability Management
Figure 20-1: The SLM model is a three-legged stool.
Often, a guru will restore a system that, had it stayed offline a few days longer,
would have cost the company much more than the salary of the guru. However, it
goes without saying that the enterprise will save a lot of money and effort if it can
obtain gurus who are also qualified to monitor for performance and problems, and
who do not just excel at recovery. This should be worth 50 percent more salary to
the guru.
Administration is the effort of technicians to keep systems backed up, keep power
supplies on line, monitor servers for error messages, ensure server rooms remain
at safe temperatures and air circulation, and so on. The administrative leg manages
the SL budget, hires and fires, maintains and reports on service level achievement,
and reports to management or the CEO.
The performance leg is usually carried out by analysts who know what to look
for in a system. These analysts get paid the big bucks to help management decide
how to support business initiatives and how to exploit opportunity. They need to
know everything there is about the technology and its capabilities. For example,
they need to know which databases should be used, how RAID works and the level
required, and so on. They are able to collect data, interpret data, and forecast
needs.
Availability
Administration
Performance
4667-8 ch20.f.qc 5/15/00 2:08 PM Page 724
725
Chapter 20 ✦ Service Level and Performance Monitoring
SLM and Windows 2000 Server
Key to meeting the objective of SLM is the acquisition of SL tools and technology.
This is where Windows 2000 Server comes in. While clustering and load balancing
are included in Advanced Server and Datacenter Server, the performance and sys-
tem monitoring tools and disaster recovery tools are available to all versions of
the OS.
These tools are essential to SL. Acquired independently of the operating systems,
they can cost an arm and a leg, and they might not integrate at the same level.
These tools on Windows NT 4.0 were seriously lacking. On Windows 2000, however,
they raise the bar for all operating systems. Many competitive products unfortu-
nately just do not compete when it comes to SLM. The costs of third-party tools
and integration for some operating systems are so prohibitive that they cannot be
considered of any use to SLM whatsoever.
The Windows 2000 monitoring tools are complex, and continued ignorance of them
will not be tolerated by management as more and more customers demand SL com-
pliance and service level agreements. The monitoring and performance tools on
Windows 2000 include the following:
✦ System Monitor
✦ Task Manager
✦ Event Viewer
✦ Quality of Service
✦ Windows Management Interface
✦ SNMP
We are not going to provide an exhaustive investigation into the SLM tools that ship
with Windows 2000, or how to use each and every one. Such an advanced level of
analysis would take several hundred pages, and it is thus beyond the scope of this
book. Performance monitoring is also one of the services and support infrastruc-
tures that ships with Windows 2000 but takes some effort to get to know and mas-
ter. However, the information that follows will be sufficient to get you started.
Windows 2000 System Monitoring Architecture
Windows 2000 monitors or analyzes storage, memory, networks, and processing.
This does not sound like a big deal, but the data analysis is not done on these areas
per se. In other words, you do not monitor memory itself, or disk usage itself, but
4667-8 ch20.f.qc 5/15/00 2:08 PM Page 725
726
Part V ✦ Availability Management
rather how software components and functionality use these resources. In short, it
is not sufficient to just report that 56MB of RAM were used between time x and time
y. Your investigations need to find out what used the RAM at a certain time and why
so much was used.
If a system continues to run out of memory, there is a strong possibility, for exam-
ple, that an application is stealing the RAM somewhere. In other words, the applica-
tion or process has a bug and is leaking memory. When we refer to memory leaks,
this means that software that has used memory has not released it after it is done.
Software developers are able to watch their applications on servers to be sure they
release all the memory they use.
What if you are losing memory and you do not know which application is responsi-
ble? Not too long ago, Windows NT servers used on the Internet and in high-end
mail applications (no fewer than 100,000 e-mails per hour) would simply run out of
RAM. After extensive system monitoring, we were able to determine that the leak
was in the latest release of the Winsock libraries responsible for Internet communi-
cations on NT. Another company in Europe found the leak about the same time.
Microsoft later released a patch. It turned out that the Winsock functions responsi-
ble for releasing memory were not able to cope with the rapid demand on the sock-
ets. They were simply being opened at a rate faster than the Winsock libraries
could cope with.
The number of software components, services, and threads of functionality in
Windows 2000 are so numerous that it is literally impossible to monitor tens of
thousands of instances of storage, memory, network, or processor usage.
To achieve such detailed and varied analysis, Windows 2000 includes built-in soft-
ware objects, associated with services and applications, which are able to collect
data in these critical areas. So when you collect data, the focus of your data collec-
tion is on the software components, in various services of the operating system,
that are associated with these areas. When you perform data collection, the system
collects data from the targeted object managers in each monitoring area.
There are two methods of data collection supported in Windows 2000. The first one
involves accessing registry pointers to functions in the performance counter DLLs
in the operating system. The second supports collecting data through the Windows
Management Infrastructure (WMI). WMI is an object-oriented framework that allows
you to instantiate (create instances of) performance objects that wrap the perfor-
mance functionality in the operating system.
The OS installs a new technology for recovering data through WMI. These are
known as managed object files (MOFs). These MOFs correspond to or are associ-
ated with resources in a system. The number of objects that are the subject of per-
formance monitoring are too numerous to list here, but they can be looked up in
the Windows 2000 Performance Counters Reference, which is on the Windows 2000
4667-8 ch20.f.qc 5/15/00 2:08 PM Page 726
727
Chapter 20 ✦ Service Level and Performance Monitoring
Resource Kit CD (see Appendix B). However, they include the operating system’s
base services, such as the services that report on the RAM, Paging File functional-
ity, and Physical Disk usage, and the operating system’s advanced services, such as
Active Directory, Active Server Pages, the FTP service, DNS, WINS, and so on.
To understand the scope and usage of the objects, it helps to first understand some
performance data and analysis terms. There are three essential concepts to under-
standing performance monitoring. These are throughput, queues, and response time.
From these terms, and once you fully understand them, you can broaden your
scope of analysis and perform calculations to report transfer rate, access time,
latency, tolerance, thresholds, bottlenecks, and so on.
What is Rate and Throughput?
Throughput is the amount of work done in a unit of time. If your child is able to con-
struct 100 pieces of Lego bricks per hour, you could say that his or her assemblage
rate is 100 pieces per hour, assessed over a period of x hours, as long as the rate
remains constant. However, if the rate of assemblage varies, through fatigue,
hunger, thirst, and so on, we can calculate the throughput.
Throughput increases as the number of components increases, or the available
time to complete a job is reduced. Throughput depends on resources, and time and
space are examples of resources. The slowest point in the system sets the through-
put for the system as a whole. Throughput is the true indicator of performance.
Memory is a resource, the space in which to carry out instructions. It makes little
sense to rate a system by millions of instructions per second, when insufficient
memory is not available to hold the instruction information.
What Is a Queue?
If you give your child too many Lego bricks to assemble, or reduce the available
time in which he or she has to perform the calculation and assemblage, the number
of pieces will begin to pile up. This happens too in software and IS terms, where the
number of threads can begin to back up, one behind the other, in a queue. When a
queue develops, we say that a bottleneck has occurred. Looking for bottlenecks in
the system is key to monitoring for performance and troubleshooting or problem
detection. If there are no bottlenecks, the system might be considered healthy, but
a bottleneck might soon start to develop.
Queues can also form if requests for resources are not evenly spread over the unit
of time. If your child assembles one piece per minute evenly every minute, he or
she will get through 60 pieces in an hour. But if the child does nothing for 45 min-
utes and then suddenly gets inspired, a bottleneck will occur in the final 15 minutes
because there are more pieces than the child can process in the remaining time. On
4667-8 ch20.f.qc 5/15/00 2:08 PM Page 727
728
Part V ✦ Availability Management
computer systems when queues and bottlenecks develop, systems become unre-
sponsive. Additional requests for processor or disk resources are stalled. When
requesting services are not satisfied, the system begins to break down. In this
respect, we reference the response time of a system.
What Is Response Time?
Response time is the measure of how much time elapses between the firing of a
computer event, such as a read request, and the system’s response to the request.
Response time will increase as the load increases because the system is still
responding to other events and does not have enough resources to handle new
requests. A system that has insufficient memory and/or processing ability will pro-
cess a huge database sort a lot slower than a better-endowed system with faster
hard disks and CPUs. If response time is not satisfactory, you will either have to
work with less data or increase the resources.
Response time is typically measured by dividing the queue length over the resource
throughput. Response time, queues, and throughput are reported and calculated by
the Windows 2000 reporting tools.
How Performance Objects Work
Windows 2000 performance monitoring objects contain functionality known as per-
formance counters. These so-called counters perform the actual analysis. For exam-
ple, a hard disk object is able to calculate transfer rate, while a
processor-associated object is able to calculate processor time.
To gain access to the data or to start the data collection, you first have to create
the object and gain access to its functionality. This is done by calling a
create func-
tion from a user interface or other process. As soon as the object is created, and its
data collection functionality invoked, it begins the data-collection process and
stores the data in various properties. Data can be streamed out to disk, in files,
RAM, or to other components that assess the data and present it in some meaning-
ful way.
Depending on the object, your analysis software can create at least one copy of the
performance object and analyze the counter information it generates. You need to
consult Microsoft documentation to “expose” the objects to determine if the object
can be created more than once concurrently. If it can be created more than once,
you will have to associate your application with the data the object collects by ref-
erencing the object’s instance counter. Windows 2000 allows you to instantiate an
object for a local computer’s services, or you can create an object that collects data
from a remote computer.
4667-8 ch20.f.qc 5/15/00 2:08 PM Page 728
729
Chapter 20 ✦ Service Level and Performance Monitoring
There are two methods of data collection and reporting made possible using perfor-
mance objects. First, the objects can sample data. This means that data is collected
periodically rather than when a particular event occurs. All forms of data collection
place a burden on resources, which means that monitoring in itself can be a burden
to systems. Sampled data has the advantage of being a period-driven load, but the
disadvantage is that values may be inaccurate when a certain activity falls outside
the sampling period or between events.
The other method of data collection is event tracing. Event tracing, new to Windows
2000, is able to collect data as certain events occur. Because there is no sampling
window, you can correlate resource usage against events. For example, you can
watch an application consume memory when it executes a certain function and
monitor how and if it releases that memory when the function completes.
The disadvantage of event tracing is that it consumes more resources than sam-
pling, so you would only want to perform event tracing for short periods where the
objective of the trace is to troubleshoot, and not to just monitor.
Counters are able to report their data in one of two ways: instantaneous counting
or average counting. An instantaneous counter displays the data as it happens; it is
a snapshot. In other words, the counter does not compute the data it receives and
just reports it. On the other hand, average counting computes the data for you. For
example, it is able to compute bits per second, or pages per second, and so on.
Other counters are able to report percentages, difference, and so on.
System Monitoring Tools
Before you rush out and buy a software development environment to access the
performance monitoring routines, you should know that Windows 2000 comes
equipped with two primary, ready-to-go monitoring tools: the Performance Console
and Task Manager. Task Manager provides an instant view of systems activity such
as memory usage, processor activity, process activity, and resource consumption.
Task Manager is very helpful for an immediate detection of system problems. The
Performance Console is used to provide performance analysis and information that
can be used for troubleshooting and bottleneck analysis. It can also be used to
establish regular monitoring regimens such as ongoing server health analysis.
Performance Console comes with two tools built in: System Monitor and Perfor-
mance Logs and Alerts . . . but more about them later. The first tool, due to its
immediacy and as a troubleshooting and information tool, is the Task Manager.
4667-8 ch20.f.qc 5/15/00 2:08 PM Page 729
730
Part V ✦ Availability Management
Task Manager
Task Manager provides quick information on applications and services currently
running on your server. It provides information such as processor usage in percent-
age terms, memory usage, task priority, response, and some statistics about mem-
ory and processor performance.
Task Manager is very useful as a quick system sanity check, and it is usually evoked
as a troubleshooting tool when a system indicates slow response times, lockups or
errors, or messages pointing to lack of system resources, and so on.
Task Manager, illustrated in Figure 20-2, is started in several ways:
1. Right-click the taskbar (the bottom-right area where the time is usually
displayed) and select Task Manager from the Context menu.
2. Select Ctrl+Shift and hit the Esc key.
3. Select Ctrl+Alt and hit the Del key. The Windows Security dialog box loads.
Click Task Manager.
Figure 20-2: The Task Manager opened
to the Performance tab
When Task Manager loads, you will notice that the dialog box has three tabs:
Applications, Processes, and Performance. There are a number of useful tricks
with the Task Manager:
✦ The columns can be sorted in ascending or descending order by clicking the
column heads. The columns can also be resized.
4667-8 ch20.f.qc 5/15/00 2:08 PM Page 730
731
Chapter 20 ✦ Service Level and Performance Monitoring
✦ When the Task Manager is running, a CPU gauge icon displaying accurate
information is placed into the system tray on the bottom-right of the screen.
If you drag your mouse cursor over this area, you will obtain a pop-up menu
of current CPU usage.
✦ It is also possible to keep the Task Manager button off the system tray if you
use it a lot. This is done by selecting the Options menu and then checking the
Hide When Minimized option. The CPU icon next to the system time remains,
however.
✦ You can control the rate of Refresh or Update from the View➪ Update Speed
menu. You can also pause the update to preserve resources and click Refresh
Now to update the display at any time.
The Process tab is the most useful and provides a list of running processes on the
system. It measures their performance in simple data. These include CPU percent
used, the CPU time allocated to a resource, and memory usage.
There are a number of additional performance or process measures that can be
added to or removed from the list on the Processes page. Select View➪ Select
Columns. This will show the Select Columns dialog box that will allow you to add
or subtract Process counters to the Processes list.
A description of each process counter is available in Windows 2000 Help.
It is also possible to terminate a process by selecting the process in the list and
then clicking the End Process button. Some processes are protected, but you can
terminate them using the kill or remote kill utilities that are included in the operat-
ing system (see Appendix B for more information on
kill and rkill). You will
need authority to kill processes, and before you do, you should fully understand
the ramifications of terminating a process.
The Performance tab (shown in Figure 20-2) allows you to graph the percentage of
processor time in kernel mode. To show this, select the View menu and check the
Show Kernel Times option. The Kernel Times is the measure of time that applica-
tions are using operating system services. The remaining time, known as User
mode, is spent in threads that are spawned by applications.
If your server supports multiple processes, you can click CPU History on the View
menu and graph each processor in a single graph pane or in separate graph panes.
The Application tab lists running applications and allows you to terminate an appli-
cation that has become unresponsive or that you determine is in trouble or is the
cause of trouble on the server.
4667-8 ch20.f.qc 5/15/00 2:08 PM Page 731
732
Part V ✦ Availability Management
Performance Console
Performance Console includes the System Monitor, discussed first, and Perfor-
mance Logs and Alerts, which is discussed next. System Monitor is really a new ver-
sion of Performance Monitor (known as perfmon on Windows NT). It can be opened
from Administrative Tools➪ Performance➪ System Monitor. Performance Console
can be loaded like all MMC snap-ins from the Run console, Task Manager, or com-
mand line as
perfmon.msc.
When the Performance Console starts, it loads a blank System Monitor graph into
the console tree.
System Monitor
System Monitor allows you to analyze system data and research performance and
bottlenecks. The utility allows you to create graphs, histograms (bar charts), and
textual reports of performance counter data. System Monitor is ideal for short-term
viewing of data and for diagnostics.
System Monitor is illustrated in Figure 20-3 and includes the following features:
✦ System Monitor is hosted in MMC, which makes it portable. The snap-in can
take aim at any computer and monitor remote processing on that computer.
✦ It provides a toolbar that can be used to copy and paste counters, purge or
clear counters, add counters, and so on.
✦ You have extensive control on how counter values are displayed. For example,
you can vary the line style and width and change the color of the lines. You
can also change the color of the chart and then manipulate the chart window.
✦ Legends indicate selected counters and associated data such as the name of
the computer, the objects, and object instances.
✦ System Monitor is an ActiveX control named
sysmon.ocx. You can load the
OCX into any OLE-compliant application, such as Microsoft Word or Visio, and
even an HTML page on a Web site. The OCX is also useful in applications that
can be specifically created for performance monitoring and analysis.
Firstly, the monitor can be configured using the toolbar or the Shortcut menu. The
Shortcut menu is loaded by right-clicking in the blank-graph area and selecting the
appropriate option. The toolbar is available by default.
Using the toolbar, you can configure the type of display to view by clicking the View
Chart, View Histogram, or View Report buttons. In other words, the same informa-
tion can be viewed in chart, histogram, or report format.
4667-8 ch20.f.qc 5/15/00 2:08 PM Page 732
733
Chapter 20 ✦ Service Level and Performance Monitoring
Figure 20-3: The Performance Console
The differences in the view formats should be noted. The histograms and charts
can be used to view multiple counters. However, each counter only displays a
single value. You use these to track current activity, and view the graphs as they
change. The report is more suited to multiple values.
Your data source is obtained by clicking the View Current Activity button for real-
time data. You can also select the View Log File Data button, which will allow you to
obtain data from completed or running logs.
Of course, you first have to select counters. The counter buttons in the middle
of the toolbar include Add, Delete, and the New Counter Set button. The latter
resets the display and allows you to select new counters. When you click the Add
Counters button, the dialog box, illustrated in Figure 20-4, is shown.
Figure 20-4: The Add Counters dialog box
4667-8 ch20.f.qc 5/15/00 2:08 PM Page 733
734
Part V ✦ Availability Management
This dialog box allows you to select the computer you are aiming to monitor, and to
select performance objects and counters. Notice also the Explain button. You can
click this to learn more about the individual counters you select.
In addition, you update the display with the Clear Display option. You can also
freeze the display with the Freeze Display button, which suspends data collection.
Click the Update Data button to resume collection.
Clicking the Highlight button lets you highlight chart or histogram data. This serves
the purpose of highlighting the line or bar for a selected counter with a white or
black background.
The display can also be exported. You can, for example, save it to the Clipboard.
Conversely, a saved display can be imported into the running display.
Finally, the Properties button allows you access to settings that control fonts, col-
ors, and so on. When you click it, the System Monitor Properties dialog box loads,
as shown in Figure 20-5.
Figure 20-5: The System Monitor
Properties dialog box
There are several ways you can save data from the monitor. Besides the clipboard
option described previously, you can add the control to a host application, as dis-
cussed earlier. But by far the easiest means of preserving the look and feel of the
display is to save the control as an HTML file. Right-clicking the pane and saving the
display as an HTML file does this, and it is the default Save As format.
Alternately, you can import the log file in comma-separated (CSV) or tab-separated
(
.tsv) format and then import the data in a spreadsheet, database, or report pro-
gram such as Crystal Reports.
4667-8 ch20.f.qc 5/15/00 2:08 PM Page 734
735
Chapter 20 ✦ Service Level and Performance Monitoring
Working with the Add Counters dialog box, you can select all counters and instances
or specific counters and instances to monitor from the list. Keep in mind that the
more you monitor, the more system resources you will use. If you monitor a large
amount of monitors and counters, consider redirecting the data to log files and then
reading the log file data in the display. It makes more sense, however, to work with
fewer counters and instances.
It is possible to run two instances of System Monitor (in two performance
consoles). This may make it easier to compare data from different sources.
In the instances list box, the first value, _Total, allows you to add all the instance
values and report them in the display.
The lines in the display can also be matched with their respective counters by
selecting the line in the display.
Performance Logs and Alerts
The Windows 2000 Performance utilities can produce two types of performance-
related logs: counter logs and trace logs. These logs are useful for advanced perfor-
mance analysis and record-keeping that can be done over a period of time. There
is also an alerting mechanism. The Performance Logs and Alerts tree is shown in
Figure 20-6. The tool is part of the Performance console snap-in and is thus started
as described earlier.
Figure 20-6: The Performance Logs and Alerts tree
The Counter Logs record sampled data about hardware resources and system ser-
vices based on the performance objects described earlier. It works with counters in
the same manner as System Monitor. The Performance Logs and Alert Service
obtains data from the operating system when the update interval has elapsed.
Trace logs collect event traces. With trace logs, you can measure performance asso-
ciated with events related to memory, storage file I/O, and so on. As soon as the
event occurs, the data is sent to the logs. The data is measured continuously from
Note
4667-8 ch20.f.qc 5/15/00 2:08 PM Page 735
736
Part V ✦ Availability Management
the start of the event to the end of the event, as opposed to the sampling that is
performed by the System Monitor.
The Performance Logs data is obtained by the default Windows 2000 kernel trace
provider. You can analyze the data using a data-parsing tool.
The alerting function is used to define a counter value that will trigger an alert that
can send a network message, execute a program, or start a log. This is useful for
maintaining a close watch on systems. You can, for example, monitor unusual activ-
ity that does not occur consistently and define an alert to let you know when the
event has been triggered. Security-related events are good candidates for the alert
service. When you are trying to catch a hacker, there is no better time than when
he or she is in the act.
You can also configure the alert service to notify you when a particular resource
drops below or exceeds certain values, thresholds, or baselines that you establish.
Counter Logs can also be viewed in System Monitor, and the Counter Log data can
be saved to CSV and TSV files and viewed in a spreadsheet, or report software. You
can configure the logs to be circular, which means that when the log file reaches a
predetermined size, it will be overwritten. Logs can be linear, and you can collect
data for predefined lengths of time. Logs can be stopped and restarted based on
parameters you set.
Like the System Monitor, you can save files to various formats, such as HTML, or
import the entire control OCX into an OLE container.
Using Logs and Alerts
To start using Logs and Alerts, right-click the details pane and select the New Log
Settings option. You are first asked to name the log or alert before you can define its
properties.
To use Logs and Alerts, you need to have Full Control access to the following reg-
istry subkey: HKEY_CURRENT_MACHINE\SYSTEM\CurrentControlSet\Services\
SysmonLog\Log_Queries. This key is open to administrators by default, but access
can also be given by way of the Security menu in Regedt32. Also, to run or config-
ure the service, you will need the right to start or configure services on the system.
Again, administrators have this right by default, but it can be conveyed through
security group membership and Group Policy.
Upon choosing the Properties option, the Counter Log Properties or Trace Log
Properties dialog box loads, as illustrated in Figures 20-7 and 20-8, respectively.
The Log and Alert properties are configured, as demonstrated next.
Note
4667-8 ch20.f.qc 5/15/00 2:08 PM Page 736
737
Chapter 20 ✦ Service Level and Performance Monitoring
Figure 20-7: Counter Log properties
To configure alerts, you first need to configure counters for the alerts, the sample
interval, and the alert threshold. Then you need to configure an action to take when
an event occurs. These can include running a program, sending a message, trigger-
ing a counter log, or writing to the event log.
Figure 20-8: The Trace Log properties
4667-8 ch20.f.qc 5/15/00 2:08 PM Page 737
738
Part V ✦ Availability Management
Alert startup can also be configured by providing Start and Stop parameters.
To configure Counter Logs, you need to set the Counter Log counters and provide a
sample interval. To write to log files, you need to provide a file type, size, path, and
any automatic naming parameters needed. The Counter Logs should be defined as
SCV files or TSV files, text files, or binary linear or circular files.
Counter Logs can also be scheduled to start automatically, but you cannot config-
ure the service to automatically restart if a log file is configured to stop manually.
The same criteria apply to Trace Logs.
Getting to Know Your Servers
To maintain service level and keep servers and applications available, you need to
become familiar with each of your machines, the applications running on them, and
the resources they use. But it is insufficient to maintain a subjective feel for how a
server is “supposed” to operate. Mission-critical applications, server attacks, and
system failures can happen suddenly. System monitoring is thus a chore in which
you should be engaged continuously.
When you first begin to monitor a system, you basically have nothing to compare
it against. After a considerable amount of data has been collected, you will have a
data set to work with. You will need to collect data over several weeks, possibly
even months, and then based on the assessment of that data, you need to establish
baselines against which to base future observation. Normal for some machines may
be aggressive CPU usage, while other machines may sit idle for most of their lives.
If a system is unstable collecting data, setting alerts like crazy is only going to com-
pound the problem. Your first option will be to determine the cause of the insta-
bility and then set up monitoring and alerts to determine the cause of the
instability in the first place. In the event of an unresponsive system, your first
option will be to run Task Manager and attempt to end the tasks, applications, and
processes that are causing the problems.
With a baseline in hand, you will quickly be alerted to performance that is out of
the ordinary. For example, if you notice that at night your mail server’s responsive-
ness begins to diminish suddenly, you may find that the server is being hacked for
its relay services, which can be compared to riding on a train without paying the
fare. A memory counter would be the object that alerts you as to when this is
taking place.
Your information should also reflect various points in system performance. You
should note what constitutes normal on a server. For example, we noticed that a
client’s mail server was low on RAM and had begun to page out to disk excessively.
Tip
4667-8 ch20.f.qc 5/15/00 2:08 PM Page 738
739
Chapter 20 ✦ Service Level and Performance Monitoring
When we queried this with the MIS, he advised it was “normal” for this time of the
day due to replication services.
It is thus important to note periods of low usage, average usage, and high or peak
usage. Systems that provide real-time communications are good examples of
servers that should be monitored continuously for this type of information.
Make baseline performance information available within an arm’s reach of your
server. This can be in the form of clipboards or journals into which you can paste
data. This will allow other system operators to look up a server and determine
what might be considered normal.
Do not expect to obtain any meaningful insight into system performance from the
get-go, because the baselines you develop will establish typical values to expect
when your system is not experiencing problems.
Monitoring for Bottlenecks
As described previously, when the system performance deviates from your estab-
lished baselines, bottlenecks occur. It helps to have some guidelines, so the follow-
ing table suggests thresholds for a minimum set of system counters.
Table 20-1
Suggested System Counter Thresholds
Item Resource Object Counter Threshold
1 Disk LogicalDisk %Free Space 15%
2 Disk LogicalDisk %Disk Time 80%
3 Disk PhysicalDisk Disk Reads/sec Check the
Disk Writes/sec manufacturer’s
specifications
4 Disk PhysicalDisk Current Disk Number of
Queue Length spindles plus 2
5 Memory Memory Available Bytes 4MB, best not to
go below 16MB
6 Memory Memory Pages/sec 20 per second
7 Network Network % Net Utilization 30%
Segment
Continued
Tip
4667-8 ch20.f.qc 5/15/00 2:08 PM Page 739
740
Part V ✦ Availability Management
Table 20-1 (continued)
Item Resource Object Counter Threshold
8 Paging File Paging File % Usage Above 70%
9 Processor Processor % Processor Time 85%
10 Processor Processor Interrupts/sec 1,500 per second
11 Server Server Bytes Total/sec N/A
12 Server Server Work Item Shortages 3
13 Server Server Work Queue Length 4
Queues
14 Multiple System Processor Queue 2
Processors Length
These values are recommended for a minimum performance monitoring set. Some
of these options may vary and still be satisfactory for your server. The following list
of notes provides some additional guidance (the notes are numbered according to
the table):
1. A threshold of 15 percent free space may be too low depending on the pur-
pose of the machine. You can also ensure the threshold is never suddenly
exceeded with disk quotas. Although not all processes can be blocked from
using disk space, it is a good idea to configure alerts to signal you when the
threshold is exceeded.
2. The value given for Disk Time is a usage period. We are saying that the disk
should not be used more than 80 percent of the time. You need to check this
value against the advice of the manufacturer. Disks that exceed this usage may
not last long. We have seen disks easily overheat and crash when the thresh-
old scaled to 100 percent.
3. The transfer rate information of your disk is usually printed on the disk.
Program alerts you if the monitor reports that your rates are exceeding this.
If the applications are hammering your disks, you should upgrade to faster
technology, such as Ultra Wide SCSI.
4. The number of spindles is a snapshot; you should observe this value over
several intervals. You can also use the Avg. Disk Queue Length counter.
5. If memory drops below 4MB, paging activity will begin to increase and system
response will begin to wane. If the condition continues, you will get an error
message advising that system resources are getting low.
6. If memory use increases, watch that this threshold does not exceed your
baselines.
4667-8 ch20.f.qc 5/15/00 2:08 PM Page 740
741
Chapter 20 ✦ Service Level and Performance Monitoring
7. This value depends on the type of network you are running. For an Ethernet
network, your typical threshold will be around 30 percent.
8. You should fully understand how paging works before trying to make sense of
this counter, because the threshold varies according to the nature of the hard-
ware and the number of applications you have running (see Chapter 1 for
some guidelines).
9. The Processor Time can be easily observed in the Task Manager, as described
earlier. Any processor usage at the 85 percent and higher mark is cause for
concern. You can also use Task Manager to identify the process that is using
up your CPU’s bandwidth. If it is a critical function, like Exchange or SQL
Server, you might need to add another processor or upgrade to a faster CPU.
On stable or inactive machines, you will notice that the System Idle Process
uses the CPU most of the time.
10. This counter can be used to signal hardware problems. If the counter
increases dramatically without a corresponding increase in server activity, a
piece of hardware is responsible for the flood in interrupts. The hardware
could be a disk controller, a network interface card, or something similar.
11. Using the server counter, you can sum the total Bytes Total/sec for all servers,
and if the value is equal to the maximum transfer rate for the network, you
may have some segmenting to do.
12. If the value exceeds three, you may have to change parameters in the registry.
Look up information on WorkItems in the Microsoft knowledge base for a com-
plete discussion of the Work Item Shortages counter.
13. Server work queues is another snapshot counter that may signify a processor
bottleneck. You should observe this counter over several intervals.
14. The processor queue length is also a snapshot, and you should monitor the
counter over several intervals. A value higher than two over several intervals
requires investigation.
Understanding Server Workload
In addition to the starting points just described, you might find useful the following
monitoring suggestions for workload monitoring on some standard server configu-
rations. The following list provides a short description of objects to monitor by the
server role:
✦ Application Servers: These include standard application servers and
Terminal Services, or application, servers. Terminal Services are more
demanding and require constant performance monitoring. The heaviest
resource usage on these servers is memory and CPU. Objects to monitor
include Cache, Memory, Processors, and System.
4667-8 ch20.f.qc 5/15/00 2:08 PM Page 741
742
Part V ✦ Availability Management
✦ Backup Servers: These servers can create bottlenecks on the network and
suffer from extensive CPU usage. They may also place a burden on the
remote computer they connect to. Consider monitoring the System, Server,
Processor, and Network Segment objects.
✦ Database Server: Disks and CPU are the most taxed resources on database
servers. You would think that available memory is a taxed resource, but most
advanced database server technologies, such as SQL Server 2000, only keep a
small amount of “hot” data in memory (by caching records) for the majority
of queries. You particularly need fast hard disks for database servers, like
SQL 2000 or Oracle. Objects you should monitor include the PhysicalDisk,
LogicalDisk, Processor, and System.
✦ Domain Controllers: Domain controllers can eat up a lot of different resources,
including CPUs, disks, memory, and networks. You should monitor Memory,
CPU, System, Network Segment, Network Interface, and the protocol counter
objects, such as TCP, UDP, IP, NBT, connection, NetBEUI, NetBIOS, and so on.
You can also monitor Active Directory’s NTDS service objects and the Site
Server LDAP service objects. WINS and DNS also have applicable objects that
can be observed.
✦ File and Print Servers: These servers consume a lot of hard disk space and
network resources. Intensive color and graphics rendering (see Chapter 23)
can tax a CPU. Monitor here for CPU, Memory, Network Segment, Physical
Disk, and Logical Disk. You can also monitor the PrintQueue object to trou-
bleshoot spooling, and so on.
✦ Mail Servers: Mail servers, such as Exchange, use CPU, disks, and memory
the heaviest. You can monitor the memory collection, Cache, Processor,
System, PhsysicalDisk, and LogicalDisk objects. Exchange also ships with
specialized counters.
✦ Web/Internet Information Server: These servers consume extensive disk,
cache, and network components. Consider monitoring the Cache, Network
Segment, PhysicalDisk, and LogicalDisk objects.
Performance Monitoring Overhead
Monitoring performance requires resources, which can adversely affect the data
you’re trying to gather. Therefore, you need to decrease the impact of your perfor-
mance monitoring activities. There are several techniques you can use to ensure
that performance monitoring overhead is kept to a minimum on any server you are
monitoring.
4667-8 ch20.f.qc 5/15/00 2:08 PM Page 742
743
Chapter 20 ✦ Service Level and Performance Monitoring
✦ The System Monitor application can be demanding on resources. You can use
logs instead of displaying a graph, and then import the data into report pro-
grams and databases. Save logs to storage that are not being monitored, or to
a hard disk that is not the object of analysis. Also, make sure the logs are not
growing too big. You should set a quota and alert on the disk space, or make
sure to keep your eye on the disks.
✦ Do not use many counters at the same time. Some counters are costly and can
increase overhead, which will be counterproductive, and besides, it is hard to
monitor too many things at once. What each counter consumes in overhead is
available on the Windows 2000 Resource Kit.
✦ Tight collection intervals can also be costly. Microsoft recommends a
ten-minute interval for data collection.
✦ While taking care not to impact available resources, you should continue mon-
itoring during peak usage periods to obtain the best assessment of resource
usage. It makes no sense to monitor a system that is idle.
✦ Consider monitoring remotely. Remote monitoring allows for a centralized
data collection. You can also collect data from several servers and save the
data to the local machine. You must be aware, though, that what you save on
the swings, you might lose on the roundabout. Network bandwidth increases
with the more data you are collecting and the more often you collect. Consider
keeping the number of servers in a monitored group to no more than about 10
or 15. To increase network bandwidth, consider saving the remote data to log
files on the remote servers and then either copy the data to the local computer
or view it remotely.
Summary
This chapter introduced Service Level and Service Level Management. More and
more companies and business plans are demanding that MIS maintain SL standards.
To ensure that MIS or IT and IS managers adhere to the performance requirements
of the business, the Service Level Agreement, or SLA, is going to be seen a lot more
often in many enterprises.
As the e-commerce phenomenon continues to explode, so too will the number of
applications and business processes that demand SL adherence. The customer will
be more and more directly involved in the health of your systems. These include
data interchange systems, Web servers, applications servers, ISP equipment, and
so on.
4667-8 ch20.f.qc 5/15/00 2:08 PM Page 743