Tài liệu Active Filter Design Techniques ppt
Bạn đang xem bản rút gọn của tài liệu. Xem và tải ngay bản đầy đủ của tài liệu tại đây (308.02 KB, 66 trang )
Chapter 16
Active Filter Design Techniques
Literature Number SLOA088
Excerpted from
Op Amps for Everyone
Literature Number: SLOD006A
16-1
Active Filter Design Techniques
Thomas Kugelstadt
16.1 Introduction
What is a filter?
A filter is a device that passes electric signals at certain frequencies or
frequency ranges while preventing the passage of others. — Webster.
Filter circuits are used in a wide variety of applications. In the field of telecommunication,
band-pass filters are used in the audio frequency range (0 kHz to 20 kHz) for modems
and speech processing. High-frequency band-pass filters (several hundred MHz) are
used for channel selection in telephone central offices. Data acquisition systems usually
require anti-aliasing low-pass filters as well as low-pass noise filters in their preceding sig-
nal conditioning stages. System power supplies often use band-rejection filters to sup-
press the 60-Hz line frequency and high frequency transients.
In addition, there are filters that do not filter any frequencies of a complex input signal, but
just add a linear phase shift to each frequency component, thus contributing to a constant
time delay. These are called all-pass filters.
At high frequencies (> 1 MHz), all of these filters usually consist of passive components
such as inductors (L), resistors (R), and capacitors (C). They are then called LRC filters.
In the lower frequency range (1 Hz to 1 MHz), however, the inductor value becomes very
large and the inductor itself gets quite bulky, making economical production difficult.
In these cases, active filters become important. Active filters are circuits that use an op-
erational amplifier (op amp) as the active device in combination with some resistors and
capacitors to provide an LRC-like filter performance at low frequencies (Figure 16–1).
LR
C
V
IN
V
OUT
V
IN
V
OUT
R
1
C
1
C
2
R
2
Figure 16–1. Second-Order Passive Low-Pass and Second-Order Active Low-Pass
Chapter 16
Fundamentals of Low-Pass Filters
16-2
This chapter covers active filters. It introduces the three main filter optimizations (Butter-
worth, Tschebyscheff, and Bessel), followed by five sections describing the most common
active filter applications: low-pass, high-pass, band-pass, band-rejection, and all-pass fil-
ters. Rather than resembling just another filter book, the individual filter sections are writ-
ten in a cookbook style, thus avoiding tedious mathematical derivations. Each section
starts with the general transfer function of a filter, followed by the design equations to cal-
culate the individual circuit components. The chapter closes with a section on practical
design hints for single-supply filter designs.
16.2 Fundamentals of Low-Pass Filters
The most simple low-pass filter is the passive RC low-pass network shown in Figure 16–2.
R
C
V
IN
V
OUT
Figure 16–2. First-Order Passive RC Low-Pass
Its transfer function is:
A(s) +
1
RC
s )
1
RC
+
1
1 ) sRC
where the complex frequency variable, s = jω+σ , allows for any time variable signals. For
pure sine waves, the damping constant, σ, becomes zero and s = jω .
For a normalized presentation of the transfer function, s is referred to the filter’s corner
frequency, or –3 dB frequency, ω
C,
and has these relationships:
s +
s
w
C
+
jw
w
C
+ j
f
f
C
+ jW
With the corner frequency of the low-pass in Figure 16–2 being f
C
= 1/2πRC, s becomes
s = sRC and the transfer function A(s) results in:
A(s) +
1
1 ) s
The magnitude of the gain response is:
|A| +
1
1 ) W
2
Ǹ
For frequencies Ω >> 1, the rolloff is 20 dB/decade. For a steeper rolloff, n filter stages
can be connected in series as shown in Figure 16–3. To avoid loading effects, op amps,
operating as impedance converters, separate the individual filter stages.
Fundamentals of Low-Pass Filters
16-3Active Filter Design Techniques
R
C
R
C
R
C
R
C
V
IN
V
OUT
Figure 16–3. Fourth-Order Passive RC Low-Pass with Decoupling Amplifiers
The resulting transfer function is:
A(s) +
1
ǒ
1 ) a
1
s
Ǔǒ
1 ) a
2
s
Ǔ
AAA
(
1 ) a
n
s
)
In the case that all filters have the same cut-off frequency, f
C
, the coefficients become
a
1
+ a
2
+ AAA a
n
+ a + 2
n
Ǹ
* 1
Ǹ
, and f
C
of each partial filter is 1/α times higher than f
C
of the overall filter.
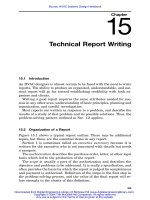
Figure 16–4 shows the results of a fourth-order RC low-pass filter. The rolloff of each par-
tial filter (Curve 1) is –20 dB/decade, increasing the roll-off of the overall filter (Curve 2)
to 80 dB/decade.
Note:
Filter response graphs plot gain versus the normalized frequency axis
Ω (Ω = f/f
C
).
Fundamentals of Low-Pass Filters
16-4
–40
–50
–60
–80
0.01 0.1 1 10
–20
–10
0
100
–30
–70
Frequency — Ω
Ideal 4th Order Lowpass
4th Order Lowpass
1st Order Lowpass
|A| — Gain — dB
–180
–270
–360
0.01 0.1 1 10
–90
0
100
Frequency — Ω
Ideal 4th
Order Lowpass
4th Order Lowpass
1st Order Lowpass
φ — Phase — degrees
Note: Curve 1: 1
st
-order partial low-pass filter, Curve 2: 4
th
-order overall low-pass filter, Curve 3: Ideal 4
th
-order low-pass filter
Figure 16–4. Frequency and Phase Responses of a Fourth-Order Passive RC Low-Pass Filter
The corner frequency of the overall filter is reduced by a factor of α ≈ 2.3 times versus the
–3 dB frequency of partial filter stages.
Fundamentals of Low-Pass Filters
16-5Active Filter Design Techniques
In addition, Figure 16–4 shows the transfer function of an ideal fourth-order low-pass func-
tion (Curve 3).
In comparison to the ideal low-pass, the RC low-pass lacks in the following characteris-
tics:
D The passband gain varies long before the corner frequency, f
C
, thus amplifying the
upper passband frequencies less than the lower passband.
D The transition from the passband into the stopband is not sharp, but happens
gradually, moving the actual 80-dB roll off by 1.5 octaves above f
C
.
D The phase response is not linear, thus increasing the amount of signal distortion
significantly.
The gain and phase response of a low-pass filter can be optimized to satisfy one of the
following three criteria:
1) A maximum passband flatness,
2) An immediate passband-to-stopband transition,
3) A linear phase response.
For that purpose, the transfer function must allow for complex poles and needs to be of
the following type:
A(s) +
A
0
ǒ
1 ) a
1
s ) b
1
s
2
Ǔǒ
1 ) a
2
s ) b
2
s
2
Ǔ
AAA
ǒ
1 ) a
n
s ) b
n
s
2
Ǔ
+
A
0
P
i
ǒ
1 ) a
i
s ) b
i
s
2
Ǔ
where A
0
is the passband gain at dc, and a
i
and b
i
are the filter coefficients.
Since the denominator is a product of quadratic terms, the transfer function represents
a series of cascaded second-order low-pass stages, with a
i
and b
i
being positive real coef-
ficients. These coefficients define the complex pole locations for each second-order filter
stage, thus determining the behavior of its transfer function.
The following three types of predetermined filter coefficients are available listed in table
format in Section 16.9:
D The Butterworth coefficients, optimizing the passband for maximum flatness
D The Tschebyscheff coefficients, sharpening the transition from passband into the
stopband
D The Bessel coefficients, linearizing the phase response up to f
C
The transfer function of a passive RC filter does not allow further optimization, due to the
lack of complex poles. The only possibility to produce conjugate complex poles using pas-
Fundamentals of Low-Pass Filters
16-6
sive components is the application of LRC filters. However, these filters are mainly used
at high frequencies. In the lower frequency range (< 10 MHz) the inductor values become
very large and the filter becomes uneconomical to manufacture. In these cases active fil-
ters are used.
Active filters are RC networks that include an active device, such as an operational ampli-
fier (op amp).
Section 16.3 shows that the products of the RC values and the corner frequency must
yield the predetermined filter coefficients a
i
and b
i
, to generate the desired transfer func-
tion.
The following paragraphs introduce the most commonly used filter optimizations.
16.2.1 Butterworth Low-Pass FIlters
The Butterworth low-pass filter provides maximum passband flatness. Therefore, a But-
terworth low-pass is often used as anti-aliasing filter in data converter applications where
precise signal levels are required across the entire passband.
Figure 16–5 plots the gain response of different orders of Butterworth low-pass filters ver-
sus the normalized frequency axis, Ω (Ω = f / f
C
); the higher the filter order, the longer the
passband flatness.
–20
–30
–40
–60
0.01 0.1 1 10
0
10
100
–10
–50
Frequency — Ω
1st Order
2nd Order
4th Order
10th Order
|A| — Gain — dB
Figure 16–5. Amplitude Responses of Butterworth Low-Pass Filters
Fundamentals of Low-Pass Filters
16-7Active Filter Design Techniques
16.2.2 Tschebyscheff Low-Pass Filters
The Tschebyscheff low-pass filters provide an even higher gain rolloff above f
C
. However,
as Figure 16–6 shows, the passband gain is not monotone, but contains ripples of
constant magnitude instead. For a given filter order, the higher the passband ripples, the
higher the filter’s rolloff.
–20
–30
–40
–60
0.01 0.1 1 10
0
10
100
–10
–50
Frequency — Ω
2nd Order
4th Order
9th Order
|A| — Gain — dB
Figure 16–6. Gain Responses of Tschebyscheff Low-Pass Filters
With increasing filter order, the influence of the ripple magnitude on the filter rolloff dimin-
ishes.
Each ripple accounts for one second-order filter stage. Filters with even order numbers
generate ripples above the 0-dB line, while filters with odd order numbers create ripples
below 0 dB.
Tschebyscheff filters are often used in filter banks, where the frequency content of a signal
is of more importance than a constant amplification.
16.2.3 Bessel Low-Pass Filters
The Bessel low-pass filters have a linear phase response (Figure 16–7) over a wide fre-
quency range, which results in a constant group delay (Figure 16–8) in that frequency
range. Bessel low-pass filters, therefore, provide an optimum square-wave transmission
behavior. However, the passband gain of a Bessel low-pass filter is not as flat as that of
the Butterworth low-pass, and the transition from passband to stopband is by far not as
sharp as that of a Tschebyscheff low-pass filter (Figure 16–9).
Fundamentals of Low-Pass Filters
16-8
–180
–270
–360
0.01 0.1 1 10
–90
0
100
Frequency — Ω
Butterworth
Bessel
Tschebyscheff
φ — Phase — degrees
Figure 16–7. Comparison of Phase Responses of Fourth-Order Low-Pass Filters
0.8
0.6
0.4
0
0.01 0.1 1 10
1.2
1.4
100
1
0.2
Frequency — Ω
Butterworth
Bessel
Tschebyscheff
T
gr
— Normalized Group Delay — s/s
Figure 16–8. Comparison of Normalized Group Delay (Tgr) of Fourth-Order Low-Pass Filters
Fundamentals of Low-Pass Filters
16-9Active Filter Design Techniques
–20
–30
–40
–60
0.1 1 10
0
10
–10
–50
Frequency — Ω
Butterworth
Bessel
Tschebyscheff
|A| — Gain — dB
Figure 16–9. Comparison of Gain Responses of Fourth-Order Low-Pass Filters
16.2.4 Quality Factor Q
The quality factor Q is an equivalent design parameter to the filter order n. Instead of de-
signing an n
th
order Tschebyscheff low-pass, the problem can be expressed as designing
a Tschebyscheff low-pass filter with a certain Q.
For band-pass filters, Q is defined as the ratio of the mid frequency, f
m,
to the bandwidth
at the two –3 dB points:
Q +
f
m
(f
2
* f
1
)
For low-pass and high-pass filters, Q represents the pole quality and is defined as:
Q +
b
i
Ǹ
a
i
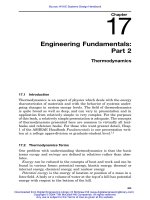
High Qs can be graphically presented as the distance between the 0-dB line and the peak
point of the filter’s gain response. An example is given in Figure 16–10, which shows a
tenth-order Tschebyscheff low-pass filter and its five partial filters with their individual Qs.
Fundamentals of Low-Pass Filters
16-10
10
0
–10
–30
0.01 0.1 1 10
30
20
–20
Frequency — Ω
1st Stage
2nd Stage
3rd Stage
4th Stage
5th Stage
Overall Filter
Q
5
40
|A| — Gain — dB
Figure 16–10. Graphical Presentation of Quality Factor Q on a Tenth-Order
Tschebyscheff Low-Pass Filter with 3-dB Passband Ripple
The gain response of the fifth filter stage peaks at 31 dB, which is the logarithmic value
of Q
5
:
Q
5
[dB] + 20·logQ
5
Solving for the numerical value of Q5 yields:
Q
5
+ 10
31
20
+ 35.48
which is within 1% of the theoretical value of Q = 35.85 given in Section 16.9, Table 16–9,
last row.
The graphical approximation is good for Q > 3. For lower Qs, the graphical values differ
from the theoretical value significantly. However, only higher Qs are of concern, since the
higher the Q is, the more a filter inclines to instability.
16.2.5 Summary
The general transfer function of a low-pass filter is :
(16–1)
A(s) +
A
0
P
i
ǒ
1 ) a
i
s ) b
i
s
2
Ǔ
The filter coefficients a
i
and b
i
distinguish between Butterworth, Tschebyscheff, and Bes-
sel filters. The coefficients for all three types of filters are tabulated down to the tenth order
in Section 16.9, Tables 16–4 through 16–10.
Low-Pass Filter Design
16-11Active Filter Design Techniques
The multiplication of the denominator terms with each other yields an n
th
order polynomial
of S, with n being the filter order.
While n determines the gain rolloff above f
C
with
* n·20 dBńdecade
, a
i
and b
i
determine
the gain behavior in the passband.
In addition, the ratio
b
i
Ǹ
a
i
+ Q
is defined as the pole quality. The higher the Q value, the
more a filter inclines to instability.
16.3 Low-Pass Filter Design
Equation 16–1 represents a cascade of second-order low-pass filters. The transfer func-
tion of a single stage is:
(16–2)
A
i
(s) +
A
0
ǒ
1 ) a
i
s ) b
i
s
2
Ǔ
For a first-order filter, the coefficient b is always zero (b
1
=0), thus yielding:
(16–3)
A(s) +
A
0
1 ) a
1
s
The first-order and second-order filter stages are the building blocks for higher-order fil-
ters.
Often the filters operate at unity gain (A
0
=1) to lessen the stringent demands on the op
amp’s open-loop gain.
Figure 16–11 shows the cascading of filter stages up to the sixth order. A filter with an even
order number consists of second-order stages only, while filters with an odd order number
include an additional first-order stage at the beginning.
Low-Pass Filter Design
16-12
2nd order
a
2
, b
2
2nd order
a
2
, b
2
2nd order
a
2
, b
2
2nd order
a
2
, b
2
2nd order
a
3
, b
3
2nd order
a
3
, b
3
1st order
a=1
2nd order
a
1
, b
1
1st order
a
1
2nd order
a
1
, b
1
2nd order
a
1
, b
1
1st order
2nd order
3rd order
4th order
5th order
6th order
1st order
a
1
Figure 16–11. Cascading Filter Stages for Higher-Order Filters
Figure 16–10 demonstrated that the higher the corner frequency of a partial filter, the high-
er its Q. Therefore, to avoid the saturation of the individual stages, the filters need to be
placed in the order of rising Q values. The Q values for each filter order are listed (in rising
order) in Section 16–9, Tables 16–4 through 16–10.
16.3.1 First-Order Low-Pass Filter
Figures 16–12 and 16–13 show a first-order low-pass filter in the inverting and in the non-
inverting configuration.
R
1
R
2
R
3
C
1
V
IN
V
OUT
Figure 16–12. First-Order Noninverting Low-Pass Filter
Low-Pass Filter Design
16-13Active Filter Design Techniques
R
1
R
2
C
1
V
IN
V
OUT
Figure 16–13. First-Order Inverting Low-Pass Filter
The transfer functions of the circuits are:
A(s) +
1 )
R
2
R
3
1 ) w
c
R
1
C
1
s
A(s) +
*
R
2
R
1
1 ) w
c
R
2
C
1
s
and
The negative sign indicates that the inverting amplifier generates a 180°
phase shift from
the filter input to the output.
The coefficient comparison between the two transfer functions and Equation 16–3 yields:
A
0
+ 1 )
R
2
R
3
A
0
+*
R
2
R
1
and
a
1
+ w
c
R
1
C
1
a
1
+ w
c
R
2
C
1
and
To dimension the circuit, specify the corner frequency (f
C
), the dc gain (A
0
), and capacitor
C
1
, and then solve for resistors R
1
and R
2
:
R
1
+
a
1
2pf
c
C
1
R
2
+
a
1
2pf
c
C
1
and
R
2
+ R
3
ǒ
A
0
* 1
Ǔ
R
1
+*
R
2
A
0
and
The coefficient a
1
is taken from one of the coefficient tables, Tables 16–4 through 16–10
in Section 16.9.
Note, that all filter types are identical in their first order and a
1
= 1. For higher filter orders,
however, a
1
≠1 because the corner frequency of the first-order stage is different from the
corner frequency of the overall filter.
Low-Pass Filter Design
16-14
Example 16–1. First-Order Unity-Gain Low-Pass Filter
For a first-order unity-gain low-pass filter with f
C
= 1 kHz and C
1
= 47 nF, R
1
calculates
to:
R
1
+
a
1
2pf
c
C
1
+
1
2p·10
3
Hz·47·10
*9
F
+ 3.38 kW
However, to design the first stage of a third-order unity-gain Bessel low-pass filter, assum-
ing the same values for f
C
and C
1
, requires a different value for R
1
. In this case, obtain
a
1
for a third-order Bessel filter from Table 16–4 in Section 16.9 (Bessel coefficients) to
calculate R
1
:
R
1
+
a
1
2pf
c
C
1
+
0.756
2p·10
3
Hz·47·10
*9
F
+ 2.56 kW
When operating at unity gain, the noninverting amplifier reduces to a voltage follower (Fig-
ure 16–14), thus inherently providing a superior gain accuracy. In the case of the inverting
amplifier, the accuracy of the unity gain depends on the tolerance of the two resistors, R
1
and R
2
.
R
1
C
1
V
IN
V
OUT
Figure 16–14. First-Order Noninverting Low-Pass Filter with Unity Gain
16.3.2 Second-Order Low-Pass Filter
There are two topologies for a second-order low-pass filter, the Sallen-Key and the Multi-
ple Feedback (MFB) topology.
16.3.2.1 Sallen-Key Topology
The general Sallen-Key topology in Figure 16–15 allows for separate gain setting via
A
0
= 1+R
4
/R
3
. However, the unity-gain topology in Figure 16–16 is usually applied in filter
designs with high gain accuracy, unity gain, and low Qs (Q < 3).
Low-Pass Filter Design
16-15Active Filter Design Techniques
V
IN
V
OUT
R
1
R
2
C
1
C
2
R
3
R
4
Figure 16–15. General Sallen-Key Low-Pass Filter
V
IN
V
OUT
R
1
R
2
C
1
C
2
Figure 16–16. Unity-Gain Sallen-Key Low-Pass Filter
The transfer function of the circuit in Figure 16–15 is:
A(s) +
A
0
1 ) w
c
ƪ
C
1
ǒ
R
1
) R
2
Ǔ
)
ǒ
1 * A
0
Ǔ
R
1
C
2
ƫ
s ) w
c
2
R
1
R
2
C
1
C
2
s
2
For the unity-gain circuit in Figure 16–16 (A
0
=1), the transfer function simplifies to:
A(s) +
1
1 ) w
c
C
1
ǒ
R
1
) R
2
Ǔ
s ) w
c
2
R
1
R
2
C
1
C
2
s
2
The coefficient comparison between this transfer function and Equation 16–2 yields:
A
0
+ 1
a
1
+ w
c
C
1
ǒ
R
1
) R
2
Ǔ
b
1
+ w
c
2
R
1
R
2
C
1
C
2
Given C
1
and C
2
, the resistor values for R
1
and R
2
are calculated through:
R
1,2
+
a
1
C
2
# a
1
2
C
2
2
* 4b
1
C
1
C
2
Ǹ
4pf
c
C
1
C
2
Low-Pass Filter Design
16-16
In order to obtain real values under the square root, C
2
must satisfy the following condi-
tion:
C
2
w C
1
4b
1
a
1
2
Example 16–2. Second-Order Unity-Gain Tschebyscheff Low-Pass Filter
The task is to design a second-order unity-gain Tschebyscheff low-pass filter with a corner
frequency of f
C
= 3 kHz and a 3-dB passband ripple.
From Table 16–9 (the Tschebyscheff coefficients for 3-dB ripple), obtain the coefficients
a
1
and b
1
for a second-order filter with a
1
= 1.0650 and b
1
= 1.9305.
Specifying C
1
as 22 nF yields in a C
2
of:
C
2
w C
1
4b
1
a
1
2
+ 22·10
*9
nF ·
4 ·1.9305
1.065
2
^ 150 nF
Inserting a
1
and b
1
into the resistor equation for R
1,2
results in:
R
1
+
1.065·150·10
*9
*
ǒ
1.065·150·10
*9
Ǔ
2
* 4·1.9305·22·10
*9
·150·10
*9
Ǹ
4p·3·10
3
·22·10
*9
·150·10
*9
+ 1.26 kW
and
R
2
+
1.065·150·10
*9
)
ǒ
1.065·150·10
*9
Ǔ
2
* 4·1.9305·22·10
*9
·150·10
*9
Ǹ
4p·3·10
3
·22·10
*9
·150·10
*9
+ 1.30 kW
with the final circuit shown in Figure 16–17.
V
IN
V
OUT
1.26k 1.30k
22n
150n
Figure 16–17. Second-Order Unity-Gain Tschebyscheff Low-Pass with 3-dB Ripple
A special case of the general Sallen-Key topology is the application of equal resistor val-
ues and equal capacitor values: R
1
= R
2
= R and C
1
= C
2
= C.
Low-Pass Filter Design
16-17Active Filter Design Techniques
The general transfer function changes to:
A(s) +
A
0
1 ) w
c
RC
ǒ
3 * A
0
Ǔ
s ) (w
c
RC)
2
s
2
A
0
+ 1 )
R
4
R
3
with
The coefficient comparison with Equation 16–2 yields:
a
1
+ w
c
RC
ǒ
3 * A
0
Ǔ
b
1
+
ǒ
w
c
RC
Ǔ
2
Given C and solving for R and A
0
results in:
R +
b
1
Ǹ
2pf
c
C
A
0
+ 3 *
a
1
b
1
Ǹ
+ 3 *
1
Q
and
Thus, A
0
depends solely on the pole quality Q and vice versa; Q, and with it the filter type,
is determined by the gain setting of A
0
:
Q +
1
3 * A
0
The circuit in Figure 16–18 allows the filter type to be changed through the various resistor
ratios R
4
/R
3
.
V
IN
V
OUT
RR
C
C
R
3
R
4
Figure 16–18. Adjustable Second-Order Low-Pass Filter
Table 16–1 lists the coefficients of a second-order filter for each filter type and gives the
resistor ratios that adjust the Q.
Table 16–1. Second-Order FIlter Coefficients
SECOND-ORDER BESSEL BUTTERWORTH 3-dB TSCHEBYSCHEFF
a
1
1.3617 1.4142 1.065
b
1
0.618 1 1.9305
Q 0.58 0.71 1.3
R
4
/R
3
0.268 0.568 0.234
Low-Pass Filter Design
16-18
16.3.2.2 Multiple Feedback Topology
The MFB topology is commonly used in filters that have high Qs and require a high gain.
V
IN
V
OUT
R
1
R
2
R
3
C
2
C
1
Figure 16–19. Second-Order MFB Low-Pass Filter
The transfer function of the circuit in Figure 16–19 is:
A(s) +*
R
2
R
1
1 ) w
c
C
1
ǒ
R
2
) R
3
)
R
2
R
3
R
1
Ǔ
s ) w
c
2
C
1
C
2
R
2
R
3
s
2
Through coefficient comparison with Equation 16–2 one obtains the relation:
A
0
+*
R
2
R
1
a
1
+ w
c
C
1
ǒ
R
2
) R
3
)
R
2
R
3
R
1
Ǔ
b
1
+ w
c
2
C
1
C
2
R
2
R
3
Given C
1
and C
2
, and solving for the resistors R
1
–R
3
:
R
2
+
a
1
C
2
* a
1
2
C
2
2
* 4b
1
C
1
C
2
ǒ
1 * A
0
Ǔ
Ǹ
4pf
c
C
1
C
2
R
1
+
R
2
* A
0
R
3
+
b
1
4p
2
f
c
2
C
1
C
2
R
2
Low-Pass Filter Design
16-19Active Filter Design Techniques
In order to obtain real values for R
2
, C
2
must satisfy the following condition:
C
2
w C
1
4b
1
ǒ
1 * A
0
Ǔ
a
1
2
16.3.3 Higher-Order Low-Pass Filters
Higher-order low-pass filters are required to sharpen a desired filter characteristic. For
that purpose, first-order and second-order filter stages are connected in series, so that
the product of the individual frequency responses results in the optimized frequency re-
sponse of the overall filter.
In order to simplify the design of the partial filters, the coefficients a
i
and b
i
for each filter
type are listed in the coefficient tables (Tables 16–4 through 16–10 in Section 16.9), with
each table providing sets of coefficients for the first 10 filter orders.
Example 16–3. Fifth-Order Filter
The task is to design a fifth-order unity-gain Butterworth low-pass filter with the corner fre-
quency f
C
= 50 kHz.
First the coefficients for a fifth-order Butterworth filter are obtained from Table 16–5, Sec-
tion 16.9:
a
i
b
i
Filter 1 a
1
= 1 b
1
= 0
Filter 2 a
2
= 1.6180 b
2
= 1
Filter 3 a
3
= 0.6180 b
3
= 1
Then dimension each partial filter by specifying the capacitor values and calculating the
required resistor values.
First Filter
R
1
C
1
V
IN
V
OUT
Figure 16–20. First-Order Unity-Gain Low-Pass
With C
1
= 1nF,
R
1
+
a
1
2pf
c
C
1
+
1
2p·50·10
3
Hz·1·10
*9
F
+ 3.18 kW
The closest 1% value is 3.16 kΩ.
Low-Pass Filter Design
16-20
Second Filter
V
IN
V
OUT
R
1
R
2
C
1
C
2
Figure 16–21. Second-Order Unity-Gain Sallen-Key Low-Pass Filter
With C
1
= 820 pF,
C
2
w C
1
4b
2
a
2
2
+ 820·10
*12
F·
4·1
1.618
2
+ 1.26 nF
The closest 5% value is 1.5 nF.
With C
1
= 820 pF and C
2
= 1.5 nF, calculate the values for R1 and R2 through:
R
1
+
a
2
C
2
* a
2
2
C
2
2
* 4b
2
C
1
C
2
Ǹ
4pf
c
C
1
C
2
R
1
+
a
2
C
2
) a
2
2
C
2
2
* 4b
2
C
1
C
2
Ǹ
4pf
c
C
1
C
2
and
and obtain
R
1
+
1.618·1.5·10
*9
*
ǒ
1.618·1.5·10
*9
Ǔ
2
* 4·1·820·10
*12
·1.5·10
*9
Ǹ
4p·50·10
3
·820·10
*12
·1.5·10
*9
+ 1.87 kW
R
2
+
1.618·1.5·10
*9
)
ǒ
1.618·1.5·10
*9
Ǔ
2
* 4·1·820·10
*12
·1.5·10
*9
Ǹ
4p·50·10
3
·820·10
*12
·1.5·10
*9
+ 4.42 kW
R
1
and R
2
are available 1% resistors.
Third Filter
The calculation of the third filter is identical to the calculation of the second filter, except
that a
2
and b
2
are replaced by a
3
and b
3
, thus resulting in different capacitor and resistor
values.
Specify C
1
as 330 pF, and obtain C
2
with:
C
2
w C
1
4b
3
a
3
2
+ 330·10
*12
F·
4·1
0.618
2
+ 3.46 nF
The closest 10% value is 4.7 nF.
High-Pass Filter Design
16-21Active Filter Design Techniques
With C
1
= 330 pF and C
2
= 4.7 nF, the values for R1 and R2 are:
D R
1
= 1.45 kΩ, with the closest 1% value being 1.47 kΩ
D R
2
= 4.51 kΩ, with the closest 1% value being 4.53 kΩ
Figure 16–22 shows the final filter circuit with its partial filter stages.
V
IN
1.87k 4.42k
820p
1.5n
1.47k 4.53k
330p
4.7n
V
OUT
1n
3.16k
Figure 16–22. Fifth-Order Unity-Gain Butterworth Low-Pass Filter
16.4 High-Pass Filter Design
By replacing the resistors of a low-pass filter with capacitors, and its capacitors with resis-
tors, a high-pass filter is created.
V
IN
V
OUT
R
1
R
2
C
1
C
2
V
IN
V
OUT
R
1
R
2
C
1
C
2
Figure 16–23. Low-Pass to High-Pass Transition Through Components Exchange
To plot the gain response of a high-pass filter, mirror the gain response of a low-pass filter
at the corner frequency, Ω=1, thus replacing Ω with 1/Ω and S with 1/S in Equation 16–1.
High-Pass Filter Design
16-22
10
0
–10
–30
0.1 1 10
–20
Frequency — Ω
A
0
A
∞
Lowpass Highpass
|A| — Gain — dB
Figure 16–24. Developing The Gain Response of a High-Pass Filter
The general transfer function of a high-pass filter is then:
(16–4)
A(s) +
A
R
P
i
ǒ
1 )
a
i
s
)
b
i
s
2
Ǔ
with A
∞
being the passband gain.
Since Equation 16–4 represents a cascade of second-order high-pass filters, the transfer
function of a single stage is:
(16–5)
A
i
(s) +
A
R
ǒ
1 )
a
i
s
)
b
i
s
2
Ǔ
With b=0 for all first-order filters, the transfer function of a first-order filter simplifies to:
(16–6)
A(s) +
A
0
1 )
a
i
s
High-Pass Filter Design
16-23Active Filter Design Techniques
16.4.1 First-Order High-Pass Filter
Figure 16–25 and 16–26 show a first-order high-pass filter in the noninverting and the in-
verting configuration.
R
1
R
2
R
3
C
1
V
IN
V
OUT
Figure 16–25. First-Order Noninverting High-Pass Filter
R
1
R
2
C
1
V
IN
V
OUT
Figure 16–26. First-Order Inverting High-Pass Filter
The transfer functions of the circuits are:
A(s) +
1 )
R
2
R
3
1 )
1
w
c
R
1
C
1
·
1
s
A(s) +*
R
2
R
1
1 )
1
w
c
R
1
C
1
·
1
s
and
The negative sign indicates that the inverting amplifier generates a 180°
phase shift from
the filter input to the output.
The coefficient comparison between the two transfer functions and Equation 16–6 pro-
vides two different passband gain factors:
A
R
+ 1 )
R
2
R
3
A
R
+*
R
2
R
1
and
while the term for the coefficient a
1
is the same for both circuits:
a
1
+
1
w
c
R
1
C
1
High-Pass Filter Design
16-24
To dimension the circuit, specify the corner frequency (f
C
), the dc gain (A
∞
), and capacitor
(C
1
), and then solve for R
1
and R
2
:
R
1
+
1
2pf
c
a
1
C
1
R
2
+ R
3
(
A
R
* 1
)
R
2
+*R
1
A
R
and
16.4.2 Second-Order High-Pass Filter
High-pass filters use the same two topologies as the low-pass filters: Sallen-Key and Mul-
tiple Feedback. The only difference is that the positions of the resistors and the capacitors
have changed.
16.4.2.1 Sallen-Key Topology
The general Sallen-Key topology in Figure 16–27 allows for separate gain setting via
A
0
= 1+R
4
/R
3
.
R
3
R
4
V
IN
V
OUT
R
1
R
2
C
1
C
2
Figure 16–27. General Sallen-Key High-Pass Filter
The transfer function of the circuit in Figure 16–27 is:
A(s) +
a
1 )
R
2
ǒ
C
1
)C
2
Ǔ
)R
1
C
2
(
1*a
)
w
c
R
1
R
2
C
1
C
2
·
1
s
)
1
w
c
2
R
1
R
2
C
1
C
2
·
1
s
2
a + 1 )
R
4
R
3
with
The unity-gain topology in Figure 16–28 is usually applied in low-Q filters with high gain
accuracy.
V
IN
V
OUT
R
1
R
2
CC
Figure 16–28. Unity-Gain Sallen-Key High-Pass Filter