Tài liệu Mạng lưới giao thông và đánh giá hiệu suất P17 ppt
Bạn đang xem bản rút gọn của tài liệu. Xem và tải ngay bản đầy đủ của tài liệu tại đây (216.14 KB, 25 trang )
17
NETWORK DESIGN AND CONTROL
USING ON=OFF AND MULTILEVEL
SOURCE TRAFFIC MODELS WITH
HEAVY-TAILED DISTRIBUTIONS
N. G. DUFFIELD AND W. W HITT
AT&T Labs±Research, Florham Park, NJ 07392
17.1 INTRODUCTION
In order to help design and control the emerging high-speed communication
networks, we want source traf®c models (also called offered load models or
bandwidth demand models) that can be both realistically ®t to data and successfully
analyzed. Many recent traf®c measurements have shown that network traf®c is quite
complex, exhibiting phenomena such as heavy-tailed probability distributions, long-
range dependence, and self similarity; for example, see Ca
Â
ceres et al. [7], Leland
et al. [23], Paxson and Floyd [24], and Crovella and Bestavros [10].
In fact, the heavy-tailed distributions may be the cause of all these phenomena,
because they tend to cause long-range dependence and (asymptotic) self-similarity.
For example, the input and buffer content processes associated with an on=off source
exhibit long-range dependence when the on and off times have heavy-tailed
probability distributions; for example, see Section 17.9. Heavy-tailed distributions
are known to cause self-similarity in models of (asymptotically) aggregated traf®c;
see Willinger et al. [27].
In this chapter we propose a way to analyze the performance of a network with
multiple on= off sources and more general multilevel sources in which the on-time,
off-time, and level-holding-time distributions are allowed to have heavy tails. To do
Self-Similar Network Traf®c and Performance Evaluation, Edited by Kihong Park and Walter Willinger
ISBN 0-471-31974-0 Copyright # 2000 by John Wiley & Sons, Inc.
421
Self-Similar Network Traf®c and Performance Evaluation, Edited by Kihong Park and Walter Willinger
Copyright # 2000 by John Wiley & Sons, Inc.
Print ISBN 0-471-31974-0 Electronic ISBN 0-471-20644-X
so we must go be beyond the familiar Markovian analysis. To achieve the required
analyzability with this added model complexity, we propose a simpli®ed kind of
analysis. In particular, we avoid the customary queueing detail (and its focus on
buffer content and over¯ow) and instead concentrate on the instantaneous offered
load. We describe the probability that aggregate demand (the input rate from a
collection of sources) exceeds capacity (the maximum possible output rate) at any
time. Focusing on the probability that aggregate demand exceeds capacity is
tantamount to considering a bufferless model, which we believe is often justi®ed.
By also considering the probability that aggregate demand exceeds other levels, we
provide a quite ¯exible performance characterization. This approach also can
generate approximations describing loss and delay with ®nite capacity; for example,
see Duf®eld and Whitt [14], Section 5. To a large extent, the present chapter is a
review of our recent work [14, 15], to which we refer the reader for additional
discussion. In Duf®eld et al. [16] the model is extended to include a nonhomoge-
neous Poisson connection arrival process. Then each active connection may generate
traf®c according to one of the source traf®c models presented here. It is signi®cant
that we are able to obtain useful descriptions of the offered load in the nonstationary
context.
17.2 A GENERAL SOURCE MODEL
Motivation for considering on=off and multilevel models as source models comes
from traces of frame sizes generated by certain video encoders; for example, see
Grasse et al. [19]. Shifts between levels in mean frame size appear to arise from
scene changes in the video, with the distribution of scene durations heavy-tailed.
Indeed, the expectation that scene durations will have heavy-tailed distributions is
one of the motivations behind the renegotiated constant bit rate (RCBR) proposal of
Grossglauser et al. [20].
Our approach is interesting for on=off and multilevel source models, but with
little extra effort we can treat a wider class. The general model we consider has two
components. The bandwidth demand for each source as a function of time,
fBt: t ! 0g, is represented as the sum of two stochastic processes: (1) a macro-
scopic (longer-time-scale) level process fLt: t ! 0g and (2) a microscopic (shorter-
time-scale) within-level variation process fW t: t ! 0g, that is,
BtLtW t; t ! 0: 17:1
We let the macroscopic level process fLt: t ! 0g be a semi-Markov process (SMP)
as in CË inlar [9, Chap. 10]; that is, the level process is constant except for jumps, with
the jump transitions governed by a Markov process, while the level holding times
(times between jumps) are allowed to have general distributions depending on the
originating level and the next level. Given a transition from level j to level k, the
holding time in level j has cumulative distribution function (cdf) F
jk
. Conditional on
the sequence of successive levels, the holding times are mutually independent. To
422 NETWORK DESIGN USING HEAVY-TAILED DISTRIBUTIONS
obtain models compatible with traf®c measurements cited earlier, we allow the
holding-time cdf 's F
jk
to have heavy tails.
We assume that the within-level variation process fW t: t ! 0g is a zero-mean
piecewise-stationary process. During each holding-time interval in a level, the
within-level variation process is an independent segment of a zero-mean stationary
process, with the distribution of each segment being allowed to depend on the level.
We allow the distribution of the stationary process segment to depend on the level,
because it is natural for the variation about any level to vary from level to level.
We will require only a limited characterization of the within-level variation
process; it turns out that the ®ne structure of the within-level variation process plays
no role in our analysis. Indeed, that is one of our main conclusions. In several
examples of processes that we envisage modeling by these methods, there will only
be the level process. First, the level process may be some smoothed functional of a
raw bandwidth process. This is the case with algorithms for smoothing stored video
by converting into piecewise constant rate segments in some optimal manner subject
to buffering and delay constraints; see Salehi et al. [25]. With such smoothing, the
input rate will directly be a level process as we have de®ned it. Alternatively, the
level process may stem from rate reservation over the period between level-shifts,
rather than the bandwidth actually used. This would be the case for RCBR
previously mentioned. In this situation we act as if the reservation level is the
actual demand, and thus again have a level process.
A key to being able to analyze the system with such complex sources represented
by our traf®c model is exploiting asymptotics associated with multiplexing a large
number of sources. The ever-increasing network bandwidth implies that more and
more sources will be able to be multiplexed. This gain is generally possible, even in
the presence of heavy-tailed distributions and more general long-range dependence;
for example, see Duf®eld [12, 13] for demonstration of the multiplexing gains
available for long-range dependent traf®c in shared buffers. As the scale increases,
describing the detailed behavior of all sources become prohibitively dif®cult, but
fortunately it becomes easier to describe the aggregate, because the large numbers
produce statistical regularity. As the size increases, the aggregate demand can be
well described by laws of large numbers, central limit theorems, and large deviation
principles.
We have in mind two problems: ®rst, we want to do capacity planning and,
second, we want to do real-time connection-admission control and congestion
control. In both cases, we want to determine whether any candidate capacity is
adequate to meet the aggregate demand associated with a set of sources. In both
cases, we represent the aggregate demand simply as the sum of the bandwidth
requirements of all sources. In forming this sum, we regard the bandwidth processes
of the different sources as probabilistically independent.
The performance analysis for capacity planning is coarser, involving a longer
time scale, so that it may be appropriate to do a steady-state analysis. However, when
we consider connection-admission control and congestion control, we suggest
focusing on a shorter time scale. We are still concerned with the relatively long
time scale of connections, or scene times in video, instead of the shorter time scales
17.2 A GENERAL SOURCE MODEL 423
of cells or bursts, but admission control and congestion control are suf®ciently short-
term that we propose focusing on the transient behavior of the aggregate demand
process. In fact, even for capacity planning the transient analysis plays an important
role. The transient analysis determines how long it takes to recover from rare
congestion events. One application we have in mind is that of networks carrying
rate-adaptive traf®c. In this case the bandwidth process could represent the ideal
demand of a source, even though it is able to function when allocated somewhat less
bandwidth. So from the point of view of quality, excursion of aggregate bandwidth
demand above available supply may be acceptable in the short-term, but one would
want to dimension the link so that such excursions are suf®ciently short-lived. In this
or other contexts, if the recovery time from overload is relatively long, then we may
elect to provide extra capacity (or reduce demand) so that overload becomes less
likely. However, we do not focus speci®cally on actual design and control here; see
Duf®eld and Whitt [14] for some speci®c examples. Our main contribution here is to
show how the transient analysis for design and control can be done.
The remainder of this chapter is devoted to showing how to do transient analysis
with the source traf®c model. We suggest focusing on the future time-dependent
mean conditional on the present state. The present state of each level process
consists of the level and age (elapsed holding time in that level). Because of the
anticipated large number of sources, the actual bandwidth process should be closely
approximated by its mean, by the law of large numbers (LLN). As in Duf®eld and
Whitt [14], the conditional mean can be thought of as a deterministic ¯uid
approximation; for example, see Chen and Mandelbaum [8]. Since the within-
level variation process has mean zero, the within-level variation process has no effect
on this conditional mean. Hence, the conditional mean of the aggregate bandwidth
process is just the sum of the conditional means of the component level processes.
Unlike the more elementary M =G=I model considered in Duf®eld and Whitt [14],
however, the conditional mean here is not available in closed form.
In order to rapidly compute the time-dependent conditional mean aggregate
demand, we exploit numerical inversion of Laplace transforms. It follows quite
directly from the classical theory of semi-Markov process that explicit expressions
can be given for the Laplace transform of the conditional mean. More recently, it has
been shown that numerical inversion can be an effective algorithm; see Abate et al.
[1].
For related discussions of transient analysis, design and control, see Chapters 13,
16, and 18 in this volume.
17.3 OUTLINE OF THE CHAPTER
The rest of this chapter is organized as follows. In Section 17.4, we show that the
Laplace transform of the mean of the transient conditional aggregate demand can be
expressed concisely. This is the main enabling result for the remainder of the chapter.
The conditional mean itself can be very ef®ciently computed by numerically
inverting its Laplace transform. To carry out the inversion, we use the Fourier-
424 NETWORK DESIGN USING HEAVY-TAILED DISTRIBUTIONS
series method in Abate and Whitt [2] (the algorithm Euler exploiting Euler
summation), although alternative methods could be used. The inversion algorithm
is remarkably fast; computation for each time point corresponds simply to a sum of
50 terms. We provide numerical examples in Examples 17.6.2 and 17.8.1. Example
17.8.1 is of special interest, because the level-holding-time distribution there is
Pareto.
In Section 17.5 we show that in some cases we can avoid the inversion entirely
and treat much larger models. We can avoid the inversion if we can assume that the
level holding times are relatively long compared to the times of interest for control.
Then we can apply a single-transition approximation, which amounts to assuming
that the Markov chain is absorbing after one transition. Then the conditional mean is
directly expressible in terms of the level-holding-time distributions. Alternatively, we
can perform a two-transition approximation, which only involves one-dimensional
convolution integrals.
In Section 17.6 we describe the value of having more detailed state information,
speci®cally the current ages of levels. With heavy-tailed distributions, a large elapsed
holding time means that a large remaining holding time is very likely; for examples
see Duf®eld and Whitt [14, Section 8] for background, and Harchol-Balter and
Downey [21] for an application in another setting.
In Section 17.7 we turn to applications to capacity planning. The idea is to
approximate the probability of an excursion in demand using Chernoff bounds and
other large deviation approximations, then chart its recovery to a target acceptable
level using the results on transience. Interestingly, the time to recover from
excursions suf®ciently close to the target level depends on the level durations
essentially only through their mean. Correspondingly, the conditional mean demand
relaxes linearly from its excursion, at least approximately so, for suf®ciently small
times. If the chance for a larger excursion is negligible (as determined by the large
deviation approximation mentioned) then this simple description may suf®ce. An
example is given in Section 17.8.
In Section 17.9 we show how long-range dependence in the level process arises
through heavy-tailed level-holding-time distributions. Finally, we draw conclusions
in Section 17.10.
17.4 TRANSIENT ANALYSIS
17.4.1 Approximation by the Conditional Mean Bandwidth
Throughout this chapter, the state information on which we condition will be either
the current level of each source or the current level and age (current time) in that
level of each source. No state from the within-level variation process is assumed.
Conditional on that state information, we can compute the probability that each
source will be in each possible level at any time in the future, from which we can
calculate the conditional mean and variance of the aggregate required bandwidth by
adding.
17.4 TRANSIENT ANALYSIS 425
The Lindberg±Feller central limit theorem (CLT) for non-identically-distributed
summands can be applied to generate a normal approximation characterized by the
conditional mean and conditional variance; see Feller [18, p. 262]. For the normal
approximation to be appropriate, we should check that the aggregate is not
dominated by only a few sources.
Let Bt denote the (random) aggregate required bandwidth at time t, and let I 0
denote the (known deterministic) state information at time 0. Let BtjI 0
represent a random variable with the conditional distribution of Bt given the
information I0. By the CLT, the normalized random variable
BtjI0À EBtjI0
VarBtjI0
p
17:2
is approximately normally distributed with mean 0 and variance 1 when the number
of sources is suitably large.
Since the conditional mean alone tends to be very descriptive, we use the
approximation
BtjI0 % EBtjI0; 17:3
which can be justi®ed by a (weaker) law of large numbers instead of the CLT. We
will show that the conditional mean in Eq. (17.3) can be ef®ciently computed, so that
it can be used for real-time control. From Eq. (17.2), we see that the error in the
approximation (17.3) is approximately characterized by the conditional standard
deviation
VarBtjI0
p
. We also will show how to compute this conditional
standard deviation, although the required computation is more dif®cult. If there are n
sources that have roughly equal rates, then the conditional standard deviation will be
O
n
p
, while the conditional mean is On.
Given that our approximation is the conditional mean, and given that our state
information does not include the state of the within-level variation process, the
within-level variation process plays no role because it has zero mean. Let i index the
source. Since the required bandwidths need not have integer values, we index the
level by the integer j; 1 j J
i
, and indicate the associated required bandwidths in
the level by b
i
j
. Hence, instead of Eq. (17.1), the required bandwidth for source i can
be expressed as
B
i
tb
i
L
i
t
W
L
i
t
t; t ! 0: 17:4
Let P
i
jk
tjx be the probability that the source-i level process is in level k at time t
given that time 0 it was in level j and had been so for a period x (i.e., the age or
elapsed level holding time at time 0 is x). If j j
1
; ; j
n
and x x
1
; ; x
n
are
the vectors of levels and ages of the n source level processes at time 0, then the state
426 NETWORK DESIGN USING HEAVY-TAILED DISTRIBUTIONS
information is I0j; xj
1
; ; j
n
; x
1
; ; x
n
and the conditional aggregate
mean is
EBtjI0 Mtjj; x
P
n
i1
P
J
i
k
i
1
P
i
j
i
k
i
tjx
i
b
i
k
i
: 17:5
From Eq. (17.5), we see that we need to compute the conditional distribution of
the level, that is, the probabilities P
i
jk
tjx, for each source i. However, we can ®nd
relatively simple expressions for the Laplace transform of P
i
jk
tjx with respect to
time because the level process of each source has been assumed to be a semi-Markov
process.
We now consider a single source and assume that its required bandwidth process
is a semi-Markov process (SMP). (We now have no within-level variation process.)
We now omit the superscript i. Let Lt and Bt be the level and required bandwidth,
respectively, at time t as in Eq. (17.4). The process fLt: t ! 0g is assumed to be an
SMP, while the process fBt: t ! 0g is a function of an SMP, that is Btb
Lt
,
where b
j
is the required bandwidth in level j.Ifb
j
T b
k
for j T k, then fBt: t ! 0g
itself is an SMP, but if b
j
b
k
for some j T k, then in general fBt: t ! 0g is not an
SMP.
17.4.2 Laplace Transform Analysis
Let At be the age of the level holding time at time t. We are interested in calculating
P
jk
tjxPLtkjL0j; A0x17:6
as a function of j; k; x, and t. The state information at time 0 is the pair j; x. Let P
be the transition matrix of the discrete-time Markov chain governing level transitions
and let F
jk
t be the holding-time cdf given that there is a transition from level j to
level k. For simplicity, we assume that F
c
jk
t1 À F
jk
t > 0 for all j; k, and t,so
that all positive x can be level holding times. Let Ptjx be the matrix with elements
P
jk
tjx and let
^
Psjx be the Laplace transform (LT) of Ptjx, that is, the matrix with
elements that are the Laplace transforms of P
jk
tjx with respect to time:
^
P
jk
sjx
I
0
e
Àst
P
jk
tjx dt: 17:7
We can obtain a convenient explicit expression for
^
Psjx. For this purpose, let G
j
be
the holding-time cdf in level j, unconditional on the next level, that is,
G
j
x
P
k
P
jk
F
jk
x: 17:8
17.4 TRANSIENT ANALYSIS 427
For any cdf G, let G
c
be the complementary cdf, that is, G
c
x1 À Gx. Also, let
H
jk
tjx
P
jk
F
jk
t x
G
c
j
x
and G
j
tjx
P
k
H
jk
tjx17:9
for G
j
in Eq. (17.8). Then let
^
h
jk
sjx and
^
g
j
sjx be the associated Laplace±Stieltjes
transforms (LSTs):
^
h
jk
sjx
I
0
e
Àst
dH
jk
tjx and
^
g
j
sjx
I
0
e
Àst
dG
j
tjx: 17:10
Let
^
hsjx be the matrix with elements
^
h
jk
sjx. Let
^
qs be the matrix with elements
^
q
jk
s, where
Q
jk
tP
jk
F
jk
t and
^
q
jk
s
I
0
e
Àst
dQ
jk
t: 17:11
Let
^
Dsjx and
^
Ds be the diagonal matrices with diagonal elements
^
D
jj
sjx1 À
^
g
j
sjx=s;
^
D
jj
s1 À
^
g
j
s=s; 17:12
where
^
g
j
s is the LST of the cdf G
j
in Eq. (17.8).
Theorem 17.4.1. The transient probabilities for a single SMP source have the
matrix of Laplace transforms
^
Psjx
^
Dsjx
^
hsjx
^
Psj0; 17:13
where
^
Psj0I À
^
qs
À1
^
Ds: 17:14
Proof. In the time domain, condition on the ®rst transition. For j T k,
P
jk
tjx
P
l
t
0
dH
jl
ujxP
lk
t À uj0;
so that
^
P
jk
sjx
P
l
^
h
jl
sjx
^
P
lk
sj0;
428 NETWORK DESIGN USING HEAVY-TAILED DISTRIBUTIONS
while
P
jj
tjxG
c
j
tjx
P
l
t
0
dH
jl
ujxP
lj
t À uj0;
so that
^
P
jj
sjx
1 À
^
g
j
sjx
s
P
l
h
jl
sjx
^
P
lj
sj0:
Hence, Eq. (17.13) holds. However, Ptj0 satis®es a Markov renewal equation, as in
CË inlar [9, Section 10.3]; that is, for j T k,
P
jk
tj0
P
l
t
0
dQ
jl
uP
lk
t À uj0;
and
P
jj
tj0G
c
j
t
P
l
I
0
dQ
jl
uP
lj
t Àuj0;
so that
Ptj0DtQtÃPtj0
where à denotes convolution, and Eq. (17.14) holds. j
To compute the LT
^
Psj0, we only need the LSTs
^
f
jk
s and
^
g
j
s associated with
the basic holding-time cdf 's F
jk
and G
j
. Abate and Whitt [3±5] give special attention
to heavy-tail probability densities whose Laplace transforms can be computed and,
thus, inverted. However, to compute
^
Psjx, we also need to compute
^
Dsjx and
^
hsjx, which require computing the LSTs of the conditional cdf's H
jk
tjx and
G
j
tjx in Eq. (17.9). In general, even if we know the LST of a cdf, we do not
necesssarily know the LST of an associated conditional cdf. However, in special
cases, the LSTs of conditional cdf 's are easy to obtain because the cdf 's inherit their
structure upon conditioning. For example, this is true for phase-type, hyperexpo-
nential and Pareto distributions; Duf®eld and Whitt [15, Section 4]. Moreover, other
cdf's can be approximated by hyperexponential or phase-type cdf's; see Asmussen et
al. [6] and Feldman and Whitt [17].
If the number of levels is not too large, then it will not be dif®cult to compute the
required matrix inverse I À qs
À1
for all required s. Note that, because of the
probability structure, the inverse is well de®ned for all complex s with Res > 0.
To illustrate with an important simple example, we next give the explicit formula
for an on=off source. Suppose that there are two states with transition probabilities
17.4 TRANSIENT ANALYSIS 429
P
12
P
21
1 and holding time cdf's G
1
and G
2
. From Eq. (17.9) or by direct
calculation,
^
Psj0
^
P
11
sj0
^
P
12
sj0
^
P
21
sj0
^
P
22
sj0
!
I À
^
qs
À1
^
Ds
1
s1 À
^
g
1
s
^
g
2
s
1 À
^
g
1
s
^
g
1
s1 À
^
g
2
s
^
g
2
s1 À
^
g
1
s 1 À
^
g
2
s
: 17:15
Suppose that the levels are labeled so that the initial level is 1. Note that all
transitions from level 1 are to level 2. Hence, when considering the matrix
^
hsjx in
Eq. (17.10), it suf®ces to consider only the element
^
h
12
sjx. Since
H
c
12
tjxG
c
1
tjx
G
c
1
t x
G
c
1
x
; 17:16
then
^
h
12
sjx
^
g
1
sjx
I
0
e
Àst
dG
1
tjx: 17:17
Since P
11
tjx1 À P
12
tjx, it suf®ces to calculate only P
12
tjx. Hence, in this
context
^
P
12
sjx
^
g
1
sjx1 À
^
g
2
s
s1 À
^
g
1
s
^
g
2
s
: 17:18
We now determine the mean, second moment, and variance of the bandwidth
process of a general multilevel source as a function of time, ignoring the within-level
variation process. It is elementary that
m
j
tjxEBtjL0j; A0x
P
k
P
jk
tjxb
k
; 17:19
s
j
tjxEBt
2
jL0j; A0x
P
k
P
jk
tjxb
2
k
; 17:20
v
j
tjxVarBtjL0j; A0xs
j
tjxÀm
j
tjx
2
: 17:21
We can calculate m
j
tjx and s
j
tjx by single inversions of their Laplace transforms,
using
^
m
j
sjx
I
0
e
Àst
m
j
tjx dt
P
k
P
jk
sjxb
k
430 NETWORK DESIGN USING HEAVY-TAILED DISTRIBUTIONS
and
^
s
j
sjx
P
k
^
P
jk
sjxb
2
k
: 17:22
To properly account for the within-level variation process when it is present, we
should add to its variance in level j,say,w
j
t; x,tov
j
t; x, but we need make no
change to the mean m
j
t; x. We anticipate that w
j
t; x will tend to be much less than
v
j
t; x so that w
j
t; x can be omitted, but it could be included.
Finally, we consider the aggregate bandwidth associated with n sources. Again let
a superscript i index the sources. The conditional aggregate mean and variance are
Mtjj; xEBtjI 0
P
n
i1
m
i
j
i
tjx
i
17:23
and
V tjj; xVarBtjI0
P
n
i1
v
i
j
i
tjx
i
w
i
j
i
tjx
i
; 17:24
where j j
1
; ; j
n
is the vector of levels and x x
1
; ; x
n
is the vector of
elapsed holding times for the n sources with the single-source means and variances
as in Eqs. (17.19) and (17.21).
It is signi®cant that we can calculate the conditional aggregate mean at any time t
by performing a single numerical inversion, for example, by using the Euler
algorithm in Abate and Whitt [2]. We summarize this elementary but important
consequence as a theorem.
Theorem 17.4.2. The Laplace transform of the n-source conditional mean
aggregate required bandwidth as a function of time is
^
Msjj; x
I
0
e
Àst
Mtjj; x dt
P
n
i1
P
J
i
k
i
1
^
P
i
J
i
k
i
sjx
i
b
k
i
; 17:25
where the single-source transform
^
P
i
j
i
k
i
sjx
i
is given in Theorem 17.4.1.
Unlike for the aggregate mean, for the aggregate variance we evidently need to
perform n separate inversions to calculate v
i
j
i
tjx
i
for each i and then add to calculate
V tjj; x in Eq. (17.24). (We assume that the within-level variances w
i
j
i
tjx
i
,if
included, are speci®ed directly.) Hence, we suggest calculating only the conditional
mean in real time to perform control, and occasionally calculating the conditional
variance to evaluate the accuracy of the conditional mean.
17.4 TRANSIENT ANALYSIS 431
17.5 APPROXIMATIONS USING FEW TRANSITIONS
The most complicated part of the conditional aggregate mean transform
^
Msjj; x in
Eq. (17.25) is the matrix inverse I À
^
qs
À1
in the transform of the single-source
transition probability in Eq. (17.14). Since the matrix inverse calculation can be a
computational burden when the number of levels is large, it is natural to seek
approximations that avoid this matrix inverse. We describe such approximations in
this section.
The matrix inverse I À qs
À1
is a compact representation for the series
P
I
n0
qs
n
.ForPtjx, it captures the possibility of any number of transitions up
to time t. However, if the holding times in the levels are relatively long in the time
scales relevant for control, then the mean for times t of interest will only be
signi®cantly affected by a very few transitions. Indeed, often only a single transition
need be considered.
The single-transition approximation is obtained by making the Markov chain
absorbing after one transition. Hence, the single-transition approximation is simply
P
jk
tjx%H
jk
tjx; j T k; and P
jj
tjx%G
c
j
tjxH
jj
tjx17:26
for H
jk
tjx in Eq. (17.9) and G
j
tjx in Eq. (17.9). From Eq. (17.26) we see that no
inversion is needed.
Alternatively, we can develop a two-transition approximation. (Extensions to
higher numbers are straightforward.) Modifying the proof of Theorem 17.4.1 in a
straightforward manner, we obtain
P
jk
tjx%
t
0
G
c
k
T À u dH
jk
ujx
P
l
t
0
P
lk
F
lk
t Àu dH
jl
ujx17:27
for j T k and
P
jj
tjx%G
c
j
tjx
P
l
t
0
P
lj
F
lj
t Àu dH
jl
ujx: 17:28
Expressed in the form of transforms, Eqs. (17.27) and (17.28) become
^
P
jk
sjx%
^
h
jk
sjx
1 À
^
g
k
s
s
P
l
^
h
jl
sjxP
lk
^
f
lk
s
s
17:29
for j T k and
^
P
jj
sjx%
1 À
^
g
j
sjx
s
P
l
^
h
jl
sjxP
lj
^
f
lj
s
s
: 17:30
432 NETWORK DESIGN USING HEAVY-TAILED DISTRIBUTIONS
Numerical inversion can easily be applied with Eqs. (17.29) and (17.30). However,
since the time-domain formulas (17.27) and (17.28) involve single convolution
integrals, numerical computation of Eqs. (17.27) and (17.28) in the time domain is
also a feasible alternative. Moreover, if the underlying distributions have special
structure, then the integrals in Eqs. (17.27) and (17.28) can be calculated analyti-
cally. For example, analytical integration can easily be done when all holding-time
distributions are hyperexponential. In Duf®eld and Whitt [15, Section 3] we give a
numerical example illustrating how the two approximations compare to the exact
conditional mean for a single source with four levels.
17.6 THE VALUE OF INFORMATION
We can use the source model to investigate the value of information. We can
consider how prediction is improved when we condition ®rst, on, only the level and,
second, on both level and age. The reference case is the steady-state mean
M
P
n
i1
m
i
and m
i
P
b
i
j
p
i
j
; 17:31
where p
i
j
is the steady-state probability, that is,
p
i
j
p
i
j
mG
i
j
P
k
p
i
k
mG
i
k
; 17:32
with p
i
the steady-state vector of the Markov chain P
i
p
i
p
i
P
i
and mG
i
j
the
mean of G
i
j
for G
j
in Eq. (17.8), for all sources i. With the steady-state mean, there is
no conditioning. Section 17.2 gives the formula for conditioning on both level and
age. Now we give the formulas conditioning only on the level; that is, we condition
on the level, assuming that we are in the steady state. We omit the i superscript. Then
the age in level j has the stationary-excess cdf
G
je
t
1
mG
j
t
0
G
c
j
u du; t ! 0: 17:33
Let P
jk
t be the probability of being in level k at time t conditional on being in
level j in the steady state at time 0. Let
^
P
jk
s be its Laplace transform. Let m
j
t be
the conditional steady-state mean given level j at time 0 and let
^
m
j
s be its Laplace
transform. Clearly,
m
j
t
P
J
k1
P
jk
tb
k
and
^
m
j
s
P
J
k1
^
P
jk
sb
k
: 17:34
Hence, it suf®ces to calculate
^
P
jk
s.
17.6 THE VALUE OF INFORMATION 433
Theorem 17.6.1. Assume that the level-holding-time cdf depends only on the
originating level, that is, F
jk
tG
j
t. The steady-state transition probabilities
conditional on the level for a single SMP source have the matrix of Laplace
transforms
^
Ps
^
D
e
s
^
g
e
s
^
Psj0; 17:35
where
^
Psj0 is the matrix in Eq. (17.14),
^
g
e
s is the matrix with elements
^
g
ejk
sP
jk
^
g
je
sP
jk
1 À
^
g
j
s
smG
j
; 17:36
^
D
e
s is the diagonal matrix with diagonal elements
^
D
ejj
s
1 À
^
g
je
s
s
smG
j
À1
^
g
j
s
s
2
mG
j
; 17:37
^
g
j
s is the level-j holding-time LST, and
^
g
je
s is the LST of its stationary-excess cdf
in Eq. (17.33).
Proof. Modify the proof of Theorem 17.4.1, inserting P
jl
G
je
t for H
jl
tjx and
G
c
je
t for G
c
j
tjx. j
Consider the on=off source in Section 17.4. Paralleling Eq. (17.18), it suf®ces to
calculate only P
12
t. Its Laplace transform is
^
P
12
s
^
g
1e
s1 À
^
g
2
s
s1 À
^
g
1
s
^
g
2
s
: 17:38
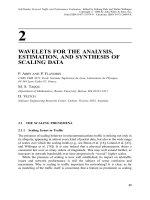
Example 17.6.2. To show the value of knowing the age, consider an on=off source
with holding-time complementary cdf's
G
c
1
t0:01e
À0:01t
0:1e
À0:1t
0:89e
Àt
; G
c
2
te
Àt
; t ! 0: 17:39
Let the bandwidths be b
1
100 and b
2
0. Since mG
1
2:89 and mG
2
1:00, the steady-state mean is
EBI
100mG
1
mG
1
mG
2
74:29:
Let the initial level be 1. Since G
1
has an exponential component with mean 100,
we anticipate the time to reach the steady state to be between 100 and 1000. In Fig.
17.1 we plot the conditional mean m
1
tjx for x 0:5, 5.0, and 50.0, computed by
434 NETWORK DESIGN USING HEAVY-TAILED DISTRIBUTIONS
numerical transform inversion. Figure 17.1 shows that the age plays a very important
role.
17.7 RECOVERY FROM CONGESTION IN THE STEADY STATE
For capacity planning, it is useful to consider the time required to recover from a
high-congestion event, as well as the likelihood of the high-congestion event. The
likelihood of a high-congestion event in the steady state can be estimated using a
large deviation principle (LDP) approximation. The well-known Chernoff bound
(e.g., see Dembo and Zeitouni [11]) gives an upper bound to the stationary tail
probabilities of the aggregate level process, even for ®nitely many sources.
By Chebychev's inequality, for all y > 0,
PLt!x e
Àyx
Ee
yLt
e
Àyx
Y
i
Ee
yL
i
t
e
Àyx
Y
i
P
j
p
i
j
e
yb
i
j
; 17:40
where b
i
j
is the required bandwidth and p
i
j
is the steady-state probability of level j in
source i, as in Eq. (17.32). Thus,
PLt!x e
ÀIx
; where I xsup
y>0
yx À
P
i
log
P
j
p
i
j
e
yb
i
j
!
: 17:41
It can be shown [11] that such bounds are asymptotically tight (have a large
deviation limit) as the number of sources increases, provided the spectrum of
110
120
100
90
80
70
60
50
0 2 4 6 8 101214161820
Time
Mean conditional demand
Fig. 17.1 The conditional mean aggregate demand as a function of the age of the holding
time in level 1 for Example 17.6.2.
17.7 RECOVERY FROM CONGESTION IN THE STEADY STATE 435
behavior of individual sources is suf®ciently regular, yielding the exponential
approximation
PLt!x%e
ÀIx
: 17:42
Finding the rate function I will in general require numerical solution of the
variational expression (17.41). It can be shown that the right-hand side (RHS) of Eq.
(17.41) is a concave function of y, and under mild conditions it is differentiable also.
Hence, the supremum is achieved at the unique solution y to the Euler±Lagrange
equation
x
P
i
P
j
b
i
j
p
i
j
e
yb
i
j
P
j
H
p
i
j
H
e
yb
i
j
H
0
@
1
A
: 17:43
Generally, it is not dif®cult to numerically determine the supremum in Eq. (17.41) by
location of the solution to Eq. (17.43).
Example 17.7.1. In special cases the variational problem can be solved explicitly.
This is possible in the case of n homogeneous two-level sources. Here we have
b
i
j
b
j
with j Pf1; 2g,0 b
1
< b
2
, and p
1
p
2
1. For this case,
Ixn sup
y>0
yx Àlogp
1
e
yb
1
p
2
e
yb
2
17:44
n
x
b
2
À b
1
log yxÀlog p
1
yx
b
1
=b
2
Àb
1
p
2
yx
b
2
=b
2
Àb
1
17:45
with yxp
1
x Àb
1
= p
2
b
2
À x for b
1
x b
2
and I xIelsewhere.
We now show how to estimate the time to recover from the high-congestion event,
where the high-congestion event is a large initial bandwidth x. We understand
recovery to occur when the aggregate bandwidth is again less than or equal to the
capacity c. In applications, we suggest examining the function of aggregate
bandwidth giving both the probability of reaching that level and the recovery time
from that level to assess whether or not capacity is adequate to meet demand.
We assume that recovery occurs when the aggregate bandwidth drops below a
level c, where x > c > m, with x being the initial level and m being the steady-state
mean. Given that we know the current level of each level process, we know that the
remaining holding time (and also the age) is distributed according to the level-
holding-time stationary-excess distribution in Eq. (17.33). We use the LDP to
approximate the conditional distribution of the level process for each source (in
the steady state). The idea is to perform the appropriate change of measure (tilting)
corresponding to the rare event.
436 NETWORK DESIGN USING HEAVY-TAILED DISTRIBUTIONS
Given that P
P
n
i1
B
i
! x%e
ÀIx
for Ix in Eq. (17.41), the LDP approxima-
tion is
PB
i
b
i
j
P
n
i1
B
i
! x
!
%
p
i
j
p
i
j
e
b
i
j
y
Ã
P
J
i
k1
p
i
k
e
b
i
k
y
Ã
; 17:46
where y* yields the supremum in Eq. (17.41). Put another way, comparing Eq.
(17.46) with Eq. (17.43) we see that y* is chosen to make the expectation of
P
i
B
i
equal to x under the distribution
p. In the homogeneous case, equality in Eq. (17.46)
in the limit as the number of sources increases is due to the conditional limit theorem
of Van Campenhout and Cover [26]. The limit can be extended to cover suitably
regular heterogeneity in the b
i
j
, for example, ®nitely many types of source. We thus
approximate the conditional bandwidth process by
BtjB0x%EBtjB0x
%
P
n
i1
P
J
i
j1
p
i
j
I
0
EB
i
j
tjB
i
j
0y dG
i
je
y
P
n
i1
P
J
i
j1
p
i
j
P
J
i
k1
b
i
k
P
jk
t; 17:47
for
p
i
j
in Eq. (17.46), which has Laplace transform
P
n
i1
P
J
i
j1
p
i
j
P
J
i
k1
b
i
k
^
P
jk
s: 17:48
The Laplace transform
^
P
jk
s in Eq. (17.48) was derived in Theorem 17.6.1. We can
numerically invert it to calculate the conditional mean as a function of time. We then
can determine when EBtjB0x ®rst falls below c. In general, this conditional
mean need not be a decreasing function, so that care is needed in the de®nition, but
we expect it to be decreasing for suitably small t because the initial point B0 is
unusually high.
17.8 A LINEAR APPROXIMATION
Assuming that the relevant time is not too large, we might approximate the
conditional mean bandwidth using a Taylor-series approximation
EBtjB0xx trx; 17:49
17.8 A LINEAR APPROXIMATION 437
where
rx : EB
H
0jB0x
P
n
i1
P
J
i
j1
p
i
j
P
J
i
k1
b
i
k
P
H
jk
0
P
n
i1
P
J
i
j1
p
i
j
P
J
i
k1
P
jk
b
i
k
À b
i
j
mG
j
; 17:50
which has the advantage that no numerical inversion is required.
Suppose the service capacity is c > EB0 and we condition on B0 > c.If
rB0 < 0, we can use Eq. (17.49) to approximate the ®rst time to return to c, the
recovery time,by
t x Àc=rx: 17:51
Suppose in addition that B is reversible; this will happen if the matrix P is reversible.
Then since both the residual lifetime and the current age have distribution F
jke
,
EBÀtjB0 EBtjB0. Consequently, B0x is a local maximum, at
t 0, of EBtjB0.
Now suppose that there are n independent sources. Then as in Duf®eld and Whitt
[14], it follows by use of an appropriate functional law of large numbers that, as
n 3Iunder regularity conditions, the stochastic paths of the B process converge
to this mean path. Thus we can identify, asymptotically as n 3I, t 0 as a hitting
time for the level x. Thus, we can use Eq. (17.42) to approximate the probability of
this hitting time and t in Eq. (17.51) to approximate the associated recovery time.
Example 17.8.1. Consider homogeneous two-level sources, that is, j Pf1; 2g,
0 b
1
< b
2
, p
1
p
2
1 with mean lifetimes m
1
, m
2
, and P
11
P
22
1 À P
12
1 ÀP
21
0. With n sources and B0x we can calculate the
p
j
in Eq. (17.46) directly from the relation x n
p
1
b
1
p
2
b
2
for x Pfnb
1
,
n Àbb
1
b
2
; ; b
1
n À1b
2
; nb
2
g. Then
rxn
p
1
b
2
À b
1
=m
1
p
2
b
1
À b
2
=m
2
nb
2
À x=m
1
Àx À nb
1
=m
2
: 17:52
As a concrete example, we let b
1
1, b
2
5, m
1
3, m
2
1, giving a mean
bandwidth per source of m
1
b
1
m
2
b
2
=m
1
m
2
2. We also let n 50 and
c 150. The parameters of the example were chosen as a caricature of video traf®c
on an OC3 link: take b
i
; x; c in Mb=s, m
i
in seconds.
We present in Table 17.1 some values of n
1
; n
2
, the number of sources in each
level for a given x, the approximate probability e
ÀIx
of demand exceeding x (using I
from Eq. (17.44)), and t. For comparison we give also the exact recovery time for the
mean, calculated by using numerical transform inverstion methods [2], for particular
438 NETWORK DESIGN USING HEAVY-TAILED DISTRIBUTIONS
models of level durations with the same means: (1) both level durations exponen-
tially distributed; (2) lower level exponential, upper level duration Pareto with
exponent 1.5, and hence cdf G
c
x1 2x
À3=2
in order to give mean m
2
1.
The Pareto density gxa1 x
À1a
has a Laplace transform ae
s
s
a
GÀa; s,
where Ga; z is the incomplete gamma function
Ga; z
I
z
t
aÀ1
e
Àt
dt: 17:53
Hence, the required transform values for the Pareto distribution are readily
computable. The algorithms for computing the incomplete gamma function typically
involve continued fractions, as in Abate and Whitt [5].
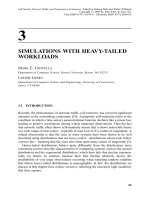
In Fig. 17.2 we display the evolution of the conditioned mean in the linear
approximation, and for the two distributions above with the same mean. As should
be expected, the linear approximation is more accurate when the initial level x is
closer to the capacity c. The linear approximation also behaves worse for the Pareto
high-level durations than for the exponential high-level durations. The linear
approximation tends to consistently provide a lower bound on the true recovery
time for the mean. Even though the linear-approximation estimate of the recovery
time diverges from the true mean computed by numerical inversion as the hitting
level x increases, the probability of such high x can be very small. Even the largest
errors in predicted recovery times in Table 17.1 are within one order of magnitude,
and so might be regarded as suitable approximations. From our experiments, we
conclude that the linear approximation is a convenient rough approximation, but that
the numerical inversion yields greater accuracy.
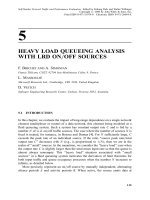
In closing this section, we emphasize that a key point is the two-dimensional
characterization of rare congestion events in terms of likelihood and recovery time.
To further show how this perspective can be exploited, we plot in Fig. 17.3, for
TABLE 17.1 Homogeneous Two-Level Sources
a
# Sources Initial Steady-state Recovery Time t
Initially in Total Probability
Each Level Demand of x Inversion
n
1
n
2
xe
ÀIx
Linear
Approx.
Exponential
Duration
Pareto
Duration
25 25 150 7.5 Â 10
À4
00 0
22 28 162 1.9 Â 10
À5
0.15 0.16 0.19
19 31 174 2.4 Â 10
À7
0.24 0.29 0.41
16 34 186 1.4 Â 10
À9
0.31 0.41 0.64
13 37 198 3.5 Â 10
À12
0.37 0.50 0.91
a
Approximate hitting probabilities of aggregate demand x, together with recovery time t of mean from x,
by linear approximation, and exact for (1) exponential duration and (2) Pareto duration of higher level; see
Example 17.8.1.
17.8 A LINEAR APPROXIMATION
439
various offered loads, the approximate probability e
ÀIxt
of a demand at least xt
as a function of t, where t c À xt=rxt; that is, xr is the demand from
which the recovery time to the level c is t, using the linear approximation. Figure
17.3 shows that the two criteria together impose more constraints on what sets of
E
B
B
t
Fig. 17.2 Recovery curves for two-level sources: linear approximation and numerical
transform inversion with exponential and Pareto durations in the higher level; see Example
17.8.1.
Duration
(
seconds
)
τ
Fig. 17.3 Design criteria: estimated probability of overdemand of at least duration t, for
various offered loads; see Section 17.8.
440
NETWORK DESIGN USING HEAVY-TAILED DISTRIBUTIONS
sources are acceptable. Expressed differently, for the same probability of occurrence,
rare congestion events can have very different recovery times.
17.9 COVARIANCE STRUCTURE
Useful characterizations of the aggregate and single-source bandwidth processes are
their (auto)covariance functions. The covariance function may help in evaluating the
®tting. We now show that we can effectively compute the covariance function for our
traf®c source model.
Let fBt: t ! 0g and fB
i
t: t ! 0g be stationary versions of the aggregate and
source-i bandwidth processes, respectively. Assuming that the single-source band-
width processes are mutually independent, the covariance function of the aggregate
bandwidth process is the sum of the single-source covariance functions; that is,
RtCovB0; Bt
P
n
i1
CovB
i
0; B
i
t: 17:54
Hence, it suf®ces to focus on a single source, and we do, henceforth dropping the
superscript i.
In general,
RtStÀm
2
; 17:55
where the steady-state mean m is as in Eq. (17.31) and (17.32) and
StEB0Bt
I
0
dx
P
J
j1
b
j
p
j
g
je
x
P
J
k1
b
k
P
jk
tjx
P
J
j1
p
j
G
c
je
t CovW
j
0; W
j
t; 17:56
where g
je
xG
c
j
x=mG
j
is the density of G
je
, and the second term captures the
effect of the within-level variation process. In Eq. (17.56) b
j
is the bandwidth in level
j, p
j
is the steady-state probability of level j, g
je
xG
c
j
x=mG
j
with G
j
the level-j
holding-time cdf and mG
j
its mean, and P
jk
tjx is the transition probability, whose
matrix of Laplace transforms is given in Theorem 17.4.1. We can thus calculate St
by numerically inverting its Laplace transform
^
Ss
I
0
e
Àst
St dt
P
J
j1
b
j
p
j
mG
j
I
0
G
c
j
x
P
J
k1
b
k
^
P
jk
sjx dx
P
J
j1
p
j
I
0
e
Àst
G
c
je
t CovW
j
0; W
j
t dt: 17:57
17.9 COVARIANCE STRUCTURE 441
To treat the second term on the right in Eq. (17.57), we can assume an approximate
functional form for the covariance of the within-level variation process Wt.For
example, if
CovW
j
0; W
j
t s
2
j
e
ÀZ
j
t
; t ! 0; 17:58
then
P
J
j1
p
j
I
0
e
Àst
G
c
je
t CovW
j
0; W
j
t dt
P
J
j1
p
j
s
2
j
1 À
^
g
j
s Z
j
s Z
j
mG
j
: 17:59
Thus, with approximation (17.58), we have a closed-form expression for the second
term of the transform
^
Ss in Eq. (17.57). For each required s in
^
Ss, we need to
perform one numerical integration in the ®rst term of Eq. (17.57), after calculating
the integrand as a function of x.
A major role is played by the asymptotic variance
I
0
Rt dt. For example, the
heavy-traf®c approximation for the workload process in a queue with arrival process
t
0
Bu du, t ! 0, depends on the process fBt: t ! 0g only through its rate EB0
and its asymptotic variance; see Iglehart and Whitt [22]. The input process is said to
exhibit long-range dependence when this integral is in®nite. The source traf®c model
shows that long-range dependence stems from level-holding-time distributions with
in®nite variance.
Theorem 17.9.1. If a level-holding-time cdf G
j
has in®nite variance, then the
source bandwidth process exhibits long-range dependence, that is,
I
0
Rt dt I:
Proof. In Eq. (17.56) we have the component
I
0
g
je
xP
jj
tjx dx;
which in turn has the component
I
0
g
je
xG
c
j
tjxG
c
je
t;
but
I
0
G
c
je
t dt I
442 NETWORK DESIGN USING HEAVY-TAILED DISTRIBUTIONS
if G
j
has in®nite variance. (As can be seen using integration by parts, the integral is
the mean of G
je
; see Feller [18, p. 150]. In general, G
je
has kth moment
m
k1
G
j
=k 1m
1
G
j
, where m
k
G
j
is the kth moment of G
j
.) j
Note that if approximation (17.58) holds, then the level process contributes to
long-range dependence, but the within-level variation process does not, because
P
J
j1
p
j
I
0
G
c
je
t CovW
j
0; W
n
t dt %
P
J
j1
p
j
s
2
j
1 À
^
g
j
Z
j
Z
j
mG
j
< I:
17.10 CONCLUSION
We have shown how transient analysis to support network design and control can be
carried out for both on=off and multilevel source traf®c models with general,
possibly heavy-tailed, level-holding-time distributions. In Section 17.4 we analyzed
the transient behavior of a general source traf®c model composed of a semi-Markov
level process and a zero-mean piecewise-stationary within-level variation process.
We approximated the conditional aggregate demand from many sources given
system state information by the conditional aggregate mean given level values and
ages. The within-level variation process plays no role in this approximation. We
showed that the conditional mean can be effectively computed using numerical
transform inversion and developed several approximations to it (Sections 17.5 and
17.8). We showed how the model can be exploited to study the value of information
(Section 17.6). We applied our techniques to examples in network design (Section
17.8).
Even though our approach is to focus on offered load, unaltered by loss and delay
associated with ®nite capacity, we can apply the conditional mean approximation in
Section 17.4 to develop an approximation to describe loss and delay from a ®nite-
capacity system, just as described in Duf®eld and Whitt [14, Section 5] for the
M=G=I arrival process. Finally, our approach can be extended to a nonstationary
setting in which connections arrive according to a nonhomogeneous Poisson
process; see Duf®eld et al. [16]. Then each active connection may generate traf®c
according to the model considered here. It is signi®cant that it is possible to obtain
computationally tractable descriptions of the time-dependent aggregate demand.
REFERENCES
1. J. Abate, G. L. Choudhury, and W. Whitt. An introduction to numerical transform inversion
and its application to probability models. In W. Grassman, ed., Computational Probability.
Kluwer, Boston, pp. 257±323, 1999.
2. J. Abate and W. Whitt. Numerical inversion of Laplace transforms of probability
distributions. ORSA J. Comput., 7:36±43, 1995.
REFERENCES 443
3. J. Abate and W. Whitt. Modeling service-time distributions with non-exponential tails: beta
mixtures of exponentials. Stoch. Models, 15:517±546, 1999.
4. J. Abate and W. Whitt. In®nite series representations of Laplace transforms of probability
density functions for numerical inversion. J. Opns. Res. Soc. Japan 42, 1999, in press.
5. J. Abate and W. Whitt. Computing Laplace transforms for numerical inversion via
continued fractions. INFORMS J. Comput., 11, 1999, in press.
6. S. Asmussen, O. Nerman, and M. Olsson. Fitting phase-type distributions via the EM
algorithm. Scand. J. Statist. 23:419±441, 1996.
7. R. Ca
Â
ceres, P. G. Danzig, S. Jamin, and D. J. Mitzel. Characteristics of wide-area TCP=IP
conversations. Comput. Commun. Rev., 21:101±112, 1991.
8. H. Chen and A. Mandelbaum. Discrete ¯ow networks: bottleneck analysis and ¯uid
approximations. Math. Oper. Res., 16:408±446, 1991.
9. E. CË inlar. Introduction to Stochastic Processes. Prentice-Hall, Englewood Cliffs, NJ,
1975.
10. M. E. Crovella and A. Bestavros. Self-similarity in World Wide Web traf®cÐevidence and
possible causes. In Proc. ACM SIGMETRICS'96, pp. 160±169, 1996.
11. A. Dembo and O. Zeitouni. Large Deviation Techniques and Applications. Jones and
Bartlett, Boston, 1993.
12. N. G. Duf®eld. Economies of scale in queues with sources having power-law large
deviation scalings. J. Appl. Probab., 33:840±857, 1996.
13. N. G. Duf®eld. Queueing at large resources driven by heavy-tailed M=G=I-modulated
processes. Queueing Syst., 28:245±266, 1998.
14. N. G. Duf®eld and W. Whitt. Control and recovery from rare congestion events in a large
multi-sever system. Queueing Syst., 26:69±104, 1997. For shorter version see: Recovery
from congestion in large multiserver systems. In Proceedings ITC-15, pp. 371±380,
Washington, DC, 22±27 June 1997.
15. N. G. Duf®eld and W. Whitt. A source traf®c model and its transient analysis for network
control. Stoch. Models, 14:51±78, 1998.
16. N. G. Duf®eld, W. A. Massey, and W. Whitt. A nonstationary offered-load model for
packet networks. Telecommun. Syst., in press, 1999.
17. A. Feldmann and W. Whitt. Fitting mixtures of exponentials to heavy-tail distributions to
analyze network performance models. Perf. Eval., 31:245±279, 1998. Shorter version in
Proc. IEEE INFOCOM'97, pp. 1098±1106.
18. W. Feller. An Introduction to Probability Theory and Its Applications, Vol. II, 2nd ed.
Wiley, New York, 1971.
19. M. Grasse, M. R. Frater, and J. F. Arnold. Origins of long-range dependence in variable bit
rate video traf®c. In Proceedings ITC-15, pp. 1379±1388, Washington, DC, 22±27 June
1997.
20. M. Grossglauser, S. Keshav, and D. Tse. RCBR: A simple and ef®cient service for multiple
time-scale traf®c. In Proc. ACM SIGCOMM'95, pp. 219±230, 1995.
21. M. Harchol-Balter and A. Downey. Exploiting process lifetime distributions for dynamic
load balancing. In Proceedings of ACM SIGMETRICS'96 Conference on Measurement
and Modeling of Computer Systems, pp. 13±24, Philadelphia, 1996.
22. D. L. Iglehart and W. Whitt. Multiple channel queues in heavy traf®c, II: sequences,
networks and batches. Adv. Appl. Probab., 2:355±369, 1970.
444
NETWORK DESIGN USING HEAVY-TAILED DISTRIBUTIONS
23. W. E. Leland, M. S. Taqqu, W. Willinger, and D. V. Wilson. On the self-similar nature of
Ethernet traf®c. IEEE= ACM Trans. Networking, 2:1±15, 1994.
24. V. Paxson and S. Floyd. Wide-area traf®c: the failure of Poisson modeling. IEEE=ACM
Trans. Networking, 3:226±244, 1995.
25. J. Salehi, Z. Zhang, J. Kurose, and D. Towsley. Supporting stored video: reducing rate
variability and end-to-end resource requirements through optimal smoothing. In Proc.
ACM SIGMETRICS, pp. 222±231, 1996.
26. J. M. Van Campenhout and T. M. Cover. Maximal entropy and conditional probability.
IEEE Trans. Inf. Theory, 4:183±189, 1981.
27. W. Willinger, M. S. Taqqu, R. Sherman, and D. V. Wilson. Self-similarity through high-
variability: statistical analysis of Ethernet LAN traf®c at the source level. IEEE=ACM
Trans. Networking, 5:71±86, 1997.
REFERENCES 445