Coastal erosion in phu cat district binh dinh province in the context of climate change and adaptation measures
Bạn đang xem bản rút gọn của tài liệu. Xem và tải ngay bản đầy đủ của tài liệu tại đây (11.57 MB, 125 trang )
PLEDGE
I assure that this thesis is my research work and has not been published. The results of
this thesis are honest, not copied from any source and in any form. The references to
the source materials used in this thesis have been cited following the regulations.
AUTHOR OF THE THESIS
NGUYEN THI THUY DUNG
ACKNOWLEDGMENTS
Foremost, I would like to express my deep gratitude to Professor Yasuhara Kazuya
and Associate Professor Do Minh Duc for wholeheartedly guiding and supporting me
conducted this research.
I would also like to thank Mr Nguyen Huu Hoa, deputy director of Binh Dinh
Department of Science and Technology, for helping me collect the data for the thesis.
May warm thanks also go to Ms Dinh Thi Quynh for her kind help, academic advice,
and support during the study.
I also want to express my thanks to the MCCD program for all support and sharing.
Last but not least, I would like to thank my family for always being my spiritual
support and encouragement me to overcome all difficulties to complete this thesis.
CONTENT
LIST OF TABLES .......................................................................................................... i
LIST OF FIGURES .......................................................................................................ii
LIST OF ABBREVIATIONS ....................................................................................... v
CHAPTER 1: INTRODUCTION ................................................................................ 1
1.1. Rationale of the study ............................................................................................... 1
1.2. Objectives of the research ........................................................................................2
1.3. Objects and Scope of the research ............................................................................3
1.4. Research questions and hypotheses ..........................................................................3
1.5. Significance of the research......................................................................................3
1.6. The novelty of the research ......................................................................................3
1.7. The structure of the thesis......................................................................................... 3
1.8. Review related literature and studies. ......................................................................4
1.8.1. Definitions ...................................................................................................... 4
1.8.2. Overview of studies on coastal erosion .......................................................... 6
1.8.3. Overview of adaptation measures .................................................................. 8
1.9. Site descriptions ......................................................................................................14
1.9.1. Location and natural conditions ................................................................... 14
1.9.2. Socio-economic condition ............................................................................ 18
1.9.3. Climate change in Binh Dinh ....................................................................... 21
CHAPTER 2. METHODOLOGY ............................................................................. 27
2.1. Approaches .............................................................................................................27
2.2. Data collection ........................................................................................................28
2.2.1. Primary data .................................................................................................. 28
2.2.2. Secondary data .............................................................................................. 30
2.3. Methods ..................................................................................................................34
2.3.1. Qualitative methods ...................................................................................... 34
2.3.2. Quantitative methods .................................................................................... 35
CHAPTER 3. RESULTS AND DISCUSSION ......................................................... 43
3.1. Results ....................................................................................................................43
3.1.1. Sediment distribution.................................................................................... 43
3.1.2. UAVs photo processing ................................................................................ 44
3.1.3. Shoreline change analysis............................................................................. 44
3.1.4. Preliminary assessment of the causes of coastal erosion ............................. 60
3.1.5. Shoreline change prediction ......................................................................... 63
3.1.6. Adaptation measures .................................................................................... 72
3.2. Discussion ...............................................................................................................85
CHAPTER 4. RECOMMENDATIONS .................................................................... 90
4.1. Recommendation for using research results. .......................................................... 90
4.2. Further research orientations ..................................................................................90
CONCLUSIONS .......................................................................................................... 91
REFERENCES ............................................................................................................ 93
APPENDIX................................................................................................................... 98
LIST OF TABLES
Table 1. 1: Research objectives, questions and hypotheses ............................................ 3
Table 1. 2: Structural solutions to prevent coastal erosion.............................................. 9
Table 1. 3: Anti-erosion solutions of Cua Dai beach .................................................... 11
Table 1. 4: Average rainfall in years at Phu Cat station ................................................ 16
Table 1. 5: Wave and current characteristics at the De Gi estuary. .............................. 17
Table 1. 6: Population of 5 coastal communes of Phu Cat district ............................... 18
Table 1. 7: Land use status of 5 coastal communes of Phu Cat district in 2013 ........... 19
Table 1. 8: List of storms that landed or affected Binh Dinh province (1988-2017) .... 24
Table 2. 1: Landsat 8-9 OLI/TIRS (L2SP) Band Specifications ................................... 31
Table 2. 2: Landsat 4-5 TM (L2SP) Band Specifications ............................................. 31
Table 2. 3: List of satellite images used in the study. ................................................... 32
Table 2. 4: Summary of data used in the research. ........................................................ 33
Table 2. 5: List of research methods ............................................................................. 34
Table 3. 1: Shoreline change rate in NE monsoon season (1989-2016) ....................... 47
Table 3. 2: Shoreline change rate in NE monsoon season (1989-1999) ....................... 48
Table 3. 3: Shoreline change rate in NE monsoon season (1999-2008) ....................... 49
Table 3. 4: Shoreline change rate in NE monsoon season (2008-2016) ....................... 50
Table 3. 5: Shoreline change rate in SW monsoon season (1989-2014)....................... 52
Table 3. 6: Shoreline change rate in SW monsoon season (1989-2000)....................... 53
Table 3. 7: Shoreline change rate in SW monsoon season (2000-2008)....................... 54
Table 3. 8: Shoreline change rate in SW monsoon season (2008-2014)....................... 55
Table 3. 9: Shoreline change in 1989 ............................................................................ 56
Table 3. 10: Shoreline change in 1993 .......................................................................... 57
Table 3. 11: Shoreline change in 2008 .......................................................................... 58
Table 3. 12: Shoreline change rate in 2014 ................................................................... 59
Table 3. 13: Estimation of shoreline retreat due to SLR in Cat Khanh beach .............. 69
Table 3. 14: Estimation of shoreline retreat due to SLR in Cat Hai beach ................... 70
Table 3. 15: Estimation of shoreline retreat due to SLR in Vinh Hoi beach ................ 71
Table 3. 16: Estimation of shoreline retreat due to SLR in Trung Luong beach .......... 71
Table 3. 17: The group of non-structural solutions ....................................................... 72
Table 3. 18: Features of Phu Cat coastal dunes ............................................................. 74
Table 3. 19: Activities of exploiting dunes along Phu Cat coastline ............................ 74
Table 3. 20: List of policies related to coastal erosion issue in Binh Dinh province .... 74
Table 3. 21: Preliminary assessment of adaptive capacity for Phu Cat district ............ 75
Table 3. 22: Compare the results of the study with related studies. .............................. 87
i
LIST OF FIGURES
Figure 1. 1: Phu Cat coast was eroded in 2017. .............................................................. 2
Figure 1. 2: The coastal zone ........................................................................................... 4
Figure 1. 3: Headland type concrete structures to protect the coastal area from erosion
in Ibaraki, Japan ............................................................................................................... 9
Figure 1. 4: Embankment in Phan Thiet beach ............................................................. 12
Figure 1. 5: T-groynes and break water in Ro hamlet, Phu Yen province .................... 12
Figure 1. 6: Tam Quan embankment was broken in 2019 ............................................ 13
Figure 1. 7: Casuarina trees along the coast in An Quang Dong village, Cat Khanh
commune, was uprooted in 2017. .................................................................................. 13
Figure 1. 8: Location map of the study area .................................................................. 14
Figure 1. 9: Topography map of the study area ............................................................ 15
Figure 1. 10: Wave rose at the De Gi estuary a) September 2012 and b) June 2013. ... 17
Figure 1. 11: Economic structure of Phu Cat district .................................................... 19
Figure 1. 12: Some beautiful beaches in the Phu Cat district........................................ 21
Figure 1. 13: Temperature trend in Binh Dinh province from 2006 to 2019. ............... 22
Figure 1. 14: Change of annual rainfall (%) ( 1958-2014) ............................................ 22
Figure 1. 15: The influence of storm Linfa along with heavy rain caused flooding in
many areas in Binh Dinh province ................................................................................ 23
Figure 1. 16: Path of storms that hit the East Sea and Vietnam in the past 70 years. ... 23
Figure 1. 17: Average Sea level at Quy Nhon station. .................................................. 26
Figure 2. 1: The research framework ............................................................................ 28
Figure 2. 2: DJI Phantom 4 Advanced .......................................................................... 29
Figure 2. 3: UAV photos of Phu Cat coastal area, captured by the DJI Phantom 4
Advance+ ....................................................................................................................... 29
Figure 2. 4: Topographic maps of study area published by U. S. Army Topographic
Command....................................................................................................................... 30
Figure 2. 5: UAV photos processing flowchart ............................................................. 35
Figure 2. 6: Sand samples after drying (Left) and sampling location (Right) of coastal
sand in Phu Cat district .................................................................................................. 36
Figure 2. 7: Particle size classification by manual sieving method............................... 36
Figure 2. 8: Illustration of the Bruun Rule, by the Scientific Committee on Ocean
Research (1991) ............................................................................................................. 37
Figure 2. 9: Parabolic bay-shape model (after Hsu and Evans, 1989) .......................... 38
Figure 2. 10: The logical framework ............................................................................. 42
Figure 3. 1: Particle size distribution along Phu Cat coastline ...................................... 43
Figure 3. 2: UAV images interpretation results (overlap on Google Earth background)44
Figure 3. 3: Four research segments .............................................................................. 45
Figure 3. 4: Result of the shoreline extraction .............................................................. 46
ii
Figure 3. 5: Erosion - Accretion classification (EPR) ................................................... 47
Figure 3. 6: Shoreline change map (EPR) in NE monsoon season (1989-2016) .......... 48
Figure 3. 7: Shoreline change map (EPR) in NE monsoon season (1989-1999) .......... 49
Figure 3. 8: Shoreline change map (EPR) in NE monsoon season (1999-2008) .......... 50
Figure 3. 9: Shoreline change map (EPR) in NE monsoon season (2008-2016) .......... 51
Figure 3. 10: Shoreline change map (EPR) in SW monsoon season (1989-2014) ....... 52
Figure 3. 11: Shoreline change map (EPR) in SW monsoon season (1989-2000) ....... 53
Figure 3. 12: Shoreline change map (EPR) in SW monsoon season (2000-2008) ....... 54
Figure 3. 13: Shoreline change map (EPR) in SW monsoon season (2008-2014) ....... 55
Figure 3. 14: Map of shoreline change (NSM) in 1989 ................................................ 57
Figure 3. 15: Map of shoreline change (NSM) in 1993 ................................................ 58
Figure 3. 16: Map of shoreline change (NSM) in 2008 ................................................ 59
Figure 3. 17: Map of shoreline change (NSM) in 2014 ................................................ 60
Figure 3. 18: Aquaculture area along De Gi beach ....................................................... 62
Figure 3. 19: Shoreline prediction for the next10 years and 20 years ........................... 64
Figure 3. 20: Predicted SEP of De Gi beach (1965) ..................................................... 65
Figure 3. 21:Predicted SEP of De Gi beach (2019) ...................................................... 65
Figure 3. 22: Predicted SEP of the beach near Ong Lop headland (2019) ................... 66
Figure 3. 23: Predicted SEP of Cat Hai beach (2019) ................................................... 67
Figure 3. 24: Predicted SEP of Vinh Hoi beach (2019) ................................................ 67
Figure 3. 25: Predicted SEP of Trung Luong beach (2019) .......................................... 68
Figure 3. 26: Four representative cross-sections of Phu Cat shoreline ......................... 69
Figure 3. 27: Representative cross-section of Cat Khanh beach ................................... 69
Figure 3. 28: Representative cross-section of Cat Hai beach ........................................ 70
Figure 3. 29: Representative cross-section of Vinh Hoi beach ..................................... 71
Figure 3. 30: Representative cross-section of Trung Luong beach ............................... 71
Figure 3. 31: De Gi jetty with tetrapod structure .......................................................... 79
Figure 3. 32: Dania beach with jetty and groynes ......................................................... 79
Figure 3. 33: Dania Beach, Florida, USA (viewed from the North). ............................ 80
Figure 3. 34: Conservation of natural vegetation combined coastal setbacks in Dania
Beach, Florida, USA. ..................................................................................................... 80
Figure 3. 35: An example of native vegetation conservation on the coastal sand dunes
in India ........................................................................................................................... 81
Figure 3. 36: Proposal on the process of integrating coastal erosion into construction
planning ......................................................................................................................... 82
Figure 3. 37: Orientation for construction planning in Phu Cat district (browsed) ...... 83
Figure 3. 38: Mainstreaming anti-erosion measures into planning ............................... 84
Figure 3. 39: Parabolic model for T-groins (tentative) at the beach of An Quang village
(Cat Khanh commune) .................................................................................................. 85
Figure 3. 40: Comparison of erosion rate (EPR index) in NEMS and SWMS ............. 86
iii
iv
LIST OF ABBREVIATIONS
MONRE
GSO
CC
GIS
DSAS
EPR
NSM
LR
IPCC
USGS
UNFCCC
IWRM
CZM
FAO
EC
ICAM
ICZM
PBSE
HBB
NEMS
SWMS
Ministry of Natural Resources and Environment
General Statistics Office
Climate change
Geographic information system
Digital Shoreline Analysis System
End Point Rate
Net Shore Movement
Linear Regression
Intergovernmental Panel on Climate Change
United States Geological Survey
United Nations Framework Convention on Climate Change
Integrated Water Resources Management
Coastal Zone Management
Food and Agriculture Organization
The European Commission
Integrated Coastal Area Management
Integrated Coastal Zone Management
Parabolic Bay Shape Equation
Headland-bay beaches
North-east monsoon season
South-west monsoon season
v
CHAPTER 1: INTRODUCTION
1.1. Rationale of the study
Climate change is becoming the biggest challenge facing humanity on a global
scale. According to the Global Climate Risk Index 2021 (CRI) report, Vietnam ranked
13 out of 180 countries [1]. Recognizing the dangers of climate change, on April 22 at
the United Nations headquarters in New York (USA), Vietnam and about 180
countries signed the Paris Agreement, officially step into the fight against global
climate change [2].
In Vietnam, in the past 50 years, the average temperature has increased by
0.5÷0.7oC, the sea level has risen about 20cm. Extreme weather events, especially
storms, floods, and droughts, are becoming increasingly severe. According to the
climate change and sea-level rise scenarios released in 2016 by MONRE, the average
temperature in Vietnam could rise to 4oC, and sea level could rise 1 m by 2100 [3].
Vulnerable areas include coastal areas (especially areas often affected by storms, storm
surges, floods); mountainous areas, especially places where flash floods and landslides
often occur.
With a coastline of 3,260 km, Vietnam's marine economy is developing strongly.
However, climate change and sea-level rise would increase the risk of inundation,
erosion, and salinity, affect the economy, people's livelihoods, threaten or destroy the
coastal technical infrastructure system.
At present, coastal erosion has become common all over the coast of Vietnam,
from the North to the South. According to research by Pham Huy Tien et al. (2002),
the total number of eroded banks is 397, with a total length of 920.21km. The average
erosion rate is about 5-10m/year, but could reach 50-100m/year, even 200-250m/year
in short intervals [3].
Binh Dinh is a coastal province located in Central Vietnam, borders the East Sea
with a coastline of 134 km. Binh Dinh has significant advantages by nature and great
potential for the development of the marine economy.
1
According to the Chairman of Binh Dinh Provincial People's Committee, the most
erosion hot spot is Phu My district with four communes My Duc, My Thang, My An
and My Thanh; including the total length of the landslide is 3,900m; affecting the life
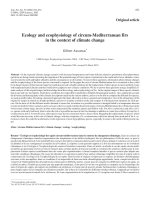
and production of 2,520 households. In Phu Cat district, coastal erosion occurred in An
Quang village, Cat Khanh commune, with over 520m, affecting 550 families. In 2015
and 2017, coastal erosion uprooted many casuarina trees, and waves intruded inland in
some places over 70m. In Cat Tien commune, the sea firmly invaded Trung Luong
village over 500m, affecting 495 households [4] (Please see Figure 1.1).
(Source: Internet)
Figure 1. 1: Phu Cat coast was eroded in 2017.
Realizing the potential risk caused by the impacts of climate change, in June 2020,
Department of Science and Technology of Binh Dinh province proposed to order an
independent national science and technology mission: "Research on integrated
technology solutions to strengthen resilience and ability to proactively respond to
erosion and accretion disaster of coastal villages and communes of Binh Dinh province
in the context of urbanization and climate change".
From the above practice, the topic "Coastal erosion in Phu Cat district, Binh Dinh
province in the context of climate change and adaptation measures" was selected for
research to analyze coastal erosion under the impacts of climate change; and propose
adaptation solutions in accordance with the local adaptive capacity.
1.2. Objectives of the research
This study has three main objectives: to analyze shoreline changes, to forecast
shoreline changes in the context of climate change, and to propose adaptation
measures.
2
1.3. Objects and Scope of the research
-
Research object: shoreline changes (focus on coastal erosion)
-
Research scope: the entire coastal strip in Cat Khanh, Cat Thanh, Cat Hai, Cat
Tien and Cat Chanh.
1.4. Research questions and hypotheses
Table 1. 1: Research objectives, questions and hypotheses
Objectives
Research Questions
Hypotheses
[O1]: Analyze shoreline [Q1]: How have the [H1]: Coastal erosion takes place
change
shorelines changed?
both in the long term and
seasonally
[O2]: Predict shoreline [Q2]: How would [H2]: Shoreline would continue to
change
shoreline change?
recede under CC.
[O3]: Propose anti- [Q3]:
Which [H3]:
For
the
long-term
erosion measures.
countermeasures could preventing coastal erosion and
respond to coastal responding to climate change, a
erosion?
combination of hard and soft
measures is needed.
1.5. Significance of the research
Scientific significance: This study contributes to enriching research series on
coastal erosion for coastal provinces and cities of Vietnam in the context of climate
change.
Practical significance: The study provides some analysis of shoreline change
(focus on coastal erosion) in the Phu Cat district and some anti-erosion
countermeasures based on existing local conditions.
1.6. The novelty of the research
This study is the first study on the erosion phenomenon in Phu Cat district. This is
also the first study to integrate coastal erosion issues into spatial planning and propose
anti- erosion solutions based on local adaptive capacity.
1.7. The structure of the thesis
The thesis, apart from the Conclusions, consists of four chapters as below:
3
Chapter 1: Introduction
Chapter 2: Methodology
Chapter 3: Results and Discussion
Chapter 4: Recommendations
1.8. Review related literature and studies.
1.8.1. Definitions
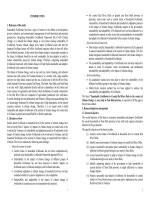
*
Coastal zone: The coastal zone is “a zone of transition between the purely
terrestrial and purely marine components on Earth‟s surface” [5].
(Source: Pearson Prentice Hall, Inc, 2009)
Figure 1. 2: The coastal zone
In the Ramsar handbooks for the use of wetlands, 4th edition, the coastal zone is
an area with a relatively narrow interface between land and sea, where ecological and
functional processes are complex and intensive, depending on the interaction between
land and sea. The coastal zone contains terrestrial and aquatic ecosystems closely
linked to the socio-economic system, forming complex functional units [6].
In the book " Vietnam coastal zone - structure and natural resources", the author
Le Duc An claimed that the coastal zone consists of two ribbon spaces embracing the
shoreline, the coastal strip and the shallow coastal strip edge. The inner boundary of
the coastal strip is the administrative boundary of the coastal districts and cities, and
4
the outer border of the external coastal strip is the edge of the continental shelf, usually
up to a depth of 200m [7].
*
Coastal area:
FAO commonly defines coastal areas as the interface or transition areas between
land and sea [8]. Thus, the term "coastal zone'' relates to the geographical location in
terms of coastal management. In contrast, "coastal area'' is more widely used to refer to
the geographical area along the coast in general.
*
Coastline:
The coastline is the contact line dividing the land from the coastal water bodies
[6]. In general, the coastline is the boundary between land and sea. This boundary is
also not stationary but always moves under waves, tides, currents, etc.
The coastline is the highest boundary of waves during interaction with the
mainland. This boundary is usually cliffs, dunes or terrestrial vegetation [9].
*
Shoreline:
DOLAN et al., 1980 defined shoreline is ideally defined as the physical interface
between soil and water [10].
Anders et al., 1991 defined the shoreline as an intersection separated by land, sea,
and air [11].
*
Coastal erosion
Coastal erosion occurs when a specific area of the coast loses its material supply
and material export [12].
*
Coastline retreat
Coastline retreat is the process by which the shoreline moves landward due to
long-term erosion trends or due to sea level rise [12].
5
1.8.2. Overview of studies on coastal erosion
1.8.2.1. Overview of coastal erosion studies in the world
Long times ago, people gathered in the coastal plains to take benefits from coastal
resources. As a result, coastal erosion took place and the history of human
development based on the sea.
According to the IPCC report, the average reverse speed of the shoreline of
Louisiana, USA, was from 0.61 m / year in the period 1855-2002 to 0.94 m / year
since 1988 [13]. In China, coastal erosion also accounts for nearly 50% of the
coastline. For example, the Yellow Sea eroded 49%, the East China Sea eroded 44%,
the coast of Guangdong province and Hainan Island erodes 21% [13].
Traces of anti-erosion structures such as ports and breakwaters constructed at the
Nile river-mouth around 2500 BC and today's anti-erosion protection works show that
studies of coastal erosion had a long time of implementation. Interaction between land
and sea. The coastal zone contains terrestrial and aquatic ecosystems closely linked to
the socio-economic system, forming complex functional units in ecology.
a) Research on coastal erosion based on geological, geomorphological, and
hydrodynamic viewpoints.
Strahler (1952) and Hack (1960) studied topographical evolution, analyzed the
processes of erosion and accretion based on morphological dynamics [14] [15].
Zencovich (1962) examined the evolution of the coast concerning the factors that form
and change the coastal topography and the role of climate and coastal vegetation in
geomorphologic development [16]. Other authors such as Eliot and Clark (1982),
Thom and Hall (1991), McLean and Shen (2006) studied coastal erosion based on
beach profiles [17] [18] [16].
b) Research on coastal erosion concerning climate change.
Bruun (1962) gave a view (known as the Bruun Rule) on the impact of sea-level
rise on the coast, claiming that the beach's horizontal profile had reached a dynamic
equilibrium when the sea level is stable. Meanwhile, Zhang et al. (2004) believed that
6
the three possible causes of coastal erosion are: sea-level rise, storm regime changes,
and human intervention [20].
In general, in the period before 1990, studies on coastal erosion mainly used
fundamental theories and practical measurement methods. Only in 1972, when the first
Landsat satellite launched into orbit, research on shoreline change based on satellite
imagery started appearing.
The era since 1990 is the period of a combination of traditional geomorphological
research, geomorphic technology, and modelling in coastal erosion analysis. For
example, Kay (1990) assessed coastal erosion under SLR and GHE effects [21];
Corwell (1991) analyzes the trend of shoreline changes and analyzes the uncertainty of
volatility assessment techniques [22]. Cambers (1998) studied coastal retreat for
coastal planning investigative methods associated with satellite image interpretation
[23]; Woodrrofe (2002) evaluated the evolution of coastal topography, sediment
changes by traditional investigative methods related to satellite image interpretation
[24].
The Coastal Vulnerability Index (CVI) trend has become popular since the
beginning of the twenty-first century. Authors represented this approach include
Gornitz et al. (1994) [25], Thieler and Hammar (1999) [26], Dwarakish et al. (2009)
[27], Özyurt and Ergin (2009) [28], etc.
Currently, studies of coastal evolution have come a long way by combining many
different methods such as satellite image interpretation, statistics, mathematical
modelling, hydrodynamic modelling, etc.
1.8.2.2. Overview of coastal erosion studies in Vietnam
In Vietnam, research on coastal erosion has only been popular since the 90s of the
20th century until now. Studies on coastal erosion in central Vietnam are also of
interest to domestic scientists.
The foundation research on coastal evolution in Vietnam is a State-level research
project of author Nguyen Thanh Nga, with code KT-03-14, which assessed the current
7
state and the causes of coastal erosion in Vietnam and proposed technical solutions.
Following that, the studies of Cu et al. (2001, 2003, 2005) [29], Nguyen Manh Hung
(2010) [30], Pham Huy Tien et al. (2005) [31], Mimura (2008) [32], Le Phuoc Trinh et
al. (2011) [33], gave more views on the trend of coastal erosion and accretion in
Vietnam. In which, some research proposed the application of remote sensing to create
sensitive coastal maps. Most studies have evaluated the current state of the volatility
(erosion and accretion) of Vietnam's coastline and the future trend of the increase
related to global climate change (sea-level rise, storm surge).
In terms of research methods: Until now, Vietnamese scientists mainly used
geomorphology research methods such as morpho-dynamic, hydrodynamic, and
analysis methods based on topographic maps, aerial photography, remote sensing
images, etc. The above studies all use at least one of these research methods to analyze
shoreline changes.
For Binh Dinh province, up to now, in addition to the studies on coastal erosion in
the Central region mentioned above, most studies have focused on the analysis of the
accretion phenomenon of some estuaries such as the Tam Quan estuary, De Gi estuary
such as Do Minh Duc et al. (2017) [34], Dinh Thi Quynh (2017) [35].
There was one study conducted by Vo Ngoc Duong et al. (2019) published in the
proceedings of the 10th International Conference on the coasts of Asia and the Pacific
(APAC 2019) [37]. This study aimed to identify shoreline fluctuations in Binh Dinh
province from 1975 to 2017 used Remote sensing technology and DSAS application.
1.8.3. Overview of adaptation measures
1.8.3.1. Adaption measures in the world
The world has had many works to solve the problem of the estuary and coastal
erosion. Countries with advanced marine science and technology have long built
estuary and coastal protection works. Those solutions are mainly around two main
types: construction and non-structural. Materials used are diverse, from reinforced
concrete, steel piles to geo-bags, geo-tubes, etc. For example, the coastal protection
method used in India is the construction of the Rubble mound Seawall. Furthermore,
8
groynes and detached seawall have been used in some areas. In addition, artificial
beach nourishment is also adequate.
More flexible solutions such as
using
beach
nourishment
or
underground breakwaters have also
been effective in tourist and resort
areas worldwide.
Currently, the combination of
hard and soft options has become more
popular recently for optimum results
because they have weaknesses when
(Source: [36])
Figure 1. 3: Headland type concrete
structures to protect the coastal area from
erosion in Ibaraki, Japan
used separately.
1.8.3.2. Adaption measures in Vietnam
Over the years, under climate change and sea-level rise, river erosion and coastal
erosion have become more complicated. As a result, with an increasing trend in both
scope and intensity, threatening people's livelihood, infrastructure, and coastal areas,
negatively affecting socio-economic development.
Many prestigious Vietnamese research institutions such as the Institute of
Geography, the Institute of Science and Technology of Irrigation, the Institute of
Oceanography, Nha Trang have been studying coastal erosion prevention following
independent state-level projects or research projects of each locality [37].
According to the state-level project KT.03.14 (N.T.Nga et al., 1995), many
structural solutions to prevent coastal erosion have been proposed (Please see Table
1.2).
Table 1. 2: Structural solutions to prevent coastal erosion.
(Source: KT.03.14)
No
Location
1
Hai Phong
Type of measure
Groins+ beach nourishment
Proposed by
Hai Phong Oceanography
9
No
Location
Type of measure
2
Nam Dinh
T-groins
3
Quang Binh
Groins + beach nourishment
4
Binh Thuan
Groins + Breakwater
5
Tien Giang
Dike + Protective Forest
Proposed by
Sub-Institute
Institute of Water
Resources
Institute of Water
Resources
Nha Trang Institute of
Oceanography
Southern Institute of
Irrigation Science
Every year, Vietnam invests trillions of VND in building anti-erosion works.
However, these works are almost traditional solutions, favouring roof embankments.
Embankment construction materials include stone, brick masonry, simple concrete
slabs, or more modern geo tube technology. However, despite their high cost, these
erosion control methods have not been effective against erosion so far.
The experience of preventing coastal erosion and accretion in countries worldwide
and Vietnam have shown that avoiding coastal erosion and accretion is highly
complicated, requiring synchronous and comprehensive solutions. Solutions from
macro to micro scale, using structural and non-structural solutions for each specific
period.
The solutions at the macro level lie in the content of regional management and the
master plan for socio-economic development; The structural solutions should be
studied based on the integrated and interdisciplinary forecast of coastal erosion in 20,
30, or 50 years under the impact of climate change.
1.8.3.3. Adaption measures in Central Vietnam
The Central Coast region, due to its topographical characteristics, is a place
subject to many natural disasters such as storms, floods, droughts, riverbank erosion,
coastal erosion, etc. Especially, coastal erosion in recent times is complicated, causing
much damage. Moreover, upstream exploitation of river basins also contributes to the
problem. Therefore, the protection and prevention of coastal erosion here are
becoming an urgent requirement in Vietnam promoting socio-economic development
10
in the coastal strip. Erosion still occurs in the central coastal zone of Viet Nam and
preventive measures such as sea dykes, revetments, and tree plantations have been
implemented in many coastal areas
According to scientific reports on coastal erosion, the Central Coast of Vietnam
has 397 eroded sections with a total length of over 920 km, of which erosion occurs in
233 areas with a total distance of up to 492 km. Particularly, Quang Nam province has
20 erosion sections of nearly 19 km; Quang Ngai province has 27 sections over 35 km;
Binh Dinh has 33 sections of almost 34 km; and Phu Yen province has 25 areas 21 km
of erosion [37]. As a result, localities heavily affected by erosion have been rushing to
find solutions to this problem.
Take Cua Dai as an example; a decade has passed since the first appearance of
coastal erosion in Cua Dai beach. Until now, Cua Dai beach has eroded about 160
meters inland. The erosion rate from 2014 slowed down, but the situation has not
improved much, although the capital from the budget alone has poured into "rescuing"
the coast of more than 250 billion VND. Many efforts and synchronous solutions have
been deployed but have not been effective (Please see Table 1.3); the beach is still
necrotic and disappearing day by day.
Structure
Investment
Evaluation
Table 1. 3: Anti-erosion solutions of Cua Dai beach
Embankment
Geotube
Sea wall
State
Effective
State
Ineffective
Private
Effective
Sandbag
Household
Ineffective
(Source: Internet)
In Binh Thuan, the province has invested in many coastal protection works such as
rock-fill embankment (Phu Hai coastal area), sandbag embankment (I or T shape) in
Ham Tien‟s tourist area, etc. The construction works have brought many practical
effects, such as preventing erosion and ensuring a beautiful landscape.
11
(Source: Internet, Google Earth)
Figure 1. 4: Embankment in Phan Thiet beach
In Phu Yen province, anti-erosion works have proved effective. From figure 1.5,
in March 2015, the distance from point 1 to the edge of the shoreline was about 45.8m.
In 2016, Phu Yen provincial government began to build the first T-groins. Distance
from point 1 to point 2 in March 2016 was 78.3m. After four years, in 2020, the coast
has been filled with sand, at a speed of about 32m/5yrs. From that success, in 2019,
more T-groins and breakwaters continue to be built for other areas.
(Source: Google Earth)
Figure 1. 5: T-groins and break water in Ro hamlet, Phu Yen province
1.8.3.4. Adaption measures in Binh Dinh province
The whole province of Binh Dinh has about 134 km of coastline. Along the coast
of Binh Dinh exist estuaries such as: Tam Quan estuary, An Du estuary, Ha Ra
estuary, De Gi estuary and Quy Nhon estuary.
Regarding structural constructions, currently, Binh Dinh has four sea dike
systems: Tam Quan (6 km), De Gi (16.9 km), Hoai Huong - Hoai My (4.5 km), and
East (47 km). However, the existing dyke system could withstand storms class 7÷8
when there is no high tide [38]. Therefore, when extreme weather events occur,
especially massive storms, these structures are not strong enough to withstand.
12
(Source: Internet)
Figure 1. 6: Tam Quan embankment was broken in 2019
According to Binh Dinh Department of
Agriculture and Rural Development, from
November to January 2017, due to the
influence
of
the
Northeast
monsoon
combined with high tides, the coast of De
Gi (An Quang Dong village) eroded. As a
result, the sea invaded about 30-70m
inland, extending from the base of the De
Gi welding torch to the South about 500m;
(Source: Internet)
Figure 1. 7: Casuarina trees along the
coast in An Quang Dong village, Cat
Khanh commune, was uprooted in 2017
then, from February to April, the accretion
returned [38].
To ensure the stability of the coast, the construction of embankment protection
requires a large amount of money. Therefore, the solution of planting casuarinas with
denser density to prevent erosion is implemented instead.
Regarding non-structural solutions, Binh Dinh Department of Natural Resources
and Environment (DONRE) in 2018 issued a draft list of areas that must establish a
coastal protection corridor in Binh Dinh province. The De Gi shoreline segment (near
De Gi fishing port) is considered the most severe erosion risk in the Phu Cat coastal
area.
On January 25, 2019, Binh Dinh Provincial People's Committee issued Decision
No. 296/QD-UBND approving the list of areas where the coastal protection corridor of
Binh Dinh province must be established [39]. According to this decision, the total
13
length of the protected area is 100,817 m, with 43 sections in 28 communes and wards
in the districts of Hoai Nhon, Phu My, Phu Cat, Tuy Phuoc, and Quy Nhon city.
Shortly after, Binh Dinh province issued Decision No. 4383/QD-UBND dated
November 2019 on approving the width and boundaries of the coastal protection
corridor of Binh Dinh province [40], to detailed Decision No. 296/QD-UBND above.
1.9. Site descriptions
1.9.1. Location and natural conditions
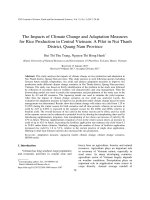
1.9.1.1. Geographical location
According to the website of Phu Cat district [41], Phu Cat is a coastal plain district
of Binh Dinh province, located on 13o54'N- 14o32'N and 108o55'E- 109o05'E.
-
The North and the Northwest border Phu My district and Hoai An district.
-
The South borders An Nhon town.
-
The West and the Southwest border the districts of Vinh Thanh and Tay Son.
-
The East borders the East Sea with a length of 35 km.
-
The Southeast borders Tuy Phuoc district and Quy Nhon city.
Figure 1. 8: Location map of the study area
The Phu Cat coastal strip is about 30 kilometres in length, stretches through 5
communes Cat Khanh, Cat Thanh, Cat Hai, Cat Tien and Cat Chanh.
Phu Cat district has a pretty favourable position for economic development
associated with benefits from the sea.
14