Willingness to pay for green electricity in vietnam
Bạn đang xem bản rút gọn của tài liệu. Xem và tải ngay bản đầy đủ của tài liệu tại đây (1.1 MB, 47 trang )
VIETNAM NATIONAL UNIVERSITY, HANOI
VIETNAM JAPAN UNIVERSITY
DO THAO NGAN
WILLINGNESS TO PAY FOR GREEN
ELECTRICITY IN VIETNAM
MASTER'S THESIS
…………………………….
VIETNAM NATIONAL UNIVERSITY, HANOI
VIETNAM JAPAN UNIVERSITY
DO THAO NGAN
WILLINGNESS TO PAY FOR GREEN
ELECTRICITY IN VIETNAM
MAJOR: PUBLIC POLICY
CODE: 8340402.01
RESEARCH SUPERVISOR:
PhD. VU HOANG LINH
Hanoi, 2021
ACKNOWLEDGEMENT
I want to express my deepest thanks of gratitude to my respectable supervisor,
Dr. Vu Hoang Linh, for his friendly and sympathetic assistance and dedicated
involvement throughout the process of this thesis. With profound knowledge and
experience, he helped me improve and finish my research.
I especially owe many thanks to my lectures in the MPP program: Dr.Vu
Hoang Linh; Dr. Nguyen Thuy Anh; Assoc. Prof. Phung Duc Tuan; Dr. Dang Quang
Vinh, Prof. Okamoto Naohisa, Pro. Kawashima Hiroichi for their invaluable guidance
and continuous encouragement. Their generous assistance and meaningful suggestions
helped me study, research, and prepare for my master's thesis. It was my honor to
work with my supervisor and my program lectures. I have highly appreciated their
wisdom, patience, and continuous support during my thesis preparation. Without the
helpful discussion and the enormous support of my lectures, it would have been
difficult for me to complete my research. Further, I would like to thank Ms. Pham Lan
Huong (Program Assistant) for the best support during my study and thesis preparation.
I also express my deep appreciation to the respondents who agreed to be
answered my survey. Without their support and essential and valuable information, I
could hardly have completed my research.
Last but not least, I express warm and sincere thanks to my beloved family that
supports and encouraged me to finish my thesis.
TABLE OF CONTENTS
LIST OF TABLE ................................................................................................................. ii
LIST OF FIGURE .............................................................................................................. iii
LIST OF ABBREVIATIONS ............................................................................................ iv
CHAPTER I: INTRODUCTION ........................................................................................ 1
1.1
Research Background .......................................................................................1
1.2
Problem Statement ............................................................................................3
1.3
Purpose of the study..........................................................................................3
1.4
Research Questions ...........................................................................................3
1.5
Research Method ..............................................................................................4
1.6
Limitation of the study......................................................................................4
1.7
Structure and overview of the thesis .................................................................4
CHAPTER II: LITERATURE REVIEW AND THE THEORETICAL FRAMEWORK.. 6
2.1
Method to mesure the WTP ..............................................................................7
2.2
Mean value and factors affecting WTP for green electricity............................9
2.3
Researchs about WTP in Vietnam ..................................................................10
CHAPTER III: THE SITUATION OF RENEWABLE RESOURCES IN OTHER
COUNTRIES AND VIETNAM........................................................................................ 12
3.1
Overview .........................................................................................................12
3.2
European energy policies ................................................................................14
3.3
Asian energy policies ......................................................................................16
3.4
Vietnam energy policies .................................................................................17
CHAPTER IV: METHODOLOGY .................................................................................. 20
4.1
Measurement method......................................................................................20
4.2
Survey Design .................................................................................................20
4.3
Estimation technique ......................................................................................24
CHAPTER V: FINDING AND DISCUSION .................................................................. 26
CHAPTER VI: CONCLUSION AND POLICY IMPLICATION.................................... 32
REFERENCES .................................................................................................................. 35
APPENDIX ....................................................................................................................... 39
i
LIST OF TABLE
Table 2.1: Classification Table of WTP methods ................................................................ 7
Table 3.1: Production of renewable energy in the period 2007 – 2017 ............................. 18
Table 4.1: Summary table of review of WTP for green electricity literature .................... 21
Table 5.1: Distribution of responses by bid amount .......................................................... 26
Table 5.2: Variables Descriptive Statistics ......................................................................... 26
Table 5.3: Regression result ............................................................................................... 29
Table 5.4: Logarit Model Result ........................................................................................ 30
ii
LIST OF FIGURE
Figure 3.1: World electricity generation mix by fuel, 1971-2018...................................... 12
Figure 3.2: CO2 emissions by energy source, World 1990-2018 ...................................... 13
Figure 3.3:Structure of primary energy supply in Vietnam ............................................... 18
Figure 4.1: The double bounded – Dichotomous Choices Model ...................................... 23
Figure 5.1: Money Saving for WTP ................................................................................... 28
iii
LIST OF ABBREVIATIONS
CVM
DB
DBDC
Contingent Valuation Method
Double Bounded
Single Bounded - Double Bounded
DC
Dichotomous Choice
DCs
Dichotomous Choices
EC
Euroupean Commission
GE
Green Electricity
GHG
Greenhouse Gas
IEA
International Energy Agency
MLR
Multiple Linear Regression
RE
Renewable Energy
RS
Renewable Resources
SB
Single Bounded
WTP
Willingness to pay
iv
CHAPTER I: INTRODUCTION
1.1 Research Background
In recent years, the world has faced climate change, which seriously affects
human health. The concept of sustainable development was first appeared and
mentioned in the report of the UN World Commission on Environment and
Development in 1987 (WCED, 1987), and then, it has become the essential goal for
national development orientation. In particular, energy resources are one of them.
Energy supply is necessary for human life and economies for lighting, transport,
internet, etc., and its purchasing accounts for 5 to 10% of GNP in developed countries
(Twidell & Weir, 2015). Fossil fuel is one of the main sources of energy used,
especially in developing countries. However, it is the factor that causes rising
greenhouse gas emissions and becomes a challenge in sustainable development.
Besides, the energy demand has increased dramatically due to economic growth and
population growth, while natural resources are limited. Therefore, there is necessary
for a drastic transformation, distribution, and use of energy towards reducing
emissions into the environment and sustainable resources. The opposite of fossil fuels
is renewable energy, which can restore themselves quickly and unlimited in particular
solar, thermal, photovoltaic, bioenergy, hydro, tidal, wind, wave, and geothermal
(Boyle, 2004).
Green electricity, generated from renewable energy sources, can be viewed as
an environmental public good and provided by the private sector. According to
Menges et al. (2005), green electricity options help to reduce the demand for fossil
fuels, reduce pollution and greenhouse gas emissions, and become a public benefit.
However, because the cost of investment in infrastructure to produce electricity using
renewable energy is very high, its price is usually higher than fossil fuels. Therefore,
some policy mechanisms have been designed in different countries to support green
electricity. One of them is voluntary purchases, which require well-educated
consumers willing to foster green energy with their assets. This amount is called
willingness to pay for green goods to improve the environment and ensure their
stability in the future. WTP is becoming more and more popular and widely studied in
1
all countries. Determining the customer's willingness to pay helps companies and
governments develop an appropriate product pricing mechanism to stimulate customer
consumption.
In Vietnam, the Ministry of Industry and Trade forecasts that demand for
electricity in economic development from 2021 - 2025 will still grow at a high rate of
8.5% per year (Thao, 2020). However, energy is mainly dependent on imported fuels
of coal, gas, and liquefied gas. Besides, because the impacts of climate change lead to
drought, the hydropower reservoir lacks water for production. Therefore, the
development of renewable energy sources is an inevitable and necessary trend in the
development of Vietnam. The Resolution No.55-NQ/TW of The Politburo about
National energy development strategy has set out, "Prioritize the exploitation,
thorough and efficient use of renewable energy, new energy, and clean energy." The
period of 2013 - 2019 marks the rapid development of renewable energy sources in
Vietnam. According to the EVN report (2019), the average annual total power
capacity increases by 10.6%. Specifically, the renewable energy source increases at
the rate of 31.4%/year, wind power at the rate of 42%/year, biomass 54.5%/year, and
especially solar power increased 53 times, from 86 MW to over 4,600 MW. Although
the growth rate of renewable energy is relatively high, its ability to supply electricity
to the national grid only accounts for 7.16%, and the largest source of energy is still
coal-fired with 38.12%. On the other hand, the Government has a privatization
strategy for the power sector, which also opens great opportunities and challenges for
using renewable energy. After many years of monopolization by state-owned
enterprises, the private sector is officially allowed to participate in all areas of the
electricity industry. Specifically, more and more renewable energy projects have been
approved and built, which is the first step in privatizing the electricity sector in
Vietnam. If WTP and influencing factors are focused on measurement and research, it
will help the government or businesses have long-term strategies to promote green
electricity. Moreover, according to the Resolution No. 55, the roadmap for the
implementation of a competitive electricity market; mechanism of electricity sale
contracts between producers and consumers; The bidding and auction mechanism for
energy supply is appropriate, which should be accelerated, especially in renewable
energy investment projects, and the electricity purchase price must be transparent.
2
1.2 Problem Statement
This thesis assumes that if the power sector in Vietnam is privatized, there will
be competition between suppliers of green electricity and suppliers of fossil electricity
or nuclear electricity. It can be seen clearly that the green electricity supplier will be
disadvantaged in terms of price. Because there are some costs and benefits with no
monetary value, it is not easy to assess them accurately. Then these additional
production costs are often charged to the end-user of electricity, that is, households
(Kowalska-Pyzalska, 2019). On the other hand, customers tend to choose the lower
prices for the same product so that the need for fossil electricity will be increased until
it is exhausted. There is increasing concern that the emission of fossil fuels will make
the climate change situation more severe. About two-thirds of greenhouse gas
emissions are generated from burning fossil fuels for heating, electricity, transport, and
industry (European Environment Agency, 2021). It is believed that by expanding
environmental protection campaigns and disseminating information about sustainable
development, more and more people are willing to pay a certain amount for green
products. According to Nielsen (2017), up to 80% of Vietnamese consumers are
willing to pay more to buy products with environmentally friendly materials. However,
different consumers will lead to different levels of payment. Therefore, it is necessary
to investigate the willingness to pay (WTP) level for green power among different
households to develop preferential policies and set reasonable prices.
1.3 Purpose of the study
This paper aims to examine the WTP per month for Green Electricity in
Vietnam, and the focus objectives will be household. Some different elements are
mentioned to analyze which effect on WTP and customers' behavior on choosing GE.
Then some recommendations are given to increase GE user rates and raise WTP value.
1.4 Research Questions
The research focuses on answering the following questions:
Question 1: How much is the Vietnamese people’s willingness to pay for green
electricity?
3
Question 2: Which factors influence willingnes to pay for green electricity in
Vietnam?
Question 3: How to change household behavior to support green electricity?
1.5 Research Method
The online survey was used with 241 observations in Vietnam to identify the
household's WTP for GE. The respondents were asked to answer a survey including
three parts to assume that the electricity market will be privatized. The first part is
general background information about green electricity, environmental pollution, the
trustfulness of the policies aiming to improve the environment, and the proportion of
clean energy. The second part mentions questions on the monthly WTP for the use of
green electricity. The final part is household information: gender, age, education,
number of family members, family income, and expenses. A Regression Model was
used to analyze the factorial effect on WTP and the behavior of choosing GE.
1.6 Limitation of the study
The determination of WTP and factors affecting it helps readers understand the
current green electricity market in Vietnam. However, this thesis also has some
limitations, as below.
The survey was collected in May of 2021, the first month of summer in
northern Vietnam. Therefore, electricity consumption in this month is expected not as
high as in the middle of summer or as low as in autumn and winter, so that it may
affect the respondent's average electricity bill response.
In addition, the sample size of 241 is not large enough to represent the entire
country. Moreover, due to the outbreak of the covid pandemic, only online surveys
were used, leading to unable to reach those who do not use social networks.
1.7 Structure and overview of the thesis
The rest of this thesis is organized as followed.
Chapter II. Literature Reviews and Theoretical Framework. This chapter
focuses on reviewing related studies such as WTP for green electricity and factors
4
affecting it in other countries, WTP for other fields in Vietnam, methods used to
measure WTP, etc.
Chapter III. The situation of renewable resources in other countries and
Vietnam. Status of renewable energy from sources and their emission status in other
countries and Vietnam.
Chapter IV. Research Methodology. Describe in detail the WTP measurement
method and influencing variables.
Chapter V. Finding. Determine WTP and elements effect on it.
Chapter VI. Conclusion and policy implication. Summarize the content and
results of the previous chapters and recommend policy.
5
CHAPTER II: LITERATURE REVIEW AND THE THEORETICAL
FRAMEWORK
Climate Change is rapidly becoming the leading cause affecting the natural
environment, ecosystems and especially human life. Reducing the greenhouse effect is
more urgent than ever. According to the United Nations' Intergovernmental Panel on
Climate Change mentioned in the third assessment report (2001), renewable energy
solutions and energy-efficient technologies will reduce CO2 emissions. Realizing the
importance of that necessary transformation, countries focus on promoting the
formulation and development of appropriate alternative energy development policies.
Although RE is no longer a new field, in developing countries, where environmental
problems face obstacles due to technology and cost, the transition to RE is difficult.
Renewable Energy has become an attractive field for researchers, especially in
developing countries.
Green electricity is generated from renewable energy, represents renewable
energy resources and technologies that best benefit the environment. The U.S.
Voluntary Market has defined green electricity as produced by renewable energy
sources such as solar, wind, hydroelectricity, etc. These are energy sources from
natural sources or continuously replenishing processes. It was preferred and selected
for use because of its zero emissions and reduced negative impact on the greenhouse
effect (EPA, 2020).
Willingness to pay (WTP) is a tool for buyers to express their environmental
products and services preferences. The more people are willing to pay for
environmental goods, the stronger their preference is. Thus, WTP is the "marginal
benefits" that buyers expect from providing that additional service (Gabriela Scheufele
and Jeff Bennett, 2019). According to Chris Park's definition in "A Dictionary of
Environment and Conservation," the Willingness to pay is the amount an individual is
willing to pay to acquire a particular good or service. It is usually expressed in a
specific amount or a price range. Although potential customers may be willing to pay
less than this threshold, they will not pay a higher price in most cases.
6
2.1 Method to mesure the WTP
In terms of economic theory, green electricity was considered an impure public
good, created by the general production of private goods and public goods about the
environment, becoming unique and cannot replace (Kotchen, 2006). More specifically,
the electricity consumption of individuals for green electricity is a benefit for private
interests, and it is for the public is to reduce the level of CO2 to affect the environment.
People choose to contribute to privately providing public goods because of altruism in
private expenditure, according to "classical" economic literature. Significantly, many
types of altruism were linked to the provision of public goods, including renewable
resources (Oerlemans et al., 2016). Customers using green electricity will voluntarily
pay an additional cost to produce renewable energy; this increase is the consumer
WTP. More specifically, WTP is the amount of money that individuals are ready to
pay to prevent particular environmental harm, accomplish a specified increase in
environmental quality, or get a supply of specific public goods. WTP measurement
methods differed primarily in whether they directly or indirectly assessed WTP and
whether they determined the consumer's presumed or actual WTP (Miller et al., 2011).
Table 2.1 provides a detailed classification of the methods used to measure WTP.
Table 2.1: Classification Table of WTP methods
Alternative Methods For Determining WTP
Purchase Context
Actual WTP
Direct Measurement
Market Transactions
Indirect Measurement
Incentive-Align Surveys
Experimental Auctions
Hypothetical WTP
Contingent Valuation
Conjoint (De compositional)
• Self-Explicated Tasks (Compositional)
• Adaptive and Hybrid Conjoint
(Mixed)
However, the three most popular methodological approaches will be mentioned
below and have been developed to measure willingness to pay, including the
contingent valuation method (CVM), experimental auction, and conjoint analysis
(Klaus G. Grunert et al., 2009). The experimental auction method can provide valuable
insight into selling the item for a fair price when the vendor is uncertain about the
7
customer's valuation. There are two ways to determine bids. The first is that the
auction is sealed, and the second-highest bid determines the purchase price. The
second is that the participant simultaneously submits a preferential price to purchase a
good. The selling price is drawn randomly from the price distribution. Those who bid
higher than the sale price will receive the product for just the sale price amount.
Experimental auctions are useful for learning about customer ratings of items or
brands and may be used to disclose consumer values in order to assist positive future
price decisions. The WTP for various items is also determined using this method by
analyzing purchase behavior. Products and pricing easily accommodate the
participants’ concerns in an experiment by making the required price modifications.
Depending on the arrangement, participants were compensated for their participation
in an experiment, which might result in biased estimates and outliers (Voelckner,
2006). The practical disadvantages associated with experimental auction are the costs
involved and the time required making them less suitable for many practical
application scenarios (Christoph Breidert et al., 2006). Conjoint analysis, on the other
hand, is a technique for evaluating people’ preference structures through systematic
changes of product characteristics in an experimental design. Respondents were shown
numerous product profiles, including perceived product characteristics, and were
asked to categorize them based on their perceived preferences (Wind & Green, 2004).
Specifically, they are asked to rate or evaluate a number of two or more product
attributes. In some cases, it can result in a rather complex structure due to the many
attributes that describe the goods being compared. Each respondent will have their
own set of choices. This process helps to build reasonable preferences and value for
the goods. This method has a decisive advantage in the flexibility to include new
product and price combinations. Not only that, but it is also very effective in
estimating the individual level. However, in conjoint research, interactions between
price and other factors are extremely likely to occur, resulting in a violation of the
compensatory model. There are major implications when the price is introduced as an
attribute, such as the price effect, range impact, and number-of-level impact.
Furthermore, when more than two price levels were employed, there might be
problems computing the interpolation heuristics between usefulness and price
(Michael Hahsler and Thomas Reutterer, 2015).
8
Ultimately, because of its high flexibility and applicability, CVM has gained
popularity since its introduction by Ciriacy-Wantrup (1947). Specifically, in a
hypothetical market created for a non-market good, respondents are asked how much
they are willing to pay for that good. On the other hand, the results of the WTP survey
are also influenced by the elicitation technique in its implementation. Oerlemans et al.
(2016) measured WTP for electricity supplied from renewable energy sources using a
sample of 57 research articles on potential pricing applications (green electricity). The
results show that the most frequent techniques are open-ended (OE) and dichotomous
choice (DC) approaches, resulting in different levels of WTP.
2.2 Mean value and factors affecting WTP for green electricity
There have been many research papers to find the suitable households price for
green electricity, besides analyzing the factors affecting the level of payment and the
behaviour of choosing them. Then, they give appropriate solutions to improve the rate
of renewable energy selection. The results show that differences in political
institutions, policies, cultures and societies, etc., lead to differences in WTP between
countries. For instance, Hansla et al. (2008) pointed out that the WTP of Swedish
household consumers for green electricity was influenced by the attitude towards
green electricity and electricity costs. More specifically, it increased with a positive
attitude and decreased with higher prices. Using the OLS model and the result of a
mail survey of 855 Swedish household, the author showed that 81.5% and 66% were
willing to pay at least 0.015 USD and 0.02 USD per kWh of green electricity,
respectively. Moreover, the attitude towards green electricity was related to the
perception of environmental consequences for oneself, others, the biosphere, anxieties
about these repercussions, and self-transcendent value types (It was the realiation that
people were one small part of a environment protection, and acting accordingly). The
researcher assumes that the paper mentions all green power sources, which gives
consumers more choice and can express appropriate preferences. Meanwhile, Nomura
and Akai (2004) provided in-depth analysis by the contingent valuation method
(CVM) of the Japanese households WTP in the form of a flat monthly surcharge. The
result was that the median value was counted at about 2000 yen (about 17 USD) per
household per month. On the other hand, to determine the value of renewable energy
electricity and obtain information on consumer preferences, Guo et al. (2014) used the
9
contingent valuation method (CVM) to estimate Beijing households’ WTP for
renewable electricity and identify factors that influence their WTP. The survey
randomly selected 700 participants, and the results showed that they were willing to
pay more about 2.7–3.3 USD per month for renewable resources. Factors such as
income, electricity consumption, prices, means of payment, knowledge and a positive
attitude towards renewable energy all influence WTP of respondents. Xie et al. (2018)
utilized a multivariate regression model to find variables that substantially impacted
WTP while considering the effects of the high frequency of respiratory illness. As a
result, knowledge of renewable energy, confidence in the government, behavior,
education, history of respiratory disease, and other elements were necessary for a
favorable WTP. However, while income factors, beliefs, and illnesses positively
affected WTP, gender and age negatively affected it. In addition, with a sample
number of 468 respondents, the average WTP value of people was 4.8 USD per month.
2.3 Researchs about WTP in Vietnam
The renewable energy has appeared in Vietnam for a long time. However, due
to the characteristics of the exclusive electricity industry, there haven’t had any study
about WTP for the green electricity. On the other hand, the WTP has become a
familiar tool for researchers to analyze and handle more urgent issues. Ngai N.V et al.
(2012) showed that seven factors that impacted the WTP for clean water supply in Cao
Lanh City, Dong Thap province were education, household size, total income, water
sources, environmental awareness, address, number of labour. From the research
results, the researcher suggested several policies such as: adjusting the price of clean
water to differentiate between urban and rural areas, raising people's awareness of the
environment through propaganda and education; raise the education level of the
people; combine agencies and sectors to reduce the rate of poor households; create
more jobs for people to increase the number of people working in the family. Another
study on the mangrove ecosystem issue of Cat Ba Islands conservation area, which the
UNESCO has recognized as a biosphere reserve from 2004, was heavily degraded due
to a partial switch to shrimp farming. Tien Dat Pham et al. (2018) examined factors
affecting the WTP to restore mangrove forests. The researcher used random valuation
methods to estimate household WTP, and as a result, the average WTP was estimated
at 192,780 VND (8.64 USD). WTP was also affected by characteristics such as gender,
10
academic level, employment, respondents' engagement in mangrove restoration
operations, and the consequences of climate change. Since then, they proposed that
Hai Phong city authorities needed to implement the necessary policies to preserve
mangrove forests of the biosphere reserve. Besides, WTP is also used to handle both
public health problems. Van Minh et al. (2012) showed that 62% of households ready
to pay to build a discharge toilet bathtub, and the WTP with medium and median
values was VND 15.6 million (780 USD) and VND 13 million (650 USD),
respectively. In particular, the correlations to the proportion of WTP were gender, age,
economic conditions of households, existing toilets, the level of satisfaction with
toilets and knowledge of the health effects of poor sanitation. Moreover, the
geographical location and economic status of households were two significant
determinants in the amount of WTP.
In summary, Vietnam is in the process of privatizing the power sector, and
there is no research paper on households WTP and factors that influence WTP for
green electricity. Therefore, this paper attempts to estimate the WTP of Vietnamese
households for green electricity by using the CVM method and examining factors that
affect WTP by multiple linear regression models.
11
CHAPTER III: THE SITUATION OF RENEWABLE RESOURCES IN
OTHER COUNTRIES AND VIETNAM
3.1 Overview
Electricity is at the center of modern economies and has an increasing share of
supply in energy services. One of the main reasons that worldwide CO2 emissions
from the power industry reached new highs in 2018 was rising electricity consumption.
However, a range of low-emission technologies' commercial availability also puts
electricity at the forefront of efforts to combat climate change and pollution. In
particular, renewable energy plays an essential role in providing electricity access.
%
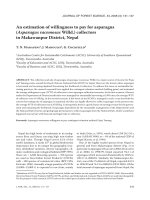
Figure 3.1: World electricity generation mix by fuel, 1971-2018
Sources: IEA, World electricity generation mix by fuel, 1971-2018
The figure 3.1 shows the consumption of different energy sources in the world
by energy source. It can be seen that from 1971 to 2018, there was an apparent change
in the proportion of electricity from renewables, nuclear, oil, natural gas. Meanwhile,
coal is still the most used source over the years, peaking in 2007 and accounting for
12
41.3% of the total generated electricity. Although since 2010, Governments have taken
more robust measures to promote sustainable development, the proportion is still high,
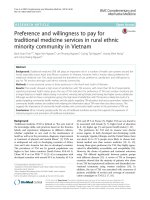
at 38.2%. It is the largest CO2 emitter among fuel sources and has increased over the
years, reaching nearly 15,000 Mt CO2 in 2018 (Figure 3.2). The share of renewable
energy increased from 19.9% to 25.6% in 2010 and 2018, respectively. It is not a rapid
increase because renewable energy is entirely focused on investment and development
by governments. Since 2014, the ratio of renewable energy has surpassed natural gas;
however, the reduction of this source is not much. In 2018, its consumption was
measured to be around 23.1%, only 2.5% less than renewable energy. Besides, it is
also one of the three causes of greenhouse gas emissions. In 2018, the measured
emissions were nearly 7,200 Mt CO2. Due to price instability and massive emissions,
the proportion of oil decreased sharply over the years. Its share was only 2.9% in 2018,
but its emissions are second, reaching around 11,500 Mt CO2. Finally, nuclear energy,
although not producing greenhouse gases, is not used much. It can be seen that the
period of preference for this source is the 90s, but it declined gradually since the 2000s.
By 2018, it only accounted for about 10.2%. It may be due to safety concerns in the
long-term use of nuclear energy.
Unit: Mt CO2
17500
15000
12500
10000
7500
5000
2500
0
1990
1995
2000
Coal
2005
Oil
Natural gas
2010
2015
2018
Other
Figure 3.2: CO2 emissions by energy source, World 1990-2018
Source: IEA, CO2 Emissions from Fuel Combustion
According to World Energy Outlook (IEA, World Energy Outlook, 2019), The
world's demand for all energy sources is rapidly rising. The price of fossil fuels is also
13
still lower than nuclear and renewable energy sources. It makes the fossil energy
resources in the world are being depleted because of exploitation for production.
Furthermore, environmental issues originating from the mining process have prompted
the promotion of renewable energy as a means of reducing pollution.
Awareness of sustainable energy, clean technology, and climate change was the
focus of discussion during the meeting on sustainable development (UN, 2017).
Global energy policy trends are related to efforts made by various countries, as well as
the influence of policies encouraging renewable energy activities. According to
Goldthau (2016),
energy policy reform requires information regarding energy
efficiency, energy resources, available infrastructure and technology, financial,
legislative, political, environmental, and climate change. Therefore, the energy policy
applied in Europe and Asia will be examined more closely for comparison and added
values.
3.2 European energy policies
Renewable energy has been growing internationally for a decade, and the EU
has always been a global leader in supporting renewable energy. Each EU nation is in
charge of promoting and administering its renewable energy resources (RES) and
energy mix programs. Despite the many obstacles that have arisen in terms of
technological maturity and availability, EU countries should immediately follow the
route of the European Commission's RE strategy (Hasanuzzaman et al., 2012).
Furthermore, the EU has established the Climate and Energy Package 2020, which
seeks to implement a 20% increase in renewable energy generation, a 20% decrease in
greenhouse gas (GHG) emissions, and a 20% increase in energy efficiency usage (EC,
2009).The EU development strategy updated package, which targets 27 percent of
RES generated for energy, is laying the foundation for the 2030 Agenda for
Sustainable Development (EC, 2015). It causes implementation problems for EU
nations, where government support in certain elements of incentives and pressures is
critical.
The Energy Union Strategy was established in 2015 with the objective of
providing EU members with competitive, sustainable, safe, and affordable energy. The
European Commission has highlighted five policy variables that can aid in the
14
implementation of the plan: energy efficiency, climate action, research, energy
security, and the European integrated energy market (EC, 2017). Additionally, most
EU nations' energy policy changes are regulated by the 2016 Paris agreement.
For example, Germany implemented the Renewable Energy Heat Act in 2011,
which applies to residential and residential buildings and existing buildings of public
authorities. The Act requires landowners to have an energy mix produced from RES to
supply heat for their particular structures, and it permits the use of solar thermal
systems, biomass (solid, liquid, or gas), and geothermal/environmental thermal energy.
The building's owner is allowed to choose the sort of RE they wants to employ. In
France, the government has proactively raised the price of a carbon (fossil fuel) tax
from 22 EUR/tCO2 (in 2016) to 100 EUR/tCO2 (in 2022). The governments of France
and the United Kingdom have also announced five-year plans to phase out petrol and
diesel automobiles from the roads by 2040 (UN, 2015).
Other European nations, including Finland, Sweden, Austria, and Denmark, are
among the top in terms of RES integration for power supply. Sweden's goal is to
become a carbon-neutral country by 2045. The RES for final energy consumption at
Findland achieved 38.7 % in 2014, exceeding the objective of 38% in 2020, and a new
target of 50% in 2020 was set. Although the Netherlands is famous for its wind power,
it is not used efficiently to generate electricity. According to a Eurostat analysis, the
Netherlands is lagging behind in the EU 20-20-20 mission, with a market share of RES
of just 6% until 2016 (Nur Iqtiyani Ilhama et al., 2020). The country's primary
renewable energy sources are biomass, wind, solar, and geothermal and thermal gas.
Aside from Germany, the Dutch government have actively pursued a variety of
policies and financial incentives to promote RES development in their respective
countries.
As a result, it is important to ensure the transparency and democratization of
policies developed to assess the impact of EU energy policy in order to foster trust and
motivate stakeholders to support the goals of EU energy policy. With a total of 30
nations in the EU, policy coordination is required. Each member has their own
national policy, which might cause issues with competition in energy markets among
EU members (Faure et al., 2017). Regardless of the member states' differing policies,
15
the policies to be developed should be coherent and serve the same purpose as the
EU's energy and climate package.
3.3 Asian energy policies
As a consequence of the rapid revolution in economic growth and industrial
development, Asia is presently seeing an increase in energy demand, with most
member nations increasing their energy consumption. For example, China has been
identified as the world's greatest energy user, followed by India due to increasing
energy consumption, with a 42 percent increase between 2000 and 2015 (Kumar Singh,
2013). Malaysia, Singapore, Indonesia, Vietnam, and South Korea are among the other
members seeing an increase in energy demand and consumption. Japan's energy
consumption declined slightly by 0.1% in 2017 as the country continued its efforts to
promote energy efficiency. However, the initiatives had little effect on Japanese
economic development on a macro level (Aoshima et al., 2017).
Primarily, Asia's energy policy objectives are similar to those of Europe.
Following the implementation of their planned energy policies, national governments
assume full responsibility for regulating their energy sector. For example, Indonesia
enacted the National Energy Plan as a government policy aimed at boosting renewable
energy use, energy mix, energy security, and energy access (IEA, 2014). Nevertheless,
it is clear that this strategy is less concerned with decreasing CO2 emissions, as the
country is anticipated to quadruple its usage of coal and gas. Another case in point is
the Korean government energy strategy. According to the action plan, renewable
energy must account for 11% of total energy supply (IEA, 2011). Therefore, the
preliminary decision on New and Renewable Energies made in April 2011 specifies
that RE should produce 10% of the total anticipated energy of public buildings
(Corporation, K. E. M, 2011).
Asia is experiencing tremendous economic development. Countries in this
continent also lead in greenhouse gas emissions. Reducing pollution on the energy
front requires careful study of environmental, social impacts and energy infrastructure
development. In particular, China has prioritized numerous emission-reduction
measures, including the revolutionary energy supply and consumption plan. The
Japanese concept of energy strategy may be extended to the majority of Asia Pacific
16
countries, where concerns such as energy security, efficiency, and environmental
soundness need to be closely monitored. The Asian Energy Policy Forum, held by
Korea (2017), is essential for a comprehensive debate on low-carbon technologies,
government duties and incentives, energy policy, and mitigation measures among
Asian and European countries.
3.4 Vietnam energy policies
The fast expansion and industrialization of Vietnam have had a negative
influence on the environment and natural resources. Over the last decade, electricity
consumption has risen, output is not enough for growing. During 2007 - 2017, energy
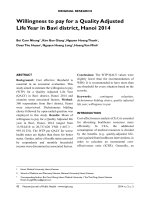
sources in Vietnam were diversified to ensure energy security (Nguyen, 2020). The
energy supply structure has changed positively, and non-commercial biomass energy
had decreased rapidly from 32.4% in 2007 to 11.4% in 2017 (Figure 3.3). On the other
hand, the supplies of primary energy with low cost is increased exploitation such as
hydroelectricity increased from 4.8% to 10.8%, and coal increased from 21.1% to
37.9%. However, the most used type of energy supply is still coal and oil, which cause
environmental pollution. Given the country's increasing reliance on fossil fuels, the
electricity sector accounts for roughly two-thirds of greenhouse gas emissions. There
is an urgent need to speed the transition to sustainable energy. Vietnam has emerged as
the world's fastest rising per-capita greenhouse gas emitter, with emissions increasing
at a rate of around 5% per year (The World Bank, 2021).
45.0%
40.0%
35.0%
30.0%
25.0%
20.0%
15.0%
10.0%
5.0%
0.0%
2007 2008 2009 2010 2011 2012 2013 2014 2015 2016 2017
Coal
Gas
Oil
Hydro & electricity*
RES**
17
*: Import and export electricity; **: Mainly non-commercial biomass primary energy
including biomass and a tiny part of the wind and solar energy
Source: Institute of Energy - Ministry of Industry and Trade
Figure 3.3:Structure of primary energy supply in Vietnam
In recent years, renewable energy in Vietnam has been achieved some results as
follows (Table 3.1). Hydroelectricity is the first type of renewable energy used in
Vietnam since 1946, and it develops rapidly, plays an essential role in the energy
industry. By the end of 2017, the capacity of hydropower sources reached nearly 7.431
thousand TOE, an increase of 3.7 times compared to 2007; power output from
hydroelectricity increased 3.83 times from 22,493 GWh to 85,940 GWh, accounting
for over 43.6% of electricity production in 2017. Wind power and biomass power
projects were developed much later than hydroelectricity, but they are also developing
quite rapidly with larger capacity; Total renewable energy accounted for 11.4% of
total commercial primary energy in 2017. In 2015, solar power plants were started
after the government issued Decision 2068/QD-TTg dated November 25, 2015, of the
Prime Minister approving Vietnam's renewable energy development strategy. From
the beginning of 2018, the first plants were completed, such as Thien Tan, Dau Tieng,
and they started to supply electricity to the national grid with a capacity of about 690
KWh/year/plants.
Table 3.1: Production of renewable energy in the period 2007 – 2017
Unit: Thousand TOE
RES
2007 2008 2009 2010 2011 2012 2013 2014 2015 2016 2017
Biomass
14.870 14.724 13.778 13.890 14.005 14.121 13.669 10.745 8.258 8.003 7.924
Hydroelectric 1.981 2.252 2.578 2.369 3.519 4.540 4.897 5.146 4.827 5.496 7.431
Wind
Total
10
17,3
33,0
16.851 16.976 16.357 16.259 17.524 18.661 18.566 15.891 13.094 13.517 15.387
Source: Institute of Energy - Ministry of Industry and Trade
In general, renewable energy is being focused and developed in Vietnam.
However, compared with many countries in the world, the above results are still too
small and have not brought into full play the available potential. Therefore, the
research and exploitation of renewable energy resources in the coming period will
18