Fabrication of layer-by-layer deposited films containing carbon nanotubes and poly(malachite green) as a sensor for simultaneous determination of ascorbic acid, epinephrine, and
Bạn đang xem bản rút gọn của tài liệu. Xem và tải ngay bản đầy đủ của tài liệu tại đây (680.43 KB, 15 trang )
Turkish Journal of Chemistry
/>
Research Article
Turk J Chem
(2013) 37: 36 – 50
ă ITAK
c TUB
doi:10.3906/kim-1112-54
Fabrication of layer-by-layer deposited films containing carbon nanotubes and
poly(malachite green) as a sensor for simultaneous determination of ascorbic acid,
epinephrine, and uric acid
1
Jahan Bakhsh RAOOF1,∗, Reza OJANI1 , Mehdi BAGHAYERI2
Electroanalytical Chemistry Research Laboratory, Department of Analytical Chemistry, Faculty of Chemistry,
University of Mazandaran, Babolsar, Iran
2
Departmant of Chemistry, Faculty of Science, Hakim Sabzevari University,
PO. Box 397, Sabzevar, Iran
Received: 26.12.2011
•
Accepted: 28.11.2012
•
Published Online: 24.01.2013
•
Printed: 25.02.2013
Abstract: A simple approach to constructing a double-layer voltammetric sensor is described. The poly(malachite green)
(PMG) and multiwalled carbon nanotubes (MWCNTs) were coimmobilized at the surface of the glassy carbon electrode
(GCE) for fabrication of PMG/MWCNT/GCE. The modified electrode was characterized by cyclic voltammetry (CV),
electrochemical impedance spectroscopy (EIS), differential pulse voltammetry (DPV), and chronoamperometric techniques. Using DPV, the obtained catalytic peak current was linearly dependent on the ascorbic acid (AA), epinephrine
(EP), and uric acid (UA) concentrations in the ranges of 0.4–100.0, 0.1–100.0, and 0.3–90.0 µ M, respectively. The resultant detection limits for AA, EP, and UA were 0.23, 0.0820, and 0.12 µ M, respectively. The modified electrode showed
good sensitivity, selectivity, and stability and was applied to the determination of AA, EP, and UA in real samples.
Key words: Sensor, poly(malachite green), epinephrine, multiwalled carbon nanotubes, voltammetry
1. Introduction
Nanotechnology is a rapidly expanding field of research devoted to the exciting properties of nanoscale material. 1
In recent years, nanomaterial has shown its potential in several fields such as drug delivery, 2 gene therapy, 3
biosensors, 4 bioimaging, 5 and diagnosis and therapy. 6 There are also a few successful applications of nanomaterials in the biomedical arena, including bacteria detection, 7 early detection of cancer, 8 detection of Alzheimer
disease, 9 protein fibrillation, 10 and bilayer reconstruction. 11
For 2 decades, carbon nanotubes (CNTs) have been widely studied as a material for fabrication of electronic devices, sensors, and biosensors due to unique structural and mechanical properties such as narrow
distribution size, high accessible surface area, and high electrical conductivity. 12 As electrode materials, multiwalled carbon nanotubes (MWCNTs) can be used for promoting electron transfer between the electroactive
species and the electrode. They provide a novel platform for designing electrochemical sensors. Conductive
polymers coated on nanostructured templates 13 have attracted substantial interest in nanomaterial science. 14
The interaction between CNTs and the polymeric matrices can be used as a strategy for development of unique
properties of CNTs and conductive polymers such as high aspect ratio and high surface area, 15 increasing the
∗ Correspondence:
36
RAOOF et al./Turk J Chem
ability of electron transfer and high accessibility of the analyte to the surface of the electrode. 16 A thin film of
conducting polymer, having both high conductivity and fine structure at the surface of a nanoscale material,
such as MWCNTs, which are suitable components for fabrication of biological sensors, can be used in determination of several analytes. 17 Shahrokhian and Asadian reported a GCE modified by a bilayer of MWCNT and
poly-pyrrole doped with tiron for the electrochemical determination of L-dopa in the presence of ascorbic acid
(AA), with a detection limit of 0.1 µM. 18
Epinephrine (EP), a component of neural transmission media, has an important effect on the transmission
in mammalian central nervous systems. This compound controls the nervous system in its performance of a series
of biological reactions and nervous chemical processes 19 Similar to other hormones, EP exhibits a suppressive
effect on the immune system and is thus used as a drug to treat cardiac arrest, as a bronchodilator for asthma,
and to treat sepsis. 20,21 Several techniques have been developed for determination of EP in pharmaceutical and
clinical samples. 22−25
In recent years, electrochemical analysis has been frequently used for the analysis of a wide variety
of important biological compounds due to its numerous advantages, such as higher sensitivity, selectivity,
reproducibility, and speed, and its low cost. 26 Unfortunately, oxidation of EP occurs along with the oxidation
of AA and uric acid (UA) in biological tissues at the surface of bare (unmodified) electrodes. 27,28 Thus, it is a
challenge to separate the oxidation peaks of AA, EP, and UA from each other in electrochemical analysis.
UA is the primary end product of purine metabolism. In a healthy human being, the typical concentration
of UA in urine is in the millimolar range (∼2 mM), whereas in blood it is in the micromolar range (120–
450 µM). 29,30 Abnormalities of UA level indicate symptoms of several diseases, such as gout, hyperuricemia
and Lesch–Nyhan syndrome. 31 AA is the agent that prevents scurvy and it is known to take part in several
biological reactions. Due to the presence of ascorbate in the mammalian brain, it plays an important role in
bioelectrochemistry, neurochemistry, and clinical diagnostics applications. It is also necessary for the formation
of collagen and has been used for prevention and treatment of common cold, scurvy, and cancer. 32
The chemical modifications of inert substrate electrodes with redox active thin films offer significant advantages in the design and development of electrochemical sensors. In operation, the redox active sites shuttle
electrons between solution analyte and the substrate electrodes, often with significant reduction in activation
overpotential. A further advantage of the chemically modified electrodes is their lower proneness to surface
fouling and oxide formation compared to inert substrate electrodes. 33 Numerous different materials were used
for modification of electrode surfaces, such as carbon nanotubes, 34 metal oxides, 35 conductive polymers, 36 and
inorganic catalysts. 37 Polymer-modified electrodes prepared by electropolymerization have received extensive
interest in the detection of analytes because of their high selectivity, sensitivity, and homogeneity in electrochemical deposition, and their strong adherence to electrode surfaces and the chemical stability of the films. 38
Lin et al. reported simultaneous determination of dopamine, AA, and UA using poly(Evans blue)-modified
GCE. 39 Milczarek and Ciszewski reported an electrode modification with polymeric film of 2,2-bis(3-amino-4hydroxyphenyl)hexafluoropropane and studied the electrocatalytic activities toward the oxidation of dopamine,
UA, and AA. 40
The present work describes the preparation of GCE modified with MWCNTs and poly(malachite green)
(PMG) films (PMG/MWCNT/GCE) to develop a sensor for simultaneous determination of EP, AA, and UA
in buffered solutions (pH 7.0). The ability of the modified electrode to determine AA, EP, and UA in chemical
and biological samples was examined.
37
RAOOF et al./Turk J Chem
2. Experimental
2.1. Chemicals and materials
AA, EP, and UA were obtained from Fluka. Solutions of AA, EP, and UA were prepared in double distilled water
prior to use. MWCNT particles (diameter: 20-50 nm, length: 5-20 µm) were purchased from Sigma. Phosphate
buffer solutions of 0.1 M for different pH values were prepared by mixing stock solutions of 0.1 M H 3 PO 4 ,
NaH 2 PO 4 , Na 2 HPO 4 , and Na 3 PO 4 . Potassium chloride from Fluka was used as the supporting electrolyte.
Potassium hexacyanoferrate(III) and sodium nitrate were obtained from Fluka. Malachite green (MG) was
obtained from Merck. The pharmaceutical and biological samples used in this work were obtained from Darou
Pakhsh Co., Tehran, Iran, and Dr. Safiri Medical Diagnostic Laboratory, Babolsar, Iran, respectively. The
solvent used for the electrochemical studies was double distilled water. All other regents were of analytical
grade.
2.2. Electrodes and apparatus
A µAutolab TYPE III potentiostat/galvanostat (Eco Chemie B.V., the Netherlands) with data acquisition
software made available by the manufacturer (GPES 4.9 version) was used for voltammetric measurements.
Electrochemical impedance spectroscopy (EIS) was performed using a potentiostat and galvanostat (Autolab,
model PGSTAT30, Eco Chemie B.V.) that were connected to a personal computer. A digital pH meter (Ion
Analyzer 250, Corning) was used to measure the pH of the buffered solutions. An Ag|AgCl|KCl (3M) electrode
and a platinum wire were used as reference and counter electrodes, respectively. The substrate of the working
electrode was a GCE (d = 1.8 mm) from Azar Electrode Co., Iran. All electrochemical studies were performed
at ambient temperature.
2.3. Functionalization of MWCNTs
Functionalization and solubilization are important aspects of the chemistry of CNTs and these chemical manipulations are essential for many of the applications. All carbon nanostructures are insoluble in most common
solvents. They need to be functionalized before they can be dispersed in solvents. Functionalization of nanostructures can involve covalent modification and noncovalent interaction, both leading to ways of solubilizing
them in polar, noncovalent polar, and aqueous media. The carboxylic functionality at defect sites has opened
up new possibilities of elegant and simple strategies to functionalize CNTs. 41,42 Smalley and coworkers reported
a purification method of CNTs in which the raw nanotube was oxidized with a mixture of H 2 SO 4 and HNO 3
(3:1) where the original CNTs with closed tips were transformed into shorter, open-ended nanotubes with carboxylic groups and carboxylic functionalized side walls. In our work, MWCNTs were chemically functionalized
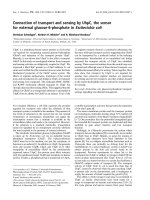
by ultrasonification in a mixture of sulfuric acid and nitric acid (3:1 v/v) for 8 h. 43,44 Functionalized MWCNTs were then washed with deionized water and separated by centrifuging 3 times. The carboxylic groups of
MWCNTs were confirmed by FT-IR with stretching bands of carboxylic acid groups at 1710 cm −1 (Figure
1). 45
2.4. Modification of the electrode surface
Prior to modification, the GCE was polished with sand papers and 0.05-µ m alumina slurries and then rinsed
with distilled water. After each polishing, the electrode was sonicated in ethanol for 4 min to remove any
adhesive substances from the electrode surface. The polished electrodes were electrochemically activated in 0.1
M H 2 SO 4 applying successive cycles of potential between –1.0 and 1.8 V vs. Ag|AgCl|KCl (3M).
38
RAOOF et al./Turk J Chem
%T
80
70
Hydroxyl
Carboxyl
60
1100
1500
1900
2300
2700
3100
3500
Wavenumber [cm–1]
Figure 1. FT-IR spectrum of functionalized MWCNTs in a mixture of sulfuric acid and nitric acid (3:1 v/v) for 8 h.
Fabrication of MWCNT-coated GCE (MWCNT/GCE) was carried out by dropping 5.0 µ L of black
solution of 0.1 mg mL −1 MWCNT in ethanol onto the surface of GCE and allowing the solvent to evaporate. Electropolymerization of MG on the GCE and MWCNT/GCE was carried out by 25 and 12 successive
potential sweeps between –1.4 and 1.8 V vs. Ag|AgCl|KCl (3M) at a scan rate of 100 mV s −1 in 10 mM
MG containing 0.5 M NaNO 3 and 0.025 M NaH 2 PO 4 -Na 2 HPO 4 (pH 6.0), for fabrication of PMG/GCE and
PMG/MWCNT/GCE, respectively. 46 After that, the prepared electrodes were carefully washed with double
distilled water to remove the loosely attached nonpolymerized MG monomer on the electrode surfaces, and they
were kept at room temperature for the next steps.
3. Results and discussion
3.1. Characteristics of the deposited film-modified electrode
The formation of PMG film on the electrode surface was accomplished by repetitive potential cycling described
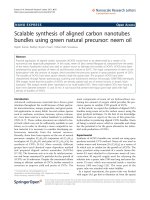
in the previous experimental section. Figure 2A shows typical cyclic voltammograms of PMG/GCE and
PMG/MWCNT/GCE in the 0.5 M NaNO 3 and 0.025 M NaH 2 PO 4 -Na 2 HPO 4 (pH 6.0) solutions. The
thickness of PMG films was altered by changing the potential cycle numbers. Throughout the studies we
used 12 cycles to deposit PMG film at the surface of MWCNT/GCE because thus prepared electrodes show
higher current response toward the electrocatalytic oxidation of EP than the films deposited by less or more
than 12 potential cycles (Figure 2B). A decreased peak current observed for lower cycle numbers (<12) resulted
probably because of a defective coverage of electrode surface by the modifier. In the case of a large number
of potential cycles (>12), however, a thicker film is obtained that leads to the slackness in electron transfer
between PMG film and electrode substrate. Therefore, a number of cycles equal to 12 was chosen as optimum
for the surface modification of MWCNT/GCE with PMG.
The amount of surface coverage ( Γ) on the electrode surface was determined from the charge (Q) under
the voltammetric peak for the redox process (between 0.0 to 0.50 V) using the following equation: 47
Γ = Q/nF A,
(1)
where F is Faraday’s constant, n is the number of electrons transferred per molecule of redox active species,
and A is the area of the electrode. Assuming the number of electrons involved in PMG redox reactions to be
39
RAOOF et al./Turk J Chem
(A)
I/µA
24
(B)
18
12
6
I /µA
0
c
3
8
13 18 23
Number of cycles
c
b
–0.3
0.15
0.6
b
a
–1.2
–0.4
0.4
E / V vs. Ag/AgCl/KCl (3M)
1.2
2
Figure 2. A) Cyclic voltammograms of GCE (a), PMG/GCE (b), and PMG/MWCNT/GCE (c) in the 0.5 M NaNO 3
and 0.025 M NaH 2 PO 4 -Na 2 HPO 4 (pH 6.0) solution. B) Influence of the number of cycles in formation of PMG at the
surface of MWCNT/GCE on the anodic current of EP (15.0 µ M). Measurements carried out in 0.1 M buffered phosphate
solution (pH 7.0) at scan rate of 25 mV s −1
2, the surface coverage at the PMG/MWCNT/GCE is estimated to be 4.0 × 10 −9 mol cm −2 ( n = 2), which
is about 6 times higher than that at the PMG/GCE ( Γ = 6.2 × 10 −10 mol cm −2 ) . These results indicate
that the MWCNT/GCE is much more favorable for the immobilization of PMG. Figure 3 shows the possible
mechanism for the immobilization of PMG at the surface of the modified electrode. The modified electrode
N+(CH3)2 2Cl–
Functionalized MWCNTs
C
N
N+(CH3)2 2Cl–
COO–
COO–
C
COO–
COO–
N+(CH3)2
Electrostatic interaction
Figure 3. Schematic representation of the proposed mechanism for electrodeposition of PMG at the surface of the
modified electrode.
40
RAOOF et al./Turk J Chem
exhibited a high stability in the anodic peak current whenever it was placed under ambient conditions in dry
state or in phosphate buffer (pH 7.0) for 1 month or longer, showing a good stability of the modified electrode.
3.2. The study of pH effect on the electrocatalytic oxidation of EP at the surface of
PMG/MWCNT/GCE
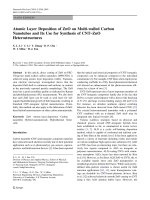
Since the electrochemical behavior of the studied compounds is pH-dependent, we investigated the oxidation
activity of AA, EP, and UA on the PMG/MWCNT/GCE in various phosphate buffered solutions (5.0 ≤ pH
≤ 9.0). Figures 4A–4C show the recorded cyclic voltammograms of EP in the solutions with pH values ranging
from 5.0 to 9.0. As can be seen, the anodic peak currents of EP reach a maximum value at pH 7.0 and then
decrease gradually with the increase of pH (Figure 4B). On the other hand, oxidation peak potential ( Ep ) of
EP decreases by increasing the pH value, clearly showing that protons are involved in the oxidation process.
The slope of Ep versus pH is –0.061 V/pH unit, which is very close to the anticipated Nernstian value (Figure
4C). Therefore, we can conclude that the number of protons is equal to the number of transferred electrons. 48 A
similar behavior was observed for AA and UA. Based on high peak current, pH 7.0 was selected as the working
pH for determination of these compounds.
E / V vs. AgAgCl (3M)
18
(A)
c
14
d
I / µA
e
0.3
y = –0.061x + 0.609
R2 = 0.994
0.2
0.1
0
(C)
4
6
pH
b
10
8
10
a
15
I / µA
6
(B)
11
7
2
4
6
8
10
pH
–2
–0.1
0.1
0.3
0.5
0.7
0.9
E / V vs. Ag/AgCl/KCl (3M)
Figure 4. A) Cyclic voltammograms of 6.0 µ M EP in 0.1 M phosphate buffer solution at different pH values, (a) 5.0,
(b) 6.0, (c) 7.0, (d) 8.0, and (e) 9.0, at surface of PMG/MWCNT/GCE, scan rate 50 mV s −1 . B) Plot of peak current
Ipa vs. pH values, with data obtained from (A). C) Influence of the pH of solution on the anodic peak potential of EP.
3.3. Cyclic voltammetric study of AA, EP, and UA
In the present study, preliminary experiments to elucidate the catalytic activity of the PMG/MWCNT/GCE
for AA, EP, and UA were performed using the cyclic voltammetry (CV) method. Figure 5 shows cyclic
voltammograms of 10.0 µ M AA (dashed line), 5.0 µM EP (solid line), and 4.0 µM UA (dotted line) in
0.1 M phosphate buffer (pH 7.0) on various working electrodes at the scan rate of 50 mV s −1 . It can be
41
RAOOF et al./Turk J Chem
seen that the AA, EP, and UA oxidation peaks at the bare GCE were weak and broad due to their similar
oxidation potentials (Figure 5A), while the response was improved at the MWCNT/GCE (Figure 5B) and
PMG/GCE (Figure 5C). It is demonstrated in Figures 5B and 5C that PMG and MWCNTs play a catalytic
role in enhancing the sensitivity of GCE for the determination of AA, EP, and UA. The best resolution of AA,
EP, and UA peak potentials for simultaneous determination of the mentioned compounds was obtained at the
surface of PMG/MWCNT/GCE. Moreover, the high oxidation current appeared at the surface of the modified
electrode, indicating that catalytic activity is greatly enhanced at the surface of PMG/MWCNT/GCE (Figure
5D).
12
AA
AA
EP
UA
6
EP
9
UA
I / µA
I / µA
6
2
3
0
–2
0.1
–3
0.3
0.5
0
0.7
0.2
E / V vs. Ag|AgCl (3M)
0.6
E / V vs. Ag|AgCl (3M)
(A)
10
0.4
(B)
AA
AA
EP
13
EP
UA
UA
6
I / µA
I / µA
9
5
2
1
–2
–0.15
–3
0.25
0.65
–0.2
0
0.2
0.4
E / V vs. Ag|AgCl (3M)
E / V vs. Ag|AgCl (3M)
(C)
(D)
0.6
Figure 5. Cyclic voltammograms in 0.1 M phosphate buffer solution (pH 7.0) in presence of 10.0 µ M AA (dashed
line), 5.0 µ M EP (solid line), and 4.0 µ M UA (dotted line), measured on A) bare GC electrode, B) MWCNT/GCE, C)
PMG/GCE, and D) PMG/MWCNT/GCE at a sweep rate of 50 mV s −1 .
As useful information involving electrochemical mechanisms can be acquired from the relationship between peak current and scan rate, the behavior of EP at different scan rates from 10 to 400 mV s −1 was also
studied. Figures 6A and 6B show the cyclic voltammetric investigations at various potential sweep rates for EP
on the surface of PMG/MWCNT/GCE. In these studies, a linear relationship with a correlation coefficient of
R 2 = 0.990 is observed between the anodic peak current and the square root of the potential sweep rate, which
reveals that the oxidation of EP is a diffusion-controlled process (Figure 6B).
42
RAOOF et al./Turk J Chem
16
21
I p / µA
(A)
y = 0.8321x – 1.1662
R 2 = 0.9901
16
11
6
(B)
10
1
I/µA
1
6
11
16
21
ν 1/2 / (mV s –1)1/2
k
4
a
–2
0.1
Figure 6.
0.3
0.5
E / V vs. Ag/AgCl/KCl (3M)
0.7
A) Cyclic voltammograms of 5.0 µ M EP in 0.1 M phosphate buffer solution (pH 7.0) measured on
PMG/MWCNT/GCE at various scan rates: (a) 10, (b) 20, (c) 30, (d) 40, (e) 80, (f) 100, (g) 120, (h) 160, (i) 200,
(j) 300, and (k) 400 mV s −1 . B) Plot of peak current Ip versus scan rate υ 1/2 .
In order to investigate the catalytic process, a Tafel plot was drawn from data of the rising part of the
current–voltage curve recorded at a scan rate of 10 mV s −1 . This part of the voltammogram, known as the
Tafel region, 49 is affected by electron transfer kinetics between the substrate (EP) and the PMG/MWCNT
(Figure 7). In this condition, the number of electrons involved in the rate-determining step can be estimated
from the slope of the Tafel plot. According to the Tafel slope equation and slope of 0.0872 V decade −1 the
charge transfer coefficient was calculated as α = 0.67.
E / V vs. Ag/AgCl/KCl (3M)
0.15
0.14
y = 0.0872x + 0.1059
R2 = 0.9911
0.13
0.12
0.11
0.1
0
0.1
0.2
0.3
0.4
log (I/µA)
Figure 7. The variation of potential E vs. current log I for rising part of cyclic voltammogram for oxidation of EP at
the surface of PMG/MWCNT/GCE at a scan rate 10 mV s −1 .
43
RAOOF et al./Turk J Chem
3.4. Electrochemical impedance spectroscopy
Impedance spectroscopy provides an effective method to probe the resistive and capacitive properties of surfacemodified electrodes. Figure 8 illustrates the impedance spectrum of the bare GCE (curve a), MWCNT/GCE
(curve b), PMG/GCE (curve c), and PMG/MWCNT/GCE (curve d) in 1.0 mM solution of K 3 [Fe(CN) 6 ] and
K 4 [Fe(CN) 6 ]. The semicircle diameter in the impedance spectrum is equal to the charge transfer resistance
( Rct ). The value of Rct depends on the dielectric properties of the electrode–electrolyte interface. At the
bare GCE, a semicircle of about 15 k Ω in diameter with an almost straight tail line was observed, which was
characteristic of a diffusion-limiting step of the electrochemical process. 50 The diameter of the semicircle was
apparently reduced at the MWCNT/GCE (curve b) and PMG/GCE (curve c) and the Rct values were 5.6 k Ω
and 1.3 k Ω , respectively. The decrease of Rct at the PMG/GCE suggested that the immobilized PMG film, as a
conductive polymer with positive charge, was favorable for the easier electrostatic interaction of [Fe(CN) 6 ] 3−/4−
on the electrode surface. Reduction in Rct with deposition of MWCNT on the GCE, i.e. MWCNT/GCE, may
be attributed to the good conductivity of nanotubes at the surface of the electrode. Interestingly, the diameter of
the semicircle was significantly reduced at the surface of PMG/MWCNT/GCE. With attention to the obtained
results, an Rct value of 494 Ω can be estimated at the surface of PMG/MWCNT/GCE, indicating that reduction
of the resistance toward the redox reaction of [Fe(CN) 6 ] 3−/4− was achieved by the simultaneous deposition of
MWCNT and PMG at the surface of GCE. This may be attributed to the more effective deposition of PMG
film on the MWCNT/GCE and an increase in porosity of the modified electrode surface. In other words, the
PMG/MWCNT/GCE film presents a much lower electrochemical charge transfer resistance than the pure PMG
film, suggesting its more active sites for faradaic reactions and easier charge transfer at the interface owing to
the presence of the incorporated MWNTs. Table 1 compares the Rct values obtained from the impedance
data of various electrodes modified with a conductive polymer and MWCNT. With attention to Table 1, it can
be proposed that the electrostatic interaction between different polymers and MWNTs facilitates an effective
degree of electron delocalization and thus enhances the conductivity of the composite polymer chain.
10000
8000
d
a
Z‘‘/kΩ
b
6000
c
4000
2000
0
0
5000
10,000
15,000
Z‘/kΩ
20,000
25,000
Figure 8. Nyquist plots for the faradaic impedance measurements of a 1.0 mM solution of 1:1 K 3 [Fe(CN) 6 ]/K 4 [Fe(CN) 6 ]
performed on GCE (curve a), MWCNT/GCE (curve b), PMG/GCE (curve c), and PMG/MWCNT/GCE (curve d).
The electrode potential was E = 0.22 V versus Ag|AgCl|KCl (3M). The frequency range was 0.1 Hz to 10 kHz.
44
RAOOF et al./Turk J Chem
Table 1. Comparison of Rct values obtained from the impedance data of various modified electrodes.
Electrode
PAANI/MWNTs/GCE
PAANI/GCE
PPy/MWCNT (10% w/w)
PPy/MWCNT (20% w/w)
PPy/MWCNT (30% w/w)
PMG/GCE
PMG/MWCNT/GCE
Rct (Ω)
5870
11,197
1.2
0.9
0.85
1300
494
Reference
51
52
This work
3.5. Chronoamperometric measurements
Chronoamperometry, as well as other electrochemical methods, was employed for the investigation of electrode
processes at chemically modified electrodes. 47 Figure 9A shows the current–time curves of PMG/MWCNT/GCE
obtained by setting the working electrode potential at 170 mV versus Ag|AgCl|KCl (3M) for various concentrations of EP in phosphate buffered solutions (pH 7.0). The diffusion coefficient (Dapp ) for oxidation of EP at
the surface of the modified electrode can be estimated using Cottrell’s equation: 48
−1/2 −1/2
t
,
I = nF AD1/2
app Cb π
(2)
9
(A)
(B)
I/µA
0.36
0.24
0.12
0
0.43
6
0.53
0.63
0.73
I/µA
t –1/2/ s –1/2
Slope / µAs 1/2
0.65
3
0.55
(C)
0.45
0.35
y = 6.619x – 0.194
R 2 = 0.995
0.25
e
0.07 0.08 0.09 0.1 0.11 0.12
[EP] / mM
a
0
0
2
t/s
4
6
Figure 9. A) Chronoamperograms obtained at the PMG/MWCNT/GCE in the absence (a) and presence of (b) 0.072,
(c) 0.082, (d) 0.092, and (e) 0.12 mM of EP in phosphate buffer solution (pH 7.0); the potential step was 170 mV versus
Ag|AgCl|KCl (3M). B) Plots of I versus t−1/2 obtained from chronoamperograms b–e in (A). C) Plot of the slope of
the straight lines against the EP concentration.
45
RAOOF et al./Turk J Chem
where Dapp and Cb are the diffusion coefficient (cm 2 s −1 ) and the bulk concentration (mol cm −3 ) , respectively.
At a mass transport limited rate condition, a plot of I vs.
t−1/2 will be linear, and the value of Dapp
can be calculated from the slope of this line. Figure 9B shows the obtained experimental plots for different
concentrations of EP. The mean value of Dapp was found to be 5.7 × 10 −6 cm 2 s −1 using the slopes of the
resulting straight lines plotted versus the EP concentrations (Figure 9C).
3.6. Simultaneous determination of AA, EP, and UA at PMG/MWCNT/GCE
Although the amount of peak separation in the obtained cyclic voltammograms by the modified electrode offered
sufficient resolution for simultaneous determination of AA, EP, and UA, the presence of high background current
in the CV method caused a decrease in peak clarity and current sensitivity spatially at low concentrations.
Therefore, the electrooxidation processes of mixtures of AA, EP, and UA at the surface of PMG/MWCNT/GCE
were investigated by the DPV method as a method with much higher current sensitivity and better resolution
than CV. In addition, the charging current contribution to the background current, which is a limiting factor in
analytical determination, is negligible in DPV mode. Figure 10 shows the DPVs for increasing concentrations
of AA, EP, and UA in the ternary mixtures while concentration of the other 2 species remained constant. From
Figure 10A, the peak current of AA increases linearly with increases in AA concentration from 0.4 to 100.0 µM.
The oxidation peak current of EP also increases linearly with increase in EP concentration from 0.1 to 100.0
µM with a correlation coefficient of 0.9979, as shown in Figure 10B. Similarly, as shown in Figure 10C, the UA
current increases in the linear range of 0.3–90.0 µM by keeping the concentration of the other 2 compounds
constant. Based on the above results, it is clear that the electrooxidation peaks for AA, EP, and UA oxidation
at the PMG/MWCNT/GCE are well separated from each other although they coexist in the same solution, and
the proposed sensor can be used for individual or simultaneous determination of AA, EP, and UA in mixture
samples without any cross interferences. The resulted detection limits (3σ) for AA, EP, and UA were 0.23,
0.0820, and 0.12 µM, respectively. The obtained values for determination of AA, EP, and UA by the modified
electrode are comparable with values reported by other research groups (Table 2). The stability of the electrode
is also high; the current response decreased by about 2.4% in 5 days and 6% in 30 days.
Table 2. Comparison of results obtained by various modified electrodes in determination of AA, EP, and UA.
Modified electrode
Caffeic acid/GCE
MDWCNTPE1
FePc2 -CPE3
PMG/MWCNT/GCE
1
2
3
Dynamic range (µM)
AA
EP
UA
20–1000
2.0–80
5.0–300
0.7–1200
25–750
1–300
0.4–100.0 0.1–100.0 0.3–90.0
Limit of detection (µM)
AA
EP
UA
7.0
0.20
0.60
0.216
8.8
0.5
0.23 0.0820
0.12
Reference
53
54
28
This work
Modified double-walled carbon nanotube paste electrode.
Iron(II) phthalocyanines.
Carbon paste electrode.
3.7. Real sample analysis
3.7.1. Determination of AA and EP in injection samples
One milliliter of epinephrine hydrochloride (specified content of EP is 1.00 mg L −1 ) and 0.1 mL of vitamin C
(specified content of AA is 100 mg mL −1 ) injection solutions were diluted to 100 mL and 250 mL with water,
respectively. Different volumes of diluted solutions were pipetted into each of a series of 20-mL volumetric flasks
46
RAOOF et al./Turk J Chem
20
60
20
60
40
16
40
I / µA
I / µA
12
8
4
20
q
y = 0.1696x + 0.3438
R2 = 0.9979
16
I / µA
I / µA
y = 0.5104x – 0.2389
R2 = 0.998
0
0
50
[AA] / µM
12
0
j
0
50
100
[EP] / µM
a
100
8
20
a
0
–0.3
–0.1
0.1
4
0.3
0.5
0.7
0
–0.2
0.9
0
0.2
E/V vs. Ag/AgCl/KCl (3M)
0.4
0.6
0.8
1
E/V vs. Ag/AgCl/KCl (3M)
(A)
(B)
24
20
I / µA
I / µA
20
16 y = 0.1818x + 1.472
R2 = 0.9995
12
8
4
16
0
0
20
40 60 80 100
[UA]µM
/
12
k
8
a
4
0
–0.3
–0.1
0.1
0.3
0.5
(C)
Figure 10. A) Differential pulse voltammograms of fixed concentration of EP (30.0 µ M) and UA (3.5 µ M) and different
concentrations of AA: (a) 0.4, (b) 1.0, (c) 1.6, (d) 2.0, (e) 3.0, (f) 4.0, (g) 5.0, (h) 10.0, (i) 15.0, (j) 20.0, (k) 30.0, (l) 40.0,
(m) 50.0, (n) 60.0, (o) 70.0, (p) 80.0, and (q) 100.0 µ M; B) differential pulse voltammograms of fixed concentration of
AA (15.0 µ M) and UA (7.0 µ M) and different concentrations of EP: (a) 0.1, (b) 1.2, (c) 2.0, (d) 4.0, (e) 15.0 (f) 20.0,
(g) 40.0, (h) 65.0, (i) 80.0, and (j) 100.0 µ M; C) differential pulse voltammograms of fixed concentration of AA (0.15
µ M) and EP (0.1 µ M) and different concentrations of UA: (a) 0.3, (b) 1.2, (c) 3.0, (d) 6.0, (e) 9.0, (f) 12.0, (g) 20.0,
(h) 35.0, (i) 55.0, (j) 75.0, and (k) 90.0 µ M at the PMG/MWCNT/GCE in 0.1 M phosphate buffer solution (pH 7.0).
Amplitude: 0.02 V; pulse width: 0.05 s; pulse period: 0.2 s. Insets show corresponding calibration curves.
and diluted to the mark with 0.1 M phosphate buffer (pH 7.0). An aliquot of 10 mL of this test solution was
placed in the electrochemical cell. The DPV method was used for detection of AA and EP. The obtained results
of AA and EP in the injections were 99.88 and 0.978 mg mL −1 , which corresponded well with the values that
were given by injection characterizations. Each sample was analyzed 5 times and relative standard deviations
(RSDs) obtained for AA and EP were 1.2% and 1.9%, respectively. Different standard concentrations of AA
47
RAOOF et al./Turk J Chem
and EP were added to the diluted vitamin C and EP injections and the recoveries were between 98.3% and
99.6% for 5 measurements.
3.7.2. Determination of UA in human urine samples
The practical analytical utility of the modified electrode for determination of UA was investigated by its
determination in normal urine human samples by DPV method. For the voltammetric measurements, the
obtained urine human samples (obtained from Dr. Safiri Medical Diagnostic Laboratory, Babolsar, Iran) were
diluted in 10 mL of phosphate buffer (pH 7.0). Each experiment was repeated in triplicate and recovery was
estimated by standard addition method (n = 3). The obtained results are given in Table 3.
Table 3. Determination of UA in human urine samples.
Sample
1
2
3
4
UA added (µM)
0.0
5.0
0.0
5.0
0.0
5.0
0.0
5.0
UA found (µM)
18.24 (± 0.04)
23.30 (± 0.03)
16.14 (± 0.02)
21.11 (± 0.07)
20.86 (± 0.04)
25.08 (± 0.06)
22.42 (± 0.05)
27.38 (± 0.05)
Recovery (%)
100.2
99.85
96.98
99.85
3.8. Interference study
The influence of various foreign species on the determination of 4.0 × 10 −5 M AA, 2.0 × 10 −5 M EP, and
2.0 × 10 −5 M UA was investigated. The tolerance limit was taken as the maximum concentration of the
foreign substances, which caused an approximately ± 5% relative error in the determination. The tolerated
concentration of foreign substances was 2.0 × 10 −2 M for Na + , Cl − , and K + ; 3.0 × 10 −1 M for Mg 2+
and Ca 2+ ; and 4.2 × 10 −2 M for L-lysine, glucose, L-asparagine, glycine, phenylalanine, N-acetyl-L-cysteine,
glutathione, and L-cysteine. Dopamine (DA) was also tested as a potential interference; the results showed
that DA exhibits a voltammetric signal at potential values close to that of EP oxidation. Therefore, DA can be
considered as an interfering agent in the determination of EP in prepared modified electrode.
3.9. Reproducibility of the PMG/MWCNT/GCE
Reproducibility is one of the most important properties of the electrode. To ascertain the reproducibility of
PMG/MWCNT/GCE, the oxidation peak current of 10 successive measurements of 30 µ M AA, 20 µM EP,
and 50 µM UA in the mixture at the PMG/MWCNT/GCE was investigated. After each measurement the
modified electrode was washed with 0.1 M PBS solution and measured for the same concentration. The RSD was
calculated to be 3.4%, 2.6%, and 1.8% for AA, EP, and UA, respectively, indicating that the modified electrode
is stable and does not suffer from surface fouling by oxidation products during the voltammetric measurements.
4. Conclusions
In the present work, a sensitive and selective electrochemical sensor has been developed using MWCNTs and
PMG at a GCE electrode. The PMG/MWCNT/GCE resulted in catalytic effects toward the electrooxidation
of AA, EP, and UA since it enhances the oxidation peak currents and lowers the oxidation overpotential.
48
RAOOF et al./Turk J Chem
Therefore, the simple and applicable electrochemical sensor allowed the successful determination of AA, EP,
and UA in pharmaceutical and biological preparations and proved that this method can be a good alternative
and advantageous over the reported methods. In sum, this accurate, fast, and sensitive method could represent
a useful tool for voltammetric determination of AA, EP, and UA.
References
1. Mahato, M.; Pal, P.; Tah, B.; Ghosh, M.; Talapatra, G. B. Colloids Surf. B 2011, 88, 141–149.
2. Cao, Y. C. Nanomedicine 2008, 3, 467–469.
3. Rosi, N. L.; Giljohann, D. A.; Thaxton, C. S.; Lytton-Jean, A. K. R.; Han, M. S.; Mirkin, C. A. Science 2006,
312, 1027–1030.
4. Kaittanis, C.; Naser, S. A.; Perez, J. M. Nano Lett. 2006, 7, 380–383.
5. Selvan, S. T.; Tan, T. T. Y.; Yi, D. K.; Jana, N. R. Langmuir 2009, 26, 11631–11641.
6. Giljohann, D. A.; Mirkin, C. A. Nature 2009, 462, 461–464.
7. Phillips, R. L.; Miranda, O. R.; You, C. C.; Rotello, V. M.; Bunz, U. H. F. Angew. Chem. Int. Ed. 2008, 47,
2590–2594.
8. Bajaj, A.; Miranda, O. R.; Kim, I. B.; Phillips, R. L.; Jerry, D. J.; Bunz, U. H. F.; Rotello, V. M. Proc. Natl. Acad.
Sci. 2009, 106, 10912–10916.
9. Neely, A.; Perry, C.; Varisli, B.; Singh, A. K.; Arbneshi, T.; Senapati, D.; Kalluri, J. R.; Ray, P. C. ACS Nano
2009, 3, 2834–2840.
10. Linse, S.; Cabaleiro-Lago, C.; Xue, W. F.; Lynch, I.; Lindman, S.; Thulin, E.; Radford, S. E.; Dawson, K. A. Proc.
Natl. Acad. Sci. U.S.A. 2007, 104, 8691–8696.
11. Wang, B.; Zhang, L.; Bae, S. C.; Granick, S. Proc. Natl. Acad. Sci. 2008, 105, 18171–18175.
12. Vamvakaki, V.; Tsagaraki, K.; Chaniotakis, N. Anal. Chem. 2006, 78, 5538–5542.
13. Han, D. S.; Lee, Y. J.; Kim, J. S.; Kim, E. Synth. Met. 2001, 117, 203205.
14. ORegan, B.; Gră
atzel, M. Nature 1991, 353, 737–740.
15. Umasankar, Y.; Prakash Periasamy, A.; Chen, S. M. Anal. Biochem. 2011, 411, 71–79.
16. Reich, S.; Thomsen, C.; Maultzsch, J. Carbon Nanotubes: Basic Concepts and Physical Properties, Wiley–VCH,
Weinheim, 2004.
17. Liu, C.; Kuwahara, T.; Yamazaki, R.; Shimomura, M. Eur. Polym. J. 2007, 43, 3264–3276.
18. Shahrokhian, S.; Asadian, E. J. Electroanal. Chem. 2009, 636, 40–46.
19. Pihel, K.; Schroeder, T. J.; Wightman, R. M. Anal. Chem. 1994, 66, 4532–4537.
20. Kalimuthu, P.; Abraham John, S. Anal. Chim. Acta 2009, 647, 97–103.
21. Patric, G. L. An Introduction to Medical Chemistry, Oxford University Press, New York, 2005.
22. Fotopoulou, M. A.; Ioannou, P. C. Anal. Chim. Acta 2002, 462, 179–185.
23. Zhu, X.; Shaw, P. N.; Barrett, D. A. Anal. Chim. Acta 2003, 478, 259–269.
24. Yao, H.; Sun, Y. Y.; Lin, X. H.; Chen, J. H.; Huang, L. Y. Luminescence 2006, 21, 112–117.
25. Nagaraja, P.; Vasantha, R. A.; Sunitha, K. R. Talanta 2001, 55, 1039–1046.
26. Wu, Y. Sens. Actuators B 2009, 137, 180–184.
27. Salimi, A.; Banks, C. E.; Compton, R. G. Analyst 2004, 129, 225–228.
28. Shahrokhian, S.; Ghalkhani, M.; Amini, M. K. Sens. Actuators B 2009, 137, 669–675.
29. Manjunatha, H.; Nagaraju, D. H.; Suresh, G. S.; Venkatesha, T.V. Electroanalysis 2009, 21, 2198–2206.
49
RAOOF et al./Turk J Chem
30. Behera, S.; Retna Raj, C. Biosens. Bioelectron. 2007, 23, 556–561.
31. Ramesh, P.; Sampath, S. Electroanalysis 2004, 16, 866–869.
32. Lupu, S.; Mucci, A.; Pigani, L.; Seeber, R.; Zanardi, C. Electroanalysis 2002, 14, 519–525.
33. Salimi, A.; Pourbeyram, S. Talanta 2003, 60, 205–214.
34. Ching, S.; Dudek, R. C.; Tabet, E. A. Langmuir 1994, 10, 1657–1659.
35. Vasudevan, P.; Santhosh, M. N.; Tyagi, S. Transition Met. Chem. 1990, 15, 81–90.
36. Morrin, A.; Wilbeer, F.; Ngamna, O.; Moulton, S. E.; Killard, A. J.; Wallace, G. G. Electrochem. Commun. 2005,
7, 317–322.
37. Zen, J. M.; Kumar, A. S.; Chen, J. C. Anal. Chem. 2001, 73, 1169–1175.
38. Ohnuki, Y.; Ohsaka, T.; Matsuda, H.; Oyama, N. J. Electroanal. Chem. 1983, 158, 55–68.
39. Lin, L.; Chen, J.; Yao, H.; Chen, Y.; Zheng, Y.; Lin, X. Bioelectrochem. 2008, 73, 11–17.
40. Milczarek, G.; Ciszewski, A. Electroanalysis 2004, 16, 1977–1983.
41. Liu, J.; Rinzler, A. G.; Dai, H.; Hafner, J. H.; Bradley, R. K.; Boul, P. J.; Lu, A.; Iverson, T.; Shelimov, K.;
Huffman, C. B.; Rodriguez-Macias, F.; Shon, Y. S.; Lee, T. R.; Colbert, D. T.; Smalley, R. E. Science 1998, 280,
1253–1256.
42. Ivanov, V.; Fonseca, A.; Nagy, J. B.; Lucas, A.; Lambin, P.; Bernaerts, D.; Zhang, X. B. Carbon 1995, 33, 1727–
1738.
43. Kim, B.; Sigmund, W. M. Langmuir 2004, 20, 8239–8242.
44. Raoof, J. B.; Ojani, R.; Amiri-Aref, M.; Baghayeri, M. Sens. Actuators B 2012, 166–167, 508–518.
45. Raoof, J. B.; Ojani, R.; Baghayeri, M.; Amiri-Aref, M. Anal. Methods 2012, 4, 1579–1587.
46. Wan, Q.; Wang, X.; Wang, X.; Yang, N. Polymer 2006, 47, 7684–7692.
47. Bard, A. J.; Faulkner, L. R. Electrochemical Methods, Fundamentals and Applications, Wiley, New York, 2001.
48. Raoof, J. B.; Ojani, R.; Baghayeri, M. Sens. Actuators B 2009, 143, 261–269.
49. Harrison, J. A.; Khan, Z. A. J. Electroanal. Chem. 1970, 28, 131–138.
50. Raoof, J. B.; Ojani, R.; Baghayeri, M. Anal. Methods 2011, 3, 2367–2373.
51. Jiang, C.; Chen, H.; Yu, C.; Zhang, S.; Liu, B.; Kong, J. Electrochim. Acta 2009, 54, 1134–1140.
52. Paul, S.; Lee, Y. S.; Choi, J. A.; Kang, Y. C.; Kim, D. W. Bull. Korean Chem. Soc. 2010, 31, 1228–1232.
53. Ren, W.; Luo, H. Q.; Li, N. B. Biosens. Bioelectron. 2006, 21, 1086–1092.
54. Beitollahi, H.; Ardakani, M. M.; Ganjipour, B.; Naeimi, H. Biosens. Bioelectron. 2008, 24, 362–368.
50