A new and simple DP polarographic method for the determination of uric acid in serum after elimination of the interference of ascorbic acid and dopamine
Bạn đang xem bản rút gọn của tài liệu. Xem và tải ngay bản đầy đủ của tài liệu tại đây (1.73 MB, 11 trang )
Turkish Journal of Chemistry
/>
Research Article
Turk J Chem
(2014) 38: 88 – 98
ă ITAK
c TUB
doi:10.3906/kim-1301-77
A new and simple DP polarographic method for the determination of uric acid in
serum after elimination of the interference of ascorbic acid and dopamine
Ali Cengiz C
¸ ALIS
¸ KAN, Gă
uler SOMER
Chemistry Department, Gazi University, Ankara, Turkey
Received: 28.01.2013
ã
Accepted: 18.08.2013
ã
Published Online: 16.12.2013
•
Printed: 20.01.2014
Abstract: Determination of trace amounts of uric acid (UA) in serum is of great importance since its level in serum may
show disorders in purine metabolism. With this method, trace amounts of UA in blood serum can be determined by a
fast and simple procedure using differential pulse polarography (DPP). The limit of detection was estimated to be 2 ×
10 −7 M (S/N = 3), lower than that given in previous studies. Among the many electrolytes studied, the best electrolyte
condition was found to be 0.05 M phosphate buffer, pH 10–12, in 0.1 M KNO 3 . The peak for UA appeared at about
–0.15 V in this medium, which responded well to standard additions and high reproducibility was obtained. The validity
of the proposed method was tested in serum samples by spiking known concentrations of UA to serum samples and high
recovery was obtained. The interference effect of dopamine (DA) and ascorbic acid (AA) was eliminated simply by the
addition of Fe(III), in a very fast and quantitative reaction.
The proposed method was successfully applied to the determination of UA in serum using only very small
quantities (0.5 mL) of serum. There is no need for long and tedious extraction or separation procedures, or to prepare
modified electrodes in order to eliminate the interference by AA and DA.
Key words: Uric acid, determination, serum, differential pulse polarography, elimination of ascorbic acid and dopamine
1. Introduction
Uric acid (UA) is known as the principal end product of purine metabolism in the human body. 1 Abnormal
levels of UA are a symptom of several diseases, including hyperuricemia, gout, and Lesch–Nyhan disease. 2
Therefore, its determination in blood serum and urine will serve as a marker for the detection of disorders
associated with purine metabolism. 3,4 Gout occurs when sodium urate crystals are deposited in the joints,
bursae, and tendons. Elevated concentrations of UA may also indicate some other medical conditions, such as
leukemia, kidney injury, and pneumonia. 4 A high UA level can be lowered by using chemotherapeutic drugs and
for this purpose its level has to be controlled continuously. According to a recent study, low serum/cerebrospinal
fluid levels of UA are a biomarker of Parkinson’s disease and high urate levels could slow this disease. 5 Thus,
the determination of trace concentration of UA in human blood and urine is very important for the diagnosis
and treatment of these kinds of diseases.
UA has been determined in the clinical laboratory by colorimetric, enzymatic, and electrochemical
methods. 6−9 In the most popular colorimetric method, UA is oxidized by phosphotungstic acid and the
absorbance of tungstic acid formed is measured. Interference by some reducing agents such as ascorbic acid
(AA) restricts the analytical applications of this method. 10
∗ Correspondence:
88
C
¸ ALIS
¸ KAN and SOMER/Turk J Chem
Enzymatic methods 11−14 are more selective than colorimetric methods, but, because of readily oxidizable
interferents, difficulties will be faced to eliminate the interferences, which make this procedure complex.
In electrochemical methods, AA and dopamine (DA) present in urine and blood serum are interfering
constituents since they are oxidized close to the potential of UA. For the elimination of this interference,
various modified electrodes have been developed. Fast scan voltammetry was applied with a bare carbon fiber
electrode, 4 and the results obtained showed good selectivity in the determination of low concentrations of UA in
the presence of AA. A mono-layer of aminophenol was grafted on a glassy carbon electrode, which demonstrated
electrocatalytic activity towards the oxidation of ascorbate, so that AA and UA could be separated. Thus,
simultaneous detection of UA and AA was possible and the limit of detection for UA was 1.4 × 10 −5 M. 15
For the simultaneous determination of DA, AA, and UA, a carbon ionic liquid electrode was developed and
it was used with cyclic voltammetry and differential pulse voltammetry (DPV). With this electrode, UA was
determined with a detection limit of 4 × 10 −4 M, but DA and AA could not be detected in human serum; their
concentrations were below this limit. However, after increasing their concentrations by adding both DA and
AA to the serum, it was shown that they could only be determined 16 at higher concentrations.
Simultaneous detection of UA and AA in urine and human serum could be achieved using a copper
modified electrode. A linear calibration curve was obtained in the concentration range of 1.0–4.0 × 10 −5 M for
UA. 17 Prior to every experiment, the glassy carbon electrodes had to be polished, rinsed, sonicated, and then
activated to remove the charging currents.
For the determination of UA in the presence of AA, gold nanoclusters were electrodeposited on a glassy
carbon electrode. 18 It was used for the determination of UA in urine in the presence of a large amount of AA.
Using a Pt Au hybrid film modified electrode with DPV, DA, AA, and UA could be determined. 19 At pH 4
the calibration curve was obtained in the 2 × 10 −5 to 3.3 × 10 −4 M concentration range. AA, UA, and DA
were detected using a pyrollytic graphite electrode modified in DA solution. 20 The detection limit obtained for
UA was 1.4 × 10 −6 M.
In most electrochemical studies where modified electrodes were used, AA and DA were given as the most
interfering substances. For their elimination, various modified electrodes have been developed. 4,15−21 Although
these modified electrodes show selectivity, most of them are based on adsorption phenomena and thus they need
to be renewed after nearly each measurement. Their detection limit is also mostly not as low as expected from
these methods.
Polarographic methods, using dropping mercury electrodes (DMEs), offer useful alternatives since they
allow faster, cheaper, and safer analysis. Validation can be achieved by working with different electrolytes and
at different pH values. 22−24 There is no need for long and tedious electrode preparation procedures after each
use. The results obtained with differential pulse polarography (DPP) are very reproducible since with the use
of a DME the behavior of the electrode is independent of its history. So far no work has been found in the
literature that used DPP for the determination of UA.
The aim of this work was to establish a new and simple DPP method for the trace determination of UA
in serum. In this method there is no need to prepare modified electrodes that need long and tedious electrode
preparation procedures after each use.
89
C
¸ ALIS
¸ KAN and SOMER/Turk J Chem
2. Experimental
2.1. Apparatus
A polarographic analyzer (PAR 174 A) equipped with a PAR mercury drop timer was used. The drop time
of the electrode was in the range 2–3 s (2.35 mg s −1 ). A Kalousek electrolytic cell with a saturated calomel
electrode (SCE), separated by a liquid junction, was used in the 3-electrode configuration. The counter electrode
was platinum wire. The polarograms were recorded with a Linseis (LY 1600) X-Y recorder under the conditions
of a drop life of 1 s, a scan rate of 2 mV s −1 , and a pulse amplitude of 50 mV. High purity nitrogen (99.999%)
was used to expel oxygen present before each measurement. Cr(II) solution was used in gas washing bottles to
reduce any trace oxygen in nitrogen gas.
2.2. Reagents
All chemicals used were of analytical-reagent grade (proanalysis).
preparation of all solutions. Solutions of 10
order to avoid aging of the solution.
−3
Triply distilled water was used in the
M and more dilute ones were prepared before every use in
1.0 M HAc/Ac buffer was prepared by adding 6 g of NaOH, washed with distilled water in order to
remove the carbonate formed, to 57 mL of 1 M HAc and diluting to 1 L.
0.05 M phosphate buffer: 0.23 g of Na 3 PO 4 .12H 2 O, 2.13 g of Na 2 HPO 4 .2H 2 O, and 2.5 g of KNO 3 are
dissolved in distilled water. The pH is adjusted to 10.5 by the addition of 0.1 M NaOH and then diluting to
250 mL.
10 −3 M UA solution: 0.0168 g reagent grade uric acid (C 5 H 4 O 3 N 4 ) (Merck) is shaken in about 30 mL
of 0.1 M NaOH for 20 min and then it is diluted to 100 mL. It is prepared daily.
0.1 M AA solution: 1.76 g of ascorbic acid (C 6 H 8 O 6 ) is dissolved in 100 mL of deaerated distilled water
and stored in darkness in an air-tight container. It can be used for only a few days.
0.1 M Fe(III) solution: 0.68 g of FeCl 3 .6H 2 O is dissolved in 3 M HCl and diluted to 25 mL.
6.5 × 10 −2 M DA solution: 10 mg of dopamine hydrochloride is dissolved in 10 mL of water.
The mercury used in the dropping mercury electrode was obtained from Merck (Darmstadt, Germany).
Contaminated mercury was cleaned by passing it successively through dilute HNO 3 (3.0 M) and water columns
in the form of fine droplets by using a platinum sieve.
This mercury was then washed in the same way until no acidic reaction was observed. The collected
mercury was dried between sheets of filter paper and stored in a closed vessel covered with water. The mercury
used was not lost since it was collected quantitatively, without causing any pollution. Thus, no mercury loss
was possible and it can be used continuously. Before use, a DPP polarogram of this mercury was recorded in
order to confirm the absence of impurities.
2.3. Procedure for the elimination of AA and DA in serum sample
To a beaker were added 0.5 mL of blood serum and 0.5 mL of 10 −2 M Fe(III) and left for about 1 min; for
the reaction of both AA and DA with Fe(III), pH has to be around 2–3. This sample was then added to a
polarographic cell containing 0.05 M phosphate buffer (pH 10.5) and 0.1 M KNO 3 .
90
C
¸ ALIS
¸ KAN and SOMER/Turk J Chem
3. Results and discussion
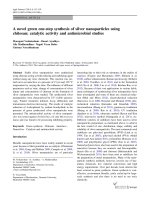
3.1. Polarographic determination of UA
Polarograms of UA were taken in acetate, phosphate, borate, and ammonium electrolytes at various pH levels.
The best electrolyte condition was found to be 0.05 M phosphate buffer (pH range 10–12) in the presence of 0.1
M KNO 3 . At higher pH values a mercury peak appeared at about –0.1 V, which caused an overlap with the
UA peak in this medium. The UA peak in phosphate buffer appeared at about –0.15 V; it responded well to
standard additions and high reproducibility was obtained (Figure 1). Scan rate was 2 mV/s (instead 5 mV/s)
in order to obtain better separation of UA and Hg peaks. The limit of quantification was 1 × 10 −6 M and
the limit of detection (LOD) was estimated to be 2 × 10 −7 M (S/N = 3), which is lower than the LOD values
given in the literature.
I (Current)
0.95 µA
d
c
b
a
-0.03
-0.2
-0.4
-0.6
E/V (vs. SCE)
3−
Figure 1. Determination of uric acid (UA) by standard additions using DPP a) 10 mL 0.05 M HPO 2−
+ 0.1
4 /PO 4
M KNO 3 , pH 10.5 b) a + 0.1 mL 10 −3 M UA c) b + 0.1 mL 10 −3 M UA d) c + 0.1 mL 10 −3 M UA.
3.2. Anodic peak of UA
As known, the nature (cathodic or anodic) of a polarographic peak cannot be evaluated by DPP. For this
purpose, direct current (DC) polarography has to be used. The DC polarographic wave in phosphate buffer
91
C
¸ ALIS
¸ KAN and SOMER/Turk J Chem
at pH 11 for 10 −4 M UA is observed. As can be seen in Figure 2, UA has an anodic wave on DME with a
half-wave potential at about –0.2 V and it responds well to standard additions.
0.20 µA
Ic
E/V (vs. SCE)
0.0
–0.4
–0.6
–0.8
–1.0
–1.2
–1.4
–1.6
–1.8
a
b
Ia
c
d
e
Figure 2. Direct current (DC) polarogram of UA a) 10 mL 0.05 M Phosphate buffer + 0.1 M KNO 3 , pH 11.0 b) a +
0.1 mL 10 −2 M UA c) b + 0.1 mL 10 −2 M UA d) c + 0.1 mL 10 −2 M UA e) d + 0.1 mL 10 −2 M UA.
3.3. Interference studies
Interference of AA, DA, Cu(II), Fe(III), and Fe(II) has been studied. In most electrochemical studies for the
determination of UA, AA and DA are given as the most interfering substances. For their elimination, various
modified electrodes have been developed. 4,15−22
3.3.1. Interference from AA and its elimination
It is well known that AA is found at about the same concentration as UA in blood serum and 100 to 1000
times higher than the concentration of DA. When AA was added to the polarographic cell containing phosphate
buffer (pH 10–12) it had an anodic peak at about –0.20 V. Since the UA peak is at about –0.15 V there will
be a peak overlap in the presence of high concentrations of AA. For the elimination of AA, Fe(III) is selected,
since AA is a reducing agent and Fe(III) with a +0.78 V standard electrode potential will act as an oxidizing
agent. We have shown experimentally that this reaction takes place very fast and quantitatively. For this
purpose, first a synthetic sample was prepared containing AA and various quantities of Fe(III). It was found
that when Fe(III) concentration was more than 2 times the AA concentration, AA was completely oxidized
and no peak for AA was observed. It was also found that this reaction took place in a slightly acidic solution
(pH 2–3). The acidity of Fe(III) added for AA oxidation was found to be sufficient. As known, because of
the hydrolysis reaction, Fe(III) solutions have to be prepared with HCl (Section 2.2). The pH of an artificially
92
C
¸ ALIS
¸ KAN and SOMER/Turk J Chem
prepared sample containing 1 mL of 10 −3 M UA, 1 mL of 10 −3 M AA, and 2 mL of 10 −3 M Fe(III) was about
3.0. In this medium Fe(III) had no peak and thus addition of excess iron(III) did not interfere. As can be seen
from Figure 3, the 1 × 10 −5 M UA content in the synthetic sample was determined in the presence of 1 ×
10 −5 M AA, as (1.0 ± 0.1) × 10 −5 M using standard addition.
Figure 3. Determination of UA in a synthetic sample using DPP a) 10 mL 0.05 M Phosphate buffer + 0.1 M KNO 3 ,
pH 10.9 b) a + 0.4 mL sample c) b + 0.1 mL 10 −3 M UA
Sample: 1 mL 10 −3 M UA + 1 mL 10 −3 M AA + 2 mL 10 −3 M Fe 3+ .
3.3.2. Effect of copper
The interference of copper has also been studied since copper(II) has a peak at about 0 V and thus an overlap
with the UA peak may take place. A polarogram of 2 × 10 −5 M copper(II) in this medium had a peak at –0.2
V; with the addition of 0.1 mL of 1 × 10 −3 M UA, the copper peak decreased and was lost with the second UA
addition. With a reduction potential of +0.34 V it is expected that copper(II) will oxidize UA. Experimentally
it was found that 1 mol of copper oxidized 1 mol of UA. Since UA and copper peaks overlap, in order to see
whether copper was still in the solution, EDTA was added. When 1 mol UA per 1 mol copper(II) was added,
no Cu-EDTA peak (at about –0.5 V) was observed, which indicates that UA and copper reacted quantitatively.
However, the presence of copper ion in serum will not create a problem, since it will react with UA
and will be lost, there will be no overlapping copper peak, and the UA present in serum after the reaction can
correctly be determined.
93
C
¸ ALIS
¸ KAN and SOMER/Turk J Chem
3.3.3. Effect of Fe(III) and Fe(II)
Since Fe(III) was used for the elimination of AA, its excess will be present in solution during the UA determination. There will be a possibility to react with UA; however, when Fe(III) in high concentration was added to
a solution containing UA, no decrease in the UA peak was observed. During the oxidation of AA with Fe(III),
the reduction product will be Fe(II) and it may have an overlapping peak, but addition of Fe(II) had no peak
in this medium.
3.3.4. Interference of DA
It is known that DA is also present in blood serum; its concentration is 1000 times lower than that of UA
present. To see its effect, a polarogram of 6.5 × 10 −5 M DA solution is taken under the same conditions
(0.05 M phosphate buffer) used for UA determination. DA had 2 peaks (Figure 4, curve b) in this medium,
at –0.11 V and at –0.22 V. These 2 peaks would overlap with the peak of UA; however, with the addition of
the same concentration of (6.5 × 10 −5 M) iron(III), DA was oxidized and lost. As can be seen from Figure
4 (curve c), there was no peak for DA after addition of Fe(III) and the UA peak responded well to standard
additions (curves d, e, and f) in this medium. Here we have to mention that the DA concentration used for this
experiment was much higher than that normally present in serum.
3−
Figure 4. Elimination of dopamine interference using Fe 3+ a) 10 mL (0.05 M HPO 2−
+ 0.1 M KNO 3 ) , pH
4 /PO 4
10.8 b) a + 0.1 mL 6.5 × 10 −3 M Dopamine c) b + 0.1 mL 6.5 × 10 −3 M Fe 3+ d) c + 0.1 mL 10 −3 M UA e) d +
0.1 mL 10 −3 M UA f) e + 0.1 mL 10 −3 M UA
94
C
¸ ALIS
¸ KAN and SOMER/Turk J Chem
Since in normal cases DA concentration is 1000 times lower than that of UA in blood serum, its peak will
not be observed. However, in the case of higher concentrations of DA in serum, Fe(III) added for the elimination
of AA will oxidize DA also and thus no interference is expected.
3.4. Determination of UA in human serum in the presence of AA and DA
For this purpose, blood serum (centrifuged) was obtained from the Medical Center of Gazi University. To 0.5
mL of blood serum, 0.5 mL of 10 −2 M Fe(III) was added and left for about 1 min for the reaction between AA
and Fe(III). It was shown in our preliminary studies that this reaction was very fast. Then 0.5 mL was taken
and added to a polarographic cell containing 9.5 mL of 0.05 M phosphate buffer (pH 10.5) and 0.1 M KNO 3.
The quantity of UA was determined by standard additions as can be seen from Figure 5. The amount of UA
3−
Figure 5. Determination of UA in human serum using DPP a) 9.5 mL (0.05 M HPO 2−
+ 0.1 M KNO 3 ) , pH
4 /PO 4
10.5 b) a + 0.5 mL serum sample c) b + 0.1 mL 10 −3 M UA d) c + 0.1 mL 10 −3 M UA
Sample: 0.5 mL serum + 0.5 mL 10 −2 M Fe 3+ .
95
C
¸ ALIS
¸ KAN and SOMER/Turk J Chem
in this serum sample was 7.8 ± 0.6 mg/100 mL for N = 3, 90% confidence interval; it corresponds to about 4.6
× 10 −4 M UA.
To authenticate the validity of the result, the sample was spiked with known concentrations of UA. Table
1 summarizes the results obtained for 4 different centrifuged serum samples taken from the Medical Center.
The recoveries obtained varied from 99% to 115%.
Table 1. Determination of UA in various blood serum samples, before and after addition of known amount of UA (N
3−
= 3, 90%) 9.5 mL buffer (0.05 M HPO 2−
+ 0.1 M KNO 3 ) (pH 10.5).
4 /PO 4
Samples
Blood
Blood
Blood
Blood
Blood
Serum
Serum
Serum
Serum
Serum
I
II
III
IV
V
UA determined
using this
method in blood
serum (M)
(3.3 ± 0.3) × 10−4
(3.1 ± 0.4) × 10−4
(1.5± 0.2) × 10−3
(2.5 ± 0.3) × 10−4
(2.8 ± 0.3) × 10−4
Spike
(to blood serum) (M)
4.0
4.0
0.5
5.0
5.0
×
×
×
×
×
10−4
10−4
10−3
10−4
10−4
UA determined
(this method)
after spike (present
in blood serum) (M)
(7.9 ± 0.7) × 10−4
(8.1 ± 0.5) × 10−4
(2.1 ± 0.2) × 10−3
(7.5 ± 0.5) × 10−4
(8.1± 0.5) × 10−4
A calibration graph for UA in human serum was also prepared. For this purpose, first the UA content of
a serum sample was determined after elimination of the interference of AA and DA by the addition of Fe(III).
Then to another aliquot of the same serum sample the same procedure was applied after addition of known
amounts of UA. After each addition the UA content was determined by standard addition. This procedure was
repeated several times. As can be seen from this curve (Figure 6), standard additions showed linear dependence
in serum medium. The results obtained are summarized in Table 2. It can be concluded that with this method
it is possible to determine UA concentration in serum medium with high precision and accuracy.
3−
Table 2. Response to UA additions in serum solutions 9.5 mL buffer (0.05 M HPO 2−
+ 0.1 M KNO 3 ) (pH
4 /PO 4
10.5).
[UA] originally
present in
serum* / M
4.0 × 10⁻⁴
[UA] added to
serum / M
No addition
5.0 × 10⁻⁴
10.0 × 10⁻⁴
15.0 × 10⁻⁴
[UA] in serum
present / M after
addition (calculated)
4.0 × 10⁻⁴
9.0 × 10⁻⁴
14.0 × 10⁻⁴
19.0 × 10⁻⁴
Determined, using
this method
[UA] / M
(4.0 ± 0.3) × 10−4
(9.6 ± 0.3) × 10−4
(13.5 ± 0.5) × 10−4
(20.1 ± 0.3) × 10−4
*UA originally present in serum: 4 × 10 −4 M
Additions are made so that each time the concentration of UA in serum increased 5 × 10 −4 M
3.5. Recommended procedure for the determination of UA in serum
To a small beaker are added 0.5 mL of blood serum (centrifuged) and 0.5 mL of 10 −2 M Fe(III) and left for
about 1 min; for the reaction of both AA and DA with Fe(III), pH has to be around 2–3. The acidity of Fe(III)
added for AA oxidation is sufficient, since Fe(III) solutions have to be prepared with HCl. A 0.5 mL aliquot of
this sample is then added to a polarographic cell containing 9.5 mL of 0.05 M phosphate buffer (pH 10.5) and
0.1 M KNO 3 . The quantity of UA is then determined by standard additions.
96
C
¸ ALIS
¸ KAN and SOMER/Turk J Chem
[UA]found / mM
2,4
1,8
1,2
0,6
0
0
0,5
1
1,5
2
[UA] added / mM
3−
Figure 6. Calibration curve in serum medium 9.5 mL (0.05 M HPO 2−
+ 0.1 M KNO 3 ) , pH 10.5 UA present
4 /PO 4
in serum: 4 × 10 −4 M. Additions are made so that each time the concentration of UA in serum increased 5 × 10 −4
M. The figures on the abscissa and ordinate have to be multiplied with 10 −4 to find the real concentration in M.
The determination of the trace concentration of UA in human blood and urine is very important for
the diagnosis and treatment of many diseases. So far no work has been found in the literature that used DPP
for the determination of UA. It is possible to determine low concentrations of UA with high precision and
reproducibility using this method.
With the newly proposed DPP method, UA in serum could be determined in the presence of large
quantities of AA and DA using very small quantities of serum. Interference of AA and DA was eliminated
simply by the addition of Fe(III) to the sample solution. It was possible to determine UA in serum with high
accuracy and very quickly using this method. The limit of detection was estimated to be 2 × 10 −7 M (S/N
= 3), which was lower than that given in previous studies. The reproducibility is very high since with the use
of a DME the behavior of the electrode is independent of its history. The validity of the proposed method
was tested in serum samples by spiking known concentrations of UA to serum samples and high recovery was
obtained. This newly developed method can be applied to many biological materials directly. It is possible
to determine small quantities of UA in serum by a fast and simple method. There is no need to prepare new
modified electrodes in order to eliminate the interference of DA and AA. Although these modified electrodes
show selectivity, besides their long and tedious preparation procedures, these electrodes need to be renewed
after each measurement since most of them are based on adsorption phenomena. Their detection limit is also
mostly not as low as expected from these methods.
References
1. Dryhurst, G.; Stocker, J. H. Electrochemistry of Biological Molecules; Academic Press: New York, NY, USA, 1977.
2. Zen, J. M.; Jou, J. J.; Ilangovan, G. Analyst 1998, 123, 1345–1350.
3. Harper, H. A. Review of Physiological Chemistry; 13th ed., Lange Medical Publications: Los Altos, CA, USA,
1977.
4. Bravo, R.; Hsueh, C. C.; Jaramillo, A.; Brajter-Toth, A. Analyst 1998, 123, 1625–1630.
5. Ascherio, A.; LeWitt, P.A.; Xu, K.; Eberly, S.; Watts, A.; Matson, W. R.; Marras, C.; Kieburtz, K.; Rudolph, A.;
Bogdanov, M. B.; et al. Arch. Neurol. 2009, 66, 1460–1468.
6. Pilleggi, J. V.; Di Diorgio, J.; Wybenga, R. D. Clin. Chim. Acta 1972, 37, 141–146.
7. Benedict, R. J. Biol. Chem. 1930, 86, 179–187.
97
C
¸ ALIS
¸ KAN and SOMER/Turk J Chem
8. Jung, H. D.; Parekh, C. A. Clin. Chem. 1970, 16, 247–250.
9. Wyngaarden, B. J.; Kelly, N. W. Gout and Hyperuricemia; Grune and Stratton: New York, NY, USA, 1976.
10. Gilmartin, M. A. T.; Hart, J .P.; Birch, B. Analyst 1992, 117, 1299–1303.
11. Gilmartin, M. A. T.; Hart, J. P. Analyst 1994, 119, 833–840.
12. Gilmartin, M. A. T.; Hart, J. P.; Birch, B. Analyst 1994, 119, 243–251.
13. Miland, E.; Ordieres, M. J. A.; Blanco, T. P.; Smyth, N. R.; Fagain, C. O. Talanta 1996, 43, 785–796.
14. Nassef, H. M.; Radi, A. E.; O’Sullivan, C. Anal. Chim. Acta 2007, 583, 182–189.
15. Safavi, A.; Maleki, N.; Moradlou, O.; Tajabadi, F. Anal. Biochem. 2006, 359,224–229.
16. Selvaraju, T.; Ramaraj, R. Electrochim. Acta 2007, 52, 2998–3005.
17. Li, J.; Lin, X .Q. Anal. Chim. Acta 2007, 596, 222–230.
18. Thiagarajan, S.; Chen, S. M. Talanta 2007, 74, 212–222.
19. da Silva, R. P.; Lima, A.W. O.; Serrano, S .H. P. Anal. Chim. Acta 2008, 612, 89–98.
20. Ensafi, A. A.; Taei, M.; Khayamian, T.; Arabzadeh, A. Sensors and Actuators 2010, 147, 213–221.
21. Hadi Beitollahi, H.; Bakhsh Raoof, J.; Hosseinzadeh, R. Electroanal. 2011, 23, 19341940.
ă T.; Somer, G. Anal. Chim. Acta 2007, 603, 30–35.
22. Yılmaz, U.
23. Somer, G.; Do˘
gan, M. Bioelectrochemistry 2008, 74, 96–100.
24. C
¸ alı¸skan, A. C.; Somer, G. Turk. J. Chem. 2007, 31, 411–422.
98