Study of the interaction between glucosamine hydrochloride and sodium dodecylsulphate micelles using conductometric, isothermal calorimetry, zeta-potential titrations, and NMR
Bạn đang xem bản rút gọn của tài liệu. Xem và tải ngay bản đầy đủ của tài liệu tại đây (530.05 KB, 12 trang )
Turkish Journal of Chemistry
/>
Research Article
Turk J Chem
(2014) 38: 248 – 259
ă ITAK
c TUB
doi:10.3906/kim-1306-22
Study of the interaction between glucosamine hydrochloride and sodium
dodecylsulphate micelles using conductometric, isothermal calorimetry,
zeta-potential titrations, and NMR NOESY
Marcos Roberto Abreu ALVES1 , Luciano Sindra VIRTUOSO2 ,
ˆ
Elson Santiago de ALVARENGA3 , Angelo
M´
arcio Leite DENADAI4,∗
1
Department of Materials Engineering, Federal University of Itajub´
a (UNIFEI), Itabira-MG, Brazil
2
Department of Chemistry, Federal University of Alfenas (UNIFAL), Alfenas-MG, Brazil
3
Department of Chemistry, Federal University of Vi¸cosa (UFV), Vi¸cosa-MG, Brazil
4
Pharmaceutical Department, Federal University of Juiz de Fora (UFJF), Campus Governador Valadares,
Governador Valadares-MG, Brazil
Received: 12.06.2013
•
Accepted: 28.08.2013
•
Published Online: 14.03.2014
•
Printed: 11.04.2014
Abstract: The aim of this work was to investigate the influence of an anti-inflammatory agent, the bulky counterion
named glucosamine (Gl + ) , in sodium dodecylsulphate (SDS) in 2 ways: 1) by titration of SDS solutions with different
concentrations of Gl + ; and 2) by titration of Gl + with SDS solution with concentration close to the critical micellar
concentration (cmc) (7.7 mM). In procedure 1, micellisation study by isothermal titration calorimetry (ITC) showed
that the increase in Gl + concentration reduces the cmc and the micellisation enthalpy. Increasing of the micellisation
entropy was also observed, suggesting desolvation of micellar structures as a consequence of electrostatic attraction with
Gl + ions. In procedure 2, titration of Gl + with SDS solution at 7.7 mM showed the existence of 3 distinct ranges
of glucosamine/SDS concentrations, which were attributed to I) Gl + inducing micellisation, II) neutralisation of the
micelles, and III) competition between the ions themselves in the micellar surface.
Key words: SDS, micelles, glucosamine hydrochloride, osteoarthritis
1. Introduction
The binding of water-soluble molecules such as drugs, antibodies, and antimicrobials to membrane models is an
important issue in many biological processes, since it helps us to understand their local mechanism of action. 1−6
Independent of the target, the initial interaction with cells should occur through contact with the membrane.
Thus, there are, for instance, several kinds of cationic substances that bind to the bacterial membrane through
electrostatic interactions with negatively charged phospholipids in the outer leaflet of the lipid bi-layer, causing
inactivation of ionic channels.
Surfactants are an important kind of substance that are used in many biological, pharmaceutical, and
industrial systems, and they tend to self-associate, forming structures such as micelles, vesicles, bi-layers, and
bi-continuous systems. 2,4,5,7−10 Generally their hydrophobic portion is protected from the aqueous environment
by an approximately spherical shell formed by the polar or ionic head groups. Thus, the surfactants are able
of reducing the liquid–liquid, liquid–solid, and liquid–gas interfacial tension and promote the dissolution of
hydrophobic substances such as drugs, dyes, polymers, and oils.
∗ Correspondence:
248
ALVES et al./Turk J Chem
Micelles of surfactants, such as SDS, are able to induce changes in the secondary structure of peptides
and proteins, in addition to interacting strongly with cationic substances. Thus, they have been used as a model
of membranes to simulate binding studies of proteins, peptides, and drugs due to some similarities with anionic
biological membranes. 3,11−15
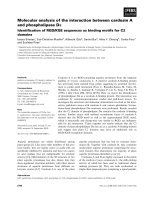
Glucosamine hydrochloride (Gl + ) (Figure 1) is an anti-inflammatory agent having an excellent toxicity profile, 16−18 and is an active drug needed to form collagen, whose oral ingestion causes reduction of
osteoarthritis. 16,18−21 Its mode of action is reported to occur in the intracellular environment. It fully protects
the chondrocytes from IL-1-induced expression of inflammatory cytokines, chemokines, and growth factors as
well as proteins involved in prostaglandin E-2 and nitric oxide synthesis. It also blocks the IL-1-induced expression of matrix-specific proteases such as MMP-3, MMP-9, MMP-10, MMP-12, and ADAMTS-1. 20 Although
Gl + is currently used in therapies, with known action occurring in the intracellular environment, its mechanism
of absorption is not yet fully known.
12
OH
a)
12
H2 C
11
6
CH
HO
CH
5
1
O
4
CH
2
CH
CH
3
10
H
7
OH
N
8
H
11
1
5
10
Cl- ;
+
OH
O
HO
6
H
HO
9
H
4
H
H
b)
O
-
3
2
+
8N
H1
H
Cl-
H OH
H H
OH
9
O
H
7
H4
S
O
O
CH3
H2
H3
Figure 1. a) Structure of glucosamine hydrochloride and b) SDS.
Our hypothesis is based on the fact that Gl + is a hydrophilic species that could interact with anionic
cytoplasmic membranes by electrostatic interactions. Moreover, its bulky volume will hinder the crossing of
the hydrophobic inner of membranes, increasing the tendency of accumulation in the extracellular environment.
Thus, the main objective of this work was to investigate the association between Gl + cation with anionic SDS
micelles as a membrane model in aqueous solution, since that could represent a contribution for understanding
the mechanism of interaction.
Initially, our strategy was based on investigation of the Gl + concentration effect on the critical micellar
concentration (cmc) of SDS as well as on the thermodynamic properties of micellisation by isothermal titration
calorimetry (ITC), once enthalpy and entropy obtained by ITC studies are highly dependent from electrostatic
interactions as well as solvation/desolvation balance. Furthermore, we investigated the effect of increasing Gl +
concentration on SDS solution at 7.7 mM (close to cmc = 8.1 mM), monitored by conductomectric, calorimetric,
and zeta potential (ZP) titrations. Finally, we investigated the topology of Gl + /SDS assembly by NMR NOESY,
which allowed us to infer about the depth of Gl + in SDS micelles.
2. Experimental section
2.1. Chemicals
The surfactant sodium dodecyl sulphate (SDS) used in the present work was purchased from Merck (purity,
99.9%), and showed a cmc = 8.1 mM, by conductometric titration at 25 ± 0.1 ◦ C. The glucosamine hydrochlo249
ALVES et al./Turk J Chem
ride was obtained from Sigma (purity, 99.9%). All the solutions were prepared in purified water (Milli-Q,
conductivity 1.22 µ S/cm) obtained from a Millipore water purification unit.
2.2. Methods
2.2.1. Isothermal titration calorimetry
The isothermal titration calorimetry (ITC) was carried out using a Microcal VP-ITC Microcalorimeter, at 298
K (25.0 ± 0.1
◦
C supplied by Peltier thermoelectric system). Titrations were performed in 2 ways: 1) by 51
successive injections of SDS solution at 105.0 mM in a calorimetric cell containing 1.5 mL of Gl + solutions at
concentrations of 0, 1.0, 3.0, 5.0, 7.0, 10.0, and 15.0 mM; and 2) through of 51 successive injections of Gl +
aqueous solution (5.0 µ L, 65.0 mM) into the reaction cell charged with 1.5 mL of SDS aqueous solution at
7.7 mM. In all experiments, the injections were performed at time intervals of 300 s and stirring speed of 150
rpm. The initial 1.0-µ L injection was discarded in order to eliminate diffusion effects from the syringe tip
during the pre-equilibration process. The concentration correction as well as the integration of the heat flow
peaks to calculate partial molar enthalpy of SDS (dQ/d[SDS] = ∆SDS H 0 ) or the partial molar enthalpy of
Gl + (dQ/d[Gl + ] = ∆Gl H 0 ) was performed with the software Microcal Origin 5.0 for ITC.
2.2.2. Conductometric titrations
Conductivity measurements were carried out at 298 K (25.0 ± 0.2 ◦ C) with a Tecnal Tec-4MP conductivimeter,
through the manual injection of consecutive aliquots of 100 µ L of Gl + 50.0 mM into a cell charged with 25.0
mL of SDS 7.7 mM upon magnetic stirring. The temperature was controlled by immersion of the cell into a
Tecnal TE-184 thermostatic bath.
2.2.3. Zeta potential
ZP measurements were obtained with a Malvern Zetasizer NanoZS with a 64-channel correlator and 633 nm
red laser. The technique used for ZP measurement is the Malvern standard laser Doppler velocimetry coupled
with M3-PALS (phase analysis light scattering). The sample cell used was the Malvern Folded Capillary cell
(DTS1060) of polyethylene with 1 cm of optical length and coupled with electrodes. The experiment proceeded
by titration with 51 manual injections of 10.0 µL of the Gl + (65.0 mM) into the beaker with 3.0 mL of
SDS solution (7.7 mM). After each titration, the solution was transferred to a folded capillary cell and the
measurement carried out at 298 K. Each point of ZP corresponds to the average of 5 measurements of 10 runs
each.
2.2.4. NMR NOESY experiments
NMR NOESY experiments were carried out on a Varian Mercury spectrometer at a proton resonance frequency
of 300 MHz at 298 K (25.0 ± 0.2 ◦ C). All experiments were done with 160 scans, 64 transients, 2 s relaxation
delay, 1981 Hz spectral width, and 0.4 s mixing time. In the t2- and t1-dimension the free induction decays
(FIDs) were apodised with a shifted gaussian window function prior to the Fourier transformation. The solution
used in NMR NOESY was SDS (15 mM)/Gl + (5 mM) in D 2 O obtained from Sigma-Aldrich, with isotopic
purity of deuterium > 99.8%.
250
ALVES et al./Turk J Chem
3. Results and discussion
3.1. SDS micellisation study at different Gl + concentrations
Initially, the interaction between SDS and Gl + was studied by evaluation of the effect of the Gl + cation on the
thermodynamic parameters of micellisation: cmc, enthalpy (∆mic H 0 ) , entropy (T ∆mic S 0 ) , and free energy
(∆mic G 0 ). Experiments were accomplished by measurement of enthalpy changes associated with titration of
micellar surfactant aqueous solution (105.0 mM) with different Gl + aqueous solutions at 3.0, 5.0, 10.0, and 15.0
mM, at 298.15 K.
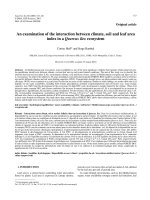
Figure 2 presents ITC experiments in terms of the enthalpy change per injection ( ∆inj H 0 ) as a function
of surfactant concentration. As can be observed, each curve exhibits an inflexion point, which was attributed
to the cmc. Moreover, the demicellisation enthalpy was calculated by the difference between the enthalpy value
on cmc, [∆inj H 0 ] cmc , from the first injection value [∆inj H 0 ] 0 , obtained in each experiment through Eq. (1):
0.40
0.35
ΔinjH / (kcal/mol)
0.30
0.25
0.20
SDS 105 mM in H2O
0.15
SDS 105 mM in Gl 3 mM
SDS 105 mM in Gl 5 mM
SDS 105 mM in Gl 10 mM
SDS 105 mM in Gl 15 mM
0.10
0
5
10
15
20
[SDS] / (mM)
Figure 2. ITC data for titration of SDS 105 mM into cell charged with different concentrations of Gl + (0, 3.0, 5.0,
10.0, and 15 mM), in water (pH 6.9) at 298.15 K.
(
0
∆dem H =
∂∆inj H 0
∂[SDS]
)
(
−
cmc
∂∆inj H 0
∂[SDS]
)
(1)
0
Before the cmc, the enthalpy corresponds to the solvation heat of monomers upon breakdown of micelles, while
after the cmc it is mainly due to dilution of micelles. Thus, the micellisation enthalpy is calculated by Eq. (2):
∆mic H 0 = −∆dem H
(2)
The free energy and entropy of micellisation were calculated using a classical pseudophase separation model
(Eqs. (3) and (4)), 9 where α is the dissociation degree calculated by conductometric titrations (Table 1). 22
251
ALVES et al./Turk J Chem
Cmc values obtained by ITC and conductometric titrations at different Gl + concentrations are given in Table
2. The observed differences are due to different physical properties probes. 9
Table 1. Angular (B), linear (A), and correlation (R) coefficients obtained from linear fitting of conductometric titrations,
before (label 1) and after (label 2) the cmc.
[GA]/mM
03
05
10
15
R1
0.99615
0.99999
0.99976
0.99974
A1
0.3658
0.5801
1.0610
1.5203
B1
0.0690
0.0501
0.0572
0.0504
R2
0.99958
0.99677
0.99626
0.99740
A2
0.6357
0.7150
1.2152
1.6354
B2
0.0321
0.0337
0.0306
0.0317
α∗
0.466
0.673
0.534
0.629
*α = B2 /B1
Table 2. Comparison of cmc values determined by ITC and conductometric titrations.
[Gl+ ]/ (mM)
cmcIT C
cmcCond
0
8.5
8.5
3
7.6
7.1
5
6.9
6.7
10
4.2
5.4
15
3.8
5.1
∆mic G0 = (2 − α)RT ln(cmc/[H2 O])
(3)
T ∆mic S 0 = ∆mic H 0 − ∆mic G0
(4)
Micellisation of SDS is very well described in the literature as a process mainly driven by entropy. The key
to understanding this entropy increase is the extensive hydrogen bonding that occurs in water. Because
water forms no hydrogen bonds with the surfactant hydrophobic tail, the latter merely occupies a cavity in
the liquid water structure and, as a result, water molecules become more ordered around the hydrocarbon
with a decrease in entropy. 7 On the formation of micelles, surfactant molecules are removed from water and
form a micellar environment, which allows the cavity to revert to the structure of bulk water. The highly
organised water structure involved in the cavity returns to normal hydrogen-bonded liquid water with an
increase in entropy. Incidentally, enhanced hydrogen bonding at the walls of the cavity largely compensates
for the breaking of hydrogen bonds to form the cavity. Thus, the low values of enthalpy are a balance
between endothermic desolvation of monomers and exothermic electrostatic attraction between Na + cations
and DS − anions groups. 7,9,23−25 Figures 3 and 4 show that cmc and ∆mic G 0 decrease as a function of the
Gl + concentration, showing an increase in the spontaneity of the process.
Adding of electrolytes is known to affect the aggregation behaviour of surfactants. In the case of ionic
surfactants, the influence of added electrolytes on their micellisation characteristics is attributed entirely to the
counter-ion effect. 26 The general conclusions are that this stabilisation occurs through electrostatic interaction
of the electrolytes with the surfactant ions in the Stern layer and with unbound counter-ions in the Gouy–
Chapman diffuse double layer. 9
Figures 5 and 6 show respectively enthalpy and entropy changes with Gl + concentration. In this work, the
micellisation enthalpy at [Gl + ] = 0 was positive (0.84 kJ/mol) 25 In the presence of increasing concentrations
of Gl + , reduction of enthalpy was observed, suggesting an increase in electrostatic interaction due to the
preferential adsorption of Gl + in the surface of micelles. This hypothesis is corroborated by an increase in
entropy, which is attributed to the desolvation of micelles upon Gl + adsorption.
252
ALVES et al./Turk J Chem
-43
9
-44
∆mic G / (KJ/mol)
8
6
o
cmc / (mM)
7
5
-45
-46
-47
4
-48
3
-2
0
2
4
6
8
10
[Gl+ ] / (m M)
12
14
-2
16
0
2
4
6
8
10
12
14
16
+
[Gl ] / (mM)
Figure 3. Plot of cmc against Gl + concentration, in
Figure 4. Plot of ∆mic G 0 against Gl + concentration,
water (pH 6.9) at 298.15 K.
in water (pH 6.9) at 298.15 K.
48.0
0.8
47.5
0.7
47.0
T∆mic S 0 / (KJ/mol)
0
∆mic H / (KJ/mol)
0.9
0.6
0.5
0.4
0.3
46.5
46.0
45.5
45.0
44.5
44.0
0.2
-2
0
2
4
6
8
10
12
14
16
-2
0
2
4
+
6
8
10
12
14
16
+
[Gl ] / (mM)
[Gl ] / (mM)
Figure 5. Plot of ∆mic H 0 against Gl + concentration, in
Figure 6. Plot of T ∆mic S 0 against Gl + concentration,
water (pH 6.9) at 298.15 K.
in water (pH 6.9) at 298.15 K.
As described in the literature, large and polarisable ions, which tend to be less hydrated, bind more
effectively to micelles. 23 Gl + is a bulky ion able to share the anionic charge of DS − groups, favouring the
micellisation more than small ions. Indeed, at cation concentration of 10 mM (Na + , Gl + ) and having Cl − as
counterion, cmc Gl+ = 4.20 mM < cmc N a+ = 5.8 mM [∗] ([*] data not shown).
3.2. Gl + inducing SDS micellisation
In order to evaluate the Gl + /SDS interactions in a stepwise way, Gl + was titrated with SDS solution at constant
concentration of 7.7 mM (around the cmc) and monitored by conductometric titrations, ITC, and ZP.
3.2.1. Conductometric titrations
Conductometric titrations were used in order to evaluate the electrostatic interactions in Gl + /SDS. Figure 7
shows the titration with Gl + 50.0 mM of 25.0 mL of SDS solution 7.7 mM, where can be observed at least 3
distinct ranges with different rates, separated by 2 concentrations named C 1 and C 2 .
253
ALVES et al./Turk J Chem
1200
+
/ µ S.cm
-1
1000
Conductivity
–1
1) k = 95.7[Gl ] + 461.7 (mS.cm )
R = 0.99984
+
–1
2) k = 88.8[Gl ] + 458.2 (mS.cm )
R = 0.99992
+
–1
3) k = 68.6[Gl ] + 569.5 (mS.cm )
R = 0.99985
1100
900
(3)
800
(2)
700
600
(1)
500
0
1
2
3
4
5
6
7
8
9
+
[Gl ] / (mM)
Figure 7. Conductometric titration of Gl + 65.0 mM into cell charged with 25.0 mL of SDS 7.7 mM at 298 K.
The first range, between 0 and 4 mM, the rate assumes its greater value, ∂ k/ ∂ [Gl + ] = 95.7 µ S.L/cm.mol.
Considering that SDS micellisation is a quite cooperative phenomenon and that at this concentration a significant
amount of micelles might exist, we attributed the behaviour in this range as micellisation induced by electrostatic
interaction of Gl + with SDS monomers. At Gl + concentration C 1 = 4 mM we think that the micellisation
process has finished.
At concentrations between C 1 = 4 and C 2 = 5.4 mM of Gl + , micellar neutralisation by Gl + is responsible
for reducing the conductivity rate (∂ k/∂ [Gl + ] = 68.6 mS.L/cm.mol).
When the concentration of Gl + reaches C 2 ≥ 5.4 mM, the conductivity rate increases again ( ∂ k/∂ [Gl + ]
= 88.8 mSL/cm.mol). After this concentration, it is thought that the surface of the micelles is saturated and
the concentration of free Gl + cations increases again.
3.2.2. Isothermal titration calorimetry of Gl + into SDS
Figure 8A shows the molar partial enthalpy of Gl + versus the concentration of Gl + (∆Gl H × [Gl + ]) at 298 K,
in the presence of SDS solution at 7.7 mM (titration curve), with similar transitions observed to the conductivity
experiments (C 1 = 3.1 mM and C 2 = 6.9 mM). Differences in C 1 and C 2 values are due to the probe used in
each analytical technique. 9 For comparison purposes, the dilution curve of Gl + in water (blank experiment) is
also presented.
According to the ∆Gl H 0 data, the process is initially endothermic. During the titration, ∆Gl H 0
becomes exothermic, suggesting competition among different phenomena. As mentioned in section 3.1, the
micellisation process has been reported to be endothermic, occurring with increases in entropy 7,9,25 Thus, the
initial endothermic values of ∆Gl H 0 can be the result of the Gl + inducing micellisation, as discussed in the
conductometric experiment. However, after the micellisation, the partial neutralisation of SDS micelles by Gl +
254
ALVES et al./Turk J Chem
cations must be an exothermic process due to the electrostatic interactions. Above 6.9 mM, the Gl + dilution
process predominates and ∆Gl H 0 is constant.
a)
b)
Gl+ 65 mM in SDS 7.7 mM
Gl+ 65 mM in H2O
0.04
Subtracted data
non linear fitting
0.08
N = 0.34 ± 0.03
K = 529 ± 56
o
ΔbH = 0.61 ± 0.06 kJ/mol
0.02
Δ GlH / (kcal/mol)
0.00
C1
o
o
ΔGlH / (kcal/mol)
0.06
C2
-0.02
o
ΔbG = -15.5 kJ/mol
o
TΔbS = 16.1 kJ/mol
0.04
0.02
-0.04
-0.06
0.00
0
2
4
6
8
10
12
14
0.0
0.3
+
[Gl ] / (mM)
0.6
0.9
1.2
1.5
1.8
+
[Gl ]/[SDS]
Figure 8. A) ITC data for titration of Gl + 65 mM into cell charged with 1.5 mL of SDS 7.7 mM, in water (pH 6.9) at
298.15 K. B) Data modelled by Wiseman isotherm after subtraction of the blank experiment.
In order to contribute to the discussion about the mechanism of Gl + /SDS interaction in comparison with
other interacting systems, we modelled the titration curve by use of the Wiseman isotherm (Eq. (5)). 27 The
analyses were performed in Microcal Origin 5.0 software (for ITC) after subtraction of the blank experiment 27−29
(
dQ
d[Gl+ ]tot
[
)
0
= ∆b H V0
1 − XR − r
1
+ √
2 2 (1 + XR − r)2 − 4XR
]
(5)
Eq. (5) relates the stepwise change in the heat of the system normalised with respect to titrant concentration
(dQ/d[Gl + ] t ) to the absolute ratio of ligand to receptor concentration (X R =[Gl + ] t /[SDS] t ). The parameters
∆b H 0 , V 0 , and r are, respectively, the molar enthalpy of binding, the effective volume of the solution in the
titration cell, and a composition variable 1/[SDS] t .K b , which is related to the equilibrium constant K b for the
binding process:
xGl+ +yDS − ⇌ [Glx : DSy]
Kb =
(x−y)
[Glx+ : DSy− ]
[Gl+ ]x [DS − ]y
(6)
(7)
By using Eqs. (8) and (9), the free energy and entropy of binding were calculated.
∆b G0 = −RT ln Kb
(8)
∆b G0 = ∆b H 0 − T ∆b S 0
(9)
255
ALVES et al./Turk J Chem
Figure 8B shows the titration curve after the subtraction of the blank experiment and the thermodynamic
parameters. As can be observed, entropy (T∆b S 0 = +16.1 kJ/mol) is the main contribution to the free energy
of the binding process, which is attributed to the desolvation caused by electrostatic adsorption of Gl + on the
micelles surface. This supposition is compatible with the positive value of enthalpy ( ∆b H 0 = +0.61 kJ/mol),
which is attributed to the breakdown of hydrogen and ion-dipole bonds during desolvation.
The binding constant obtained by this method was relatively low when compared to other highly specific
systems (K b > 20,000). 28−31 However, the value of K b = 529 is close to those found for drug binding in SDS
micelles 32,33 or in liposome systems. 34
Important information can also be obtained by analysis of stoichiometric coefficient N, which suggests
a supramolecular structure formed by 0.34 Gl + for each DS − molecule. Considering an average aggregation
number of 62 surfactant molecules per micelle of SDS, 35 it was possible to estimate the amount of 21 Gl +
molecules required to saturate a micellar solution. This value is similar to that of other SDS systems with small
molecules, as described by Waters et al 36
3.2.3. Zeta potential
The ZP reflects the electrostatic potential energy of the particles’ surface, which is influenced by the changes
in the interface with the dispersion medium. Thus it depends on the dissociation degree of the micelle and
preferential adsorption of ions. The ZP measurements are presented in Figure 9, where addition of Gl + cations
to aqueous solution of the SDS (7.7 mM) led to significant changes in ZP.
C2
C1
-40
[2]
[1]
[3]
-45
-50
ζ / mV
-55
-60
-65
-70
-75
-80
0
2
4
6
8
10
12
14
+
[Gl ] / (mM)
Figure 9. Zeta potential titration of Gl + 65.0 mM into cell charged with 25.0 mL of SDS 7.7 mM at 298 K. Measurements
recorded in folded capillary cell (DTS1060) with 1.0 cm of optical length, Malvern Standard.
During the overall range of titration, the system showed negative values of ZP, which can be explained by
the residual charge in anionic sulphate groups in the surface of the micelles, which are not entirely neutralised
by Na + or Gl + . However, 3 ranges can also be identified, in a similar way to observed in conductometric
titrations and ITC:
Range I: At the beginning, the SDS solution (7.7 mM) without Gl + presented a ZP value of –43 mV.
The ZP values become more negative with the addition of Gl + , being attributed to micellisation induced by
Gl + . New micelles contribute to the ZP becoming more negative.
256
ALVES et al./Turk J Chem
Range II: In this range of the graph, the ZP becomes less negative, as a consequence of partial neutralisation of the micelles’ surface.
Range III: After C 2 , ZP became more negative again. In this range it is expected to saturate the
assemblies’ surface, followed by an increase in Gl + ions in the bulk of the solution. Thus, reduction in ZP could
be explained by ionic exchange between Gl + (large) and Na + (small), leading to a swelling of the outer layer.
3.3. NMR NOESY
In order to evaluate the spatial topology of the SDS/Gl + assembly, NOESY experiments of the SDS(15
mM)/Gl + (5 mM) system in D 2 O at 25 ◦ C were conducted.
Figure 10 shows the contour map of NOESY, where the cross peaks indicate the proximity between nuclei
within the limit of 5 ˚
A in the space, due to electromagnetic dipolar coupling. 37−40 Cross peaks can be observed
between SDS-H1 hydrogens and H6- and H11-Gl + hydrogens, indicating that the protons are spatially close.
These results agree with ITC and ZP results, where it was proposed that Gl + cations interact with the SDS
surface. It is important to stress that no cross peak was found between Gl + hydrogens with H2-, H3-, or
H4-SDS hydrogens, suggesting that there is no penetration of hydrophilic Gl + into the core of micelles.
Figure 10. a) Expanded NOESY (300 MHz) contour map of SDS(15 mM)/Gl + (5 mM). F2 and F1 range from δ H
3.0–4.0. Experiments were performed in D 2 O at 298 K.
257
ALVES et al./Turk J Chem
4. Conclusions
The supramolecular interactions between Gl + and SDS micelles have been described. Gl + reduces the cmc as
a result of its ability to share charges in the micellar surface. Moreover, Gl + reduces the enthalpy and increases
the entropy of micellisation due to the electrostatic attraction between Gl + and DS − moieties, followed by
high desolvation. By titration of SDS solution with Gl + , it was observed that at low concentrations, Gl +
induces SDS micellisation. With the increase in Gl + concentration, neutralisation of the micellar surface is
the predominant effect, followed by the Gl + /Na + ionic exchange at high Gl + concentration. Considering
the interaction as a binding process, the low equilibrium constant suggests nonspecific adsorption with an
estimate of 20 Gl+ molecules bound in the SDS micellar surface. Thus, it may be inferred that Gl + causes
electrostatic disturbances in amphiphilic surfaces by different ways at different concentrations, before acting
on the intramembrane environment. Possibly these phenomena change the permeability of the membrane for
proteins and other biomolecules.
Acknowledgements
The authors are grateful to the Funda¸c˜
ao de Amparo `a Pesquisa do Estado de Minas Gerais (FAPEMIG:
APQ-01243-10, APQ-00645-12) and Conselho Nacional de Desenvolvimento Cient´ıfico e Tecnol´ogico (CNPq:
DT-310145/2011-2, MCT/CNPq-NANO: 550321/2012-8). This work is a collaborative research project with
members of the Rede Mineira de Qu´ımica (RMQ), who are supported by FAPEMIG.
References
1. Catuogno, C.; Jones, M. N. Colloids Surface A. 2000, 163, 165–176.
2. Cavalcanti, L. P.; Konovalov, O.; Torriani, I. L.; Haas, H. Nucl. Instrum. Meth. B 2005, 238, 290–293.
3. Duarte, A. M. S.; Wolfs, C. J. A. M.; Van Nuland, N. A. J.; Harrison, M. A.; Findlay, J. B. C.; van Mierlo, C. P.
M.; Hemminga, M. A. BBA-Biomembranes 2007, 1768, 218–227.
4. Verly, R. M.; Rodrigues, M. A.; Daghastanli, K. R.; Denadai, A. M.; Cuccovia, I. M.; Bloch, C., Jr.; Frezard, F.;
Santoro, M. M.; Pilo-Veloso, D.; Bemquerer, M. P. Peptides 2008, 29, 15–24.
5. Carrozzino, J. M.; Khaledi, M. G. J. Chromatogr. A, 2005, 1079, 307–316.
6. Charaf, U. K.; Hart, G. L. J. Soc. Cosmet. Chem. 1991, 42, 71–85.
7. Frank, H. S.; Evans, M. W. J. Soc. Cosmet. Chem. 1945, 13, 507–532.
8. Loh, W.; Teixeira, L. A. C.; Lee, L. T. J. Phys. Chem. B 2004, 108, 3196–3201.
9. Evans, D. F.; Wennerstrom, H. The Colloidal Domain: Where Physics, Chemistry, Biology, and Technology Meet.
2nd ed, Wiley-VCH: New York, NY, USA, 1999.
10. Hsu, W. L.; Li, Y. C.; Chen, H. L.; Liou, W.; Jeng, U. S.; Lin, H. K.; Liu, W. L.; Hsu, C. S. Langmuir 2006, 22,
7521–7527.
11. Wang, G. S.; Pierens, G. K.; Treleaven, W. D.; Sparrow, J. T.; Cushley, R. J. Biochemistry-US 1996, 35, 10358–
10366.
12. Moraes, L. G. M.; Fazio, M. A.; Vieira, R. F. F.; Nakaie, C. R.; Miranda, M. T. M.; Schreier, S.; Daffre, S.;
Miranda, A. BBA-Biomembranes 2007, 1768, 52–58.
13. Raquel, K. B. B.; Bugs, M. R.; Neto, A. A.; Ward, R. J. Biophys. Chem. 2007, 125, 213–220.
14. Nielsen, A. D.; Arleth, L.; Westh, P. BBA-Proteins Proteomics 2005, 1752, 124–132.
15. Nielsen, A. D.; Arleth, L.; Westh, P. Langmuir 2005, 21, 4299–4307.
258
ALVES et al./Turk J Chem
16. Herrero-Beaumont, G.; Rovati, L. C.; Castaneda, S.; Alvarez-Soria, M. A.; Largo, R., Expert Opin. Pharmacother.
2007, 8, 215–225.
17. Herrero-Beaumont, G.; Ivorra, J. A. R.; Trabado, M. D. C.; Blanco, F. J.; Benito, P.; Martin-Mola, E.; Paulino,
J.; Marenco, J. L.; Porto, A.; Laffon, A.; et al. Arthritis Rheum. 2007, 56, 555–567.
18. Altman, R. D.; Abramson, S.; Bruyere, O.; Clegg, D.; Herrero-Beaumont, G.; Maheu, E.; Moskowitz, R.; Pavelka,
K.; Reginster, J. Y. Osteoarthritis Cartilage 2006, 14, 963–966.
19. Altman, R.D.; Abadie, E.; Avouac, B.; Bouvenot, G.; Branco, J.; Bruyere, O.; Calvo, G.; Devogelaer, J.P.; Dreiser,
R.L.; Herrero-Beaumont, G.; et al. Osteoarthritis Cartilage 2005, 13, 13–19.
20. Gouze, J. N.; Gouze, E.; Popp, M. P.; Bush, M. L.; Dacanay, E. A.; Kay, J. D.; Levings, P. P.; Patel, K. R.; Saran,
J. P. S.; Watson, R. S.; et al. Arthritis Res. Ther. 2006, 8, R173–R187.
21. Bjordal, J. M.; Klovning, A.; Ljunggren, A. E.; Slordal, L. Eur. J. Pain 2007, 11, 125–138.
22. James, J.; Mandal, A. B. Colloids Surface B 2011, 84, 172–180.
23. Maiti, K.; Mitra, D.; Guha, S.; Moulik, S. P. J. Mol. Liq. 2009, 146, 44–51.
24. Singh, O. G.; Ismail, K. J. Surfactants Deterg. 2008, 11, 89–96.
25. Volpe, P. L. O.; Silva, E. A. Thermochim. Acta 1995, 257, 59–66.
26. Umlong, I. M.; Ismail, K. Colloids Surface A 2007, 299, 8–14. 27. Turnbull, W. B.; Daranas, A. H. J. Am. Chem.
Soc. 2003, 125, 14859–14866.
ˆ M. L.; Oliveira, A. M. d.; Daniel, I. M. P.; Carneiro, L.A.; Ribeiro, K. C.; Beraldo, H. d. O.; Costa,
27. Denadai, A.
K. J. R. d.; Cunha, V. C. d.; Segura, M. E. C.; et al. Supramol. Chem. 2012, 24, 204–212.
ˆ M. L.; Silva, J. G. D.; Guimar˜
28. Denadai, A.
aes, P. P. G.; Gomes, L. B. S.; Mangrich, A. S.; Rezende, E. I. P. d.;
Daniel, I. M. P.; Beraldo, H. d. O.; Sinisterra, R. D. Mat. Sci. Eng. C 2013, 33, 3916–3922.
29. Barcelo, F.; Capo, D.; Portugal, J. Nucleic Acids Res. 2002, 30, 4567–4573.
30. Barcelo, F.; Ortiz-Lombardia, M.; Portugal, J. Biochim. Biophys. Acta 2001, 1519, 175–184.
31. Maity, A.; Ghosh, P.; Das, T.; Dash, J.; Purkayastha, P. J. Colloid Interface Sci. 2011, 364, 395–399.
32. McHedlov-Petrossyan, N. O.; Timiy, K.; Vodolazkaya, N. A. J. Mol. Liq. 2000, 87, 75–84.
33. Russell, A. L.; Williams, B. C.; Spuches, A.; Klapper, D.; Srouji, A. H.; Hicks, R. P. Bioorg. Med. Chem. 2012,
20, 1723–1739.
34. Mutelet, F.; Guermouche, M. H.; Rogalski, M. Chromatographia 2003, 57, 729–733.
35. Waters, L. J.; Hussain, T.; Parkes, G. M. B. J. Chem. Thermodyn. 2012, 53, 36–41.
36. De Alvarenga, E. S.; Lima, C. F.; Denadai, A. M. L. Z. Naturforsch. A 2004, 59, 291–294.
37. Denadai, A. M. L.; Santoro, M. M.; Texeira, A. V.; Sinisterra, R. D. Mat. Sci. Eng. C 2010, 30, 417–422.
38. Lula, I.; De Sousa, F. B.; Denadai, A. M. L.; de Lima, G. F.; Duarte, H. A.; Guia, T. R. D.; Faljoni-Alario, A.;
Santoro, M. M.; de Camargo, A. C. M.; dos Santos, R. A. S.; et al. Mat. Sci. Eng. C 2012, 32, 244–253.
39. Gjerde, M. I.; Nerdal, W.; Hoiland, H. J. Colloid Interf. Sci. 1996, 183, 285–288.
259


![Báo cáo khoa học: Investigation of the interaction between the atypical agonist c[YpwFG] and MOR docx](https://media.store123doc.com/images/document/14/rc/ht/medium_57MlXT7HZ5.jpg)