A case study on in vitro investigations of the potent biological activities of wheat germ and black cumin seed oil
Bạn đang xem bản rút gọn của tài liệu. Xem và tải ngay bản đầy đủ của tài liệu tại đây (1.67 MB, 12 trang )
Turk J Chem
(2015) 39: 801 812
ă ITAK
c TUB
Turkish Journal of Chemistry
/>
doi:10.3906/kim-1502-72
Research Article
A case study on in vitro investigations of the potent biological activities of wheat
germ and black cumin seed oil
S
ă US
ă á 3 , Murat YAVUZ1,4 , Muharrem S
Didem AG
¸ ELECI˙ 1,2 , Zinar Pınar GUM
¸ ELECI˙ 1,2 ,
2
2
3
˙
Rebecca BONGARTZ , Frank STAHL , Hakan COS
¸ KUNOL , Suna TIMUR1,3,∗,
Thomas SCHEPER2
1
˙
Department of Biochemistry, Faculty of Science, Ege University, Bornova, Izmir,
Turkey
2
Institute for Technical Chemistry, Leibniz University of Hannover, Hannover, Germany
3
˙
Institute of Drug Abuse Toxicology & Pharmaceutical Sciences, Ege University, Bornova, Izmir,
Turkey
4
Department of Chemistry, Faculty of Science, Dicle University, Diyarbakır, Turkey
Received: 11.02.2015
•
Accepted/Published Online: 29.04.2015
•
Printed: 28.08.2015
Abstract: The objectives of this study were to investigate the potential biological activities of black cumin seed oil
(BCSO) and wheat germ oil (WGO) on different cell lines. Initially, commercially available BCSO and WGO obtained
by supercritical carbon dioxide extraction were analyzed in terms of tocopherol, aliphatic alcohols, and thymoquinone
content via HPLC and GC analysis. Cell free antioxidant activities and total phenolic content of both oils were detected
by DPPH assay and Folin–Ciocalteu method, respectively. As well as the DPPH assay, the protective effect against
reactive oxygen species (ROS) was determined by microscopic observation of ROS generation in NIH-3T3 cells with or
without oil samples by using an oxidation-sensitive fluorescent dye, H2DCFDA. Cytotoxicity was assessed using an MTT
assay. In the case of BCSO, after exposing cells to 0.025–1.0 mg/mL and 1.0–100 µ g/mL concentrations for 24 h, the
IC 50 values of BCSO were 0.58, 0.51, 0.47, and 0.36 mg/mL for NIH-3T3, A549, U87, and HeLa cells, respectively. On
the other hand, concentrations of WGO lower than 0.1 mg/mL did not cause a decrease in cell viability for all cell lines.
Apoptotic and necrotic rates of these cell lines were investigated via flow cytometry. BCSO also exhibited proliferative
efficacy for NIH-3T3 cells.
Key words: Black cumin seed oil, wheat germ oil, cell culture investigations
1. Introduction
Oils are very important in the food industry and essential for human nutrition. Solvent extraction is a general
method for extraction of oils from vegetable substance. Supercritical fluid extraction (SFE) is an alternative
to the usual methods and has many advantages over them. It is applicable at low temperature, and allows
easy separation with environmentally friendly fluids in a short time. 1,2 Carbon dioxide (CO 2 ) is the most
frequently used supercritical solvent in the food and pharmaceutical industries due to its low toxicity, good
safety, cheapness, and low critical temperature and pressure. 3,4 Use of CO 2 as a supercritical fluid for extraction
of wheat germ oil (WGO) and black cumin seed oil (BCSO) has previously been reported by several research
groups. 5−7
Reactive oxygen species (ROS), which are formed under physiological conditions such as in the electron
∗ Correspondence:
801
˘ S
AG
¸ ELECI˙ et al./Turk J Chem
transport system, cause cell damage. Vitamins E, A, C, and β -carotene are natural antioxidants against ROS. 8
Natural antioxidant sources are advantageous in comparison with synthetic antioxidants. Wheat germ is one of
the richest natural sources of alpha tocopherol, possessing vitamin E activity and a number of health benefits.
Vitamin E protects the body from oxidative processes as a result of ROS damage. Paranich and coworkers
reported that oral implementation of WGO saturates the body of rats with vitamin E and WGO intake results
in a change in the intensity of lipid peroxidation processes. 9 Vitamin E can be given as a nutritional supplement
to reduce oxidative stress. Bansal et al. investigated the protective role of vitamin E pre-treatment on N nitrosodiethylamine; it reduced the degree of oxidative stress and induced lipid peroxidation and antioxidant
enzyme activities in rat liver. 10 Furthermore, wheat and WGO are good sources of policosanol, which is the
common name that refers to a mixture of long chain (20–36 carbon) aliphatic primary alcohols. 11 The mixture
contains mainly docosanol (C22), tetracosanol (C24), hexacosanol (C26), octacosanol (C28), and triacontanol
(C30). These compounds have been reported to inhibit lipid peroxidation and to improve protection of both
the lipid and the protein moieties of lipoproteins against lipid peroxidation. 12 Additionally, 1-triacontanol was
found to be a plant growth promoter and an anti-inflammatory substance, 13,14 whereas 1-octacosanol exhibited
ergogenic, neurological, and antioxidant properties. 15
Black cumin seed (BCS) is one of the most investigated herbs among various medicinal plants. It
has a wide spectrum of therapeutic potential such as anti-inflammatory, 16 antitumor, 17,18 antimicrobial, 19
antifungal, 20 and antioxidant effects. 21 Thymoquinone (TQ) is a major component of BCS and has therapeutic
activities. Several papers have reported that TQ was able to repress different carcinomas such as liver, colorectal,
breast, and prostate carcinoma. 22 Moreover, many studies reported that BCS and TQ have an antioxidant effect
due to radical scavenging activity. 23,24
Here, we described a combination of various assays to evaluate the protective effect of WGO and BCSO
extracts on oxidative damage using supercritical CO 2 as an extraction fluid. Chromatographic analyses as
well as cell culture assays were successfully applied and this could be a promising route for the evaluation of
biological activities of different functional foods depending of their content.
2. Results and discussion
2.1. Quantification of thymoquinone, tocopherol, and aliphatic alcohols
TQ, tocopherols, and aliphatic alcohols of the BCSO and WGO were analyzed by HPLC-DAD, HPLC-FLD,
and GC-FID systems. The quantitative results of the TQ, tocopherols, and aliphatic alcohols for WGO and
BCSO are given in Tables 1 and 2, respectively. Alpha tocopherols and aliphatic alcohols were active ingredients
of WGO and TQ was the main component of BCSO.
2.2. Assays for total phenolic contents and DPPH radical scavenging activity
A comparative study on the antioxidant properties of WGO and BCSO was performed. The antioxidant capacity
of seed oil extracts was determined by evaluating total phenolic contents and 1,1-diphenyl-2-picrylhydrazyl
(DPPH) free radical scavenging activity.
The absorbance values of the WGO and BCSO, reacted with Folin–Ciocalteu reagent, were compared with
those of the standard solutions of gallic acid equivalents (GAE) described in the Experimental section. Results
of the colorimetric analysis of total phenolics were estimated as WGO 3.41 ± 0.19 (mg GAE /g oil extract) and
BCSO 1.95 ± 0.03 (mg GAE /g oil extract). The high phenolic content of the WGO may be responsible for
802
˘ S
AG
¸ ELECI˙ et al./Turk J Chem
Table 1. Tocopherol and aliphatic alcohol compositions of WGO.
Component/oil
Alpha tocopherol (µg/g)
Beta tocopherol (µg/g)
Gamma tocopherol(µg/g)
Total tocopherol (µg/g)
Docosanol (C22) mg/kg
Tetracosanol (C24) mg/kg
Hexacosanol (C26) mg/kg
Octacosanol (C28) mg/kg
Total alcohols mg/kg
Wheat germ oil
2482.5
958.5
76.6
3517
8.4
8.0
63.7
12.3
92.4
Table 2. TQ content and tocopherol composition of BCSO.
Component/oil
Thymoquinone (µg/g)
Alpha tocopherol (µg/g)
Beta tocopherol (µg/g)
Gamma tocopherol(µg/g)
Total tocopherol (µg/g)
Black cumin seed oil
4478
35.9
0
202.1
238
the antioxidant activity of WGO. Some reports have indicated that there is a positive correlation between total
phenolic compounds and free radical scavenging potential. 25 In addition, the health benefit of natural products
is dependent on the contents of their phenolic compounds. 26 Hence, WGO may be recommended as a source
of plant-based antioxidants that are healthy alternatives to synthetic antioxidants. 27 These antioxidants may
protect the cells against the effects of free radicals as well as lipid peroxidation of food products.
Due to its simplicity and stability, and the short time required for analysis, the DPPH radical scavenging
assay is a widely used method to test the antioxidant activity of samples. Basically, the antioxidant capacity
of the samples determined by the DPPH free radical scavenging activity assay is the activity of quenching free
radicals, or the H-donor capability of the antioxidant. Therefore, the antioxidant potentials can be determined
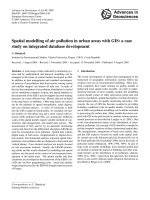
through the discoloration of the mixture using a spectrophotometer. 28 Figure 1 shows the DPPH radical
scavenging activity of WGO and BCSO at various concentrations (2.0 to 16.0 mg/mL). As positive controls, BHA
and BHT were also examined at 1.25–50 µ g/mL concentrations. The DPPH assay of commercially available
WGO and BCSO was also studied at 10–1000 µ g/mL concentrations, but the expression of the obtained results
was not meaningful. WGO showed the highest radical scavenging activity through all concentrations for the
DPPH assay. BCSO showed slightly less radical scavenging activity. Significant differences in DPPH scavenging
activities were observed between BCSO (35.3%) and WGO (91.3%) at a concentration of 6.0 mg/mL and BHT
(51.3%) and BHA (83.9%) at a concentration of 10 µg/mL. The observed radical scavenging activity and total
phenolic contents for WGO and BCSO are in good alignment. This correlation has been reported to be present
in natural oils, which is very important for the oxidative stability of polyunsaturated fatty acids (PUFA). 29
WGO and BCSO displayed lower radical scavenging activity than did BHA and BHT, the most commonly
used synthetic antioxidants, as positive controls. However, in view of recent reports on the carcinogenicity and
toxicity of these synthetic antioxidants, their application as a food additive is not encouraged. 30−32
803
˘ S
AG
¸ ELECI˙ et al./Turk J Chem
DP P H ra d ic a l s c a ve n g in g a c t ivit y (%)
100
WGO
BCSO
80
60
40
20
0
0
5
10
15
Concentration (mg/mL)
Figure 1. DPPH radical scavenging activities of wheat germ oil (WGO) and black cumin seed oil (BCSO). Values are
the mean ± SD of the data (n = 3).
2.3. Cytotoxicity
Previous studies indicated anticancer activity of BCS against different cell lines. 33,34 Recently, Al-Sheddi et
al. demonstrated that seed extract and seed oil of black cumin significantly reduced the cell viability of a
human lung cancer cell line. 18 In the present study the cytotoxicity of BCSO was assessed by MTT assay, after
exposure of the cells to 1.0–100 µ g/mL and 0.025–1.0 mg/mL BCSO for 24 h. Cytotoxicity data obtained from
(
)
1
the MTT assays were extrapolated using the exponential equation y = 1 −
×
(b
−
x)
, where a is the
1 + ea
slope, b is IC 50 (50% inhibitory concentration), and x is the concentration of the sample. The IC 50 values of
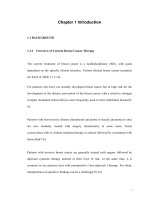
BCSO were 0.58, 0.51, 0.47, and 0.36 mg/mL for NIH-3T3, A549, U87, and HeLa cells, respectively. The results
showed that BCSO induced significant decreases in cell viability of cancer cells in a concentration-dependent
manner (Figures 2A–2D). The highest cytotoxic effect was observed for HeLa cells. However, BCSO had less
cytotoxic potential against normal NIH-3T3 cells. In the case of lower concentrations of BCSO a proliferative
effect was observed on NIH-3T3 cells (Figure 3).
WGO had no significant effect on the cell viability of A549 and U87 cells. On the other hand, NIH-3T3
and HeLa cells showed a statistically significant (P < 0.001) decrease in cell viability at a concentration of 1.0
mg/mL WGO (Figure 4). The concentrations of WGO of 0.1 mg/mL and lower did not show a decrease in the
cell viability of all cell lines.
2.4. Flow cytometry
TQ induces apoptosis in various human cancer cells, such as neoplastic keratinocytes, colorectal cancer cells,
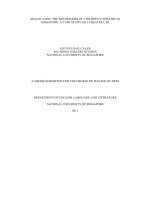
breast adenocarcinoma, and ovarian adenocarcinoma cells. 35,36 As demonstrated in Figure 5A, treatment with
BCSO induced a greater level of apoptosis (38.5%) and necrosis (34.2%) in A549 cells. Necrotic and apoptotic
rates in 0.5 mg/mL BCSO-treated HeLa cells were 66.7% and 8.9%, respectively (Figure 5B), and 69.8% of U87
cells were detected as necrotic after incubation with BCSO (Figure 5C). The anticancer effect of BCSO can be
804
˘ S
AG
¸ ELECI˙ et al./Turk J Chem
A)
Theo.
Exp .
1.0
1.0
0.8
Normalized viability
Normalized viability
0.8
0.6
0.4
0.2
0.0
0.6
0.4
0.2
0.0
0.1
1
0.1
Concentrations (mg/mL)
1
Concentrations (mg/mL)
Theo.
Exp .
C ) 1.0
Theo.
Exp.
D ) 1.0
0.8
0.8
Normalized viability
Normalized viability
Theo.
Exp.
B)
0.6
0.4
0.2
0.6
0.4
0.2
0.0
0.0
0.1
1
0.1
Concentrations (mg/mL)
1
Concentrations (mg/mL)
Figure 2. Dose-dependent cytotoxic effects of BCSO on viability of A549 (A), HeLa (B), U87 (C), and NIH-3T3 (D).
Green dotted line represents point of significant cytotoxicity (70% viability). Values are the mean ± standard deviation
of the data (n = 4).
****
BCSO
140
WGO
NIH-3T3 cells
A-549 cells
U87 cells
HeLa cells
100
**
*
120
* **
** ***
***
Cell viability (%)
Cell viability (%)
80
100
80
60
40
60
40
20
20
0
0
1 µg/mL
5 µg/mL
10 µg/mL
25 µg/mL
50 µg/mL
100 µg/mL
Concentrations
0.025 mg/mL 0.05 mg/mL
0.1 mg/mL
0.25 mg/mL
0.5 mg/mL
1.0 mg/mL
Concentrations
Figure 3. Dose-dependent cytotoxic effects of BCSO and
WGO on viability of NIH-3T3 cells. Each bar represents a
Figure 4. Dose-dependent cytotoxic effects of WGO on
mean ± SD (n = 4). Asterisks show significant differences
= 4). Asterisks show significant differences from control
from control values (*P < 0.05; **P < 0.01; ***P <
values (*P < 0.05; **P < 0.01; ***P < 0.001).
0.001).
viability of cell lines. Each bar represents a mean ± SD (n
805
˘ S
AG
¸ ELECI˙ et al./Turk J Chem
Figure 5. Apoptotic and necrotic cells were detected by flow cytometry using Annexin V and propidium iodide (PI)
staining. A) A549 cells, B) HeLa cells, and C) U87 cells. Cells in the lower left quadrant (Annexin VFITC–/PI–)
are viable, those in the lower right quadrant (Annexin VFITC+/PI–) are apoptotic, those in the upper left quadrants
(Annexin VFITC–/PI+) are necrotic, and those in the upper right quadrants (Annexin VFITC+/PI+) are late apoptotic
or necrotic.
806
˘ S
AG
¸ ELECI˙ et al./Turk J Chem
ascribed to the content of BCSO with high amounts of TQ. 18,37 WGO has no significant effects in A549 and
U87 cells. Apoptotic and necrotic rates of these cell lines were the same as in nontreated cells. In the case of
HeLa cells, WGO treatment induced a drop in apoptotic rates to 2.7%. These results are in good agreement
with the cytotoxicity results.
2.5. Protective effect against reactive oxygen species
The level of ROS generation in NIH-3T3 cells with/without BCSO and WGO was compared using an oxidationsensitive fluorescent dye, H2DCFDA. Treatment of TBHP caused generation of intracellular ROS in NIH-3T3
cells that was evidenced by a large number of H2DCFDA positive cells (Figure 6A). In contrast, nontreated
cells were all H2DCFDA negative (Figures 6B and 6C). On the other hand, BCSO and WGO both prevented
ROS generation in TBHP-treated cells (Figures 6D–6G).
Figure 6. Fluorescence microscopy images of A) positive control: cells were treated with working solution of TBHP
(carboxy-H2DCFDA staining), B) negative control: nontreated cells (DAPI staining), C) negative control: nontreated
cells (carboxy-H2DCFDA staining), D) BCSO: cells were treated with working solution of TBHP and 0.1 mg/mL BCSO
(DAPI staining), E) BCSO: cells were treated with working solution of TBHP and 0.1 mg/mL BCSO (carboxy-H2DCFDA
staining), F) WGO: cells were treated with working solution of TBHP and 0.1 mg/mL WGO (DAPI staining), G) WGO:
cells were treated with working solution of TBHP and 0.1 mg/mL WGO (carboxy-H2DCFDA staining).
2.6. Cell proliferation
In the CellTiter-Blue Cell Viability Assay the dye resazurin was used to observe the metabolic activity of cells.
Viable cells are able to reduce resazurin to resorufin, which is a highly fluorescent dye. The fluorescence signal
is proportional to the number of metabolic active cells. The cell amount of NIH-3T3 increases in the case
of treatment with BCSO and is comparable to the untreated cells. However, no changes were observed with
WGO treatment on NIH-3T3 cells (Figure 7). Similar results were obtained by Benhaddou-Andaloussi et al.,
807
˘ S
AG
¸ ELECI˙ et al./Turk J Chem
who investigated the effect of BCS extract on pancreatic β -cell proliferation. BCS ethanol extract induced
proliferation of pancreatic β -cells. 38
Nontreated cells
1000
BCSO
Absorbance (570 nm/630 nm)
WGO
800
600
400
200
0
10
20
30
40
50
60
70
Duration of cultivation (h)
Figure 7. Proliferative effect of BCSO and WGO on NIH-3T3 cells.
In summary, the content of tocopherol, aliphatic alcohols, and TQ in WGO and BCSO was analyzed by
HPLC and GC. The DPPH radical scavenging assay and Folin–Ciocalteu method were used for assaying the
cell free antioxidant activities and TPC of both oils, respectively. The anticancer effects of BCSO and WGO
were examined by MTT assay and flow cytometry analyses. The protective effect against ROS was observed by
fluorescence microscopy using the oxidation-sensitive fluorescent dye H2DCFDA in NIH-3T3 cells with/without
oil samples. The obtained results indicated that BCSO and WGO both had antioxidant effects on NIH-3T3 cells
because of containing high amounts of TQ and tocopherol, respectively. BCSO was more toxic to cancer cells in
comparison with healthy cells and induced apoptosis and necrosis. Moreover, when used at lower concentrations
of BCSO, a proliferative effect was observed on NIH-3T3 cells.
3. Experimental
3.1. Materials
BCSO and WGO obtained by supercritical CO 2 extraction (SCE) were kindly donated from TABIA (Turkey).
Cell culture supplies including fetal calf serum (FCS Gold) and penicillin/streptomycin (P/S, 100×) were
purchased from Biochrom AG. Dulbecco’s Modified Eagle’s medium (DMEM) and 4,6-diamino-2-phenylindol
(DAPI) were purchased from Sigma-Aldrich. Phosphate buffer saline (PBS) was prepared with 137 mM sodium
chloride, 2.7 mM potassium chloride, 10.1 mM disodium hydrogen phosphate, and 1.8 mM potassium dihydrogen
phosphate, pH 7.4; all chemicals were also provided by Sigma Aldrich. Sodium dodecyl sulfate (SDS) was ordered
from Applichem. All other chemicals were of analytical grade.
3.2. Detection of aliphatic alcohols
The aliphatic alcohols method was introduced into the International Olive Oil Council 39 trade standard. The
method describes a procedure for determination of the aliphatic alcohols (C22, C24, C26, and C28) content
of fatty substances. The aliphatic alcohols were analyzed by gas chromatography-flame ionization detector
(GC-FID). The Agilent 7890B GC-FID system consisted of a G4513A auto-liquid sampler and HP-5 capillary
808
S
AG
á ELECI et al./Turk J Chem
column (0.25 à m particle size, 0.25 mm internal diameter, and 30 m length). The temperature program for
the GC was as follows: initial temperature, 180 ◦ C held for 8 min, linear gradient of 5 ◦ C min 260 ◦ C held
for 15 min. The injector temperature was 280 ◦ C and injection was performed in the split mode (1:50). The
injection volume was 1.0 µ L. Hydrogen was used as carrier gas, 30 cm/s. The contents of each aliphatic alcohol,
expressed in mg/1000 g fatty substance, were calculated according to the literature. 39
3.3. Thymoquinone and tocopherol quantification
Quantification of the TQ in BCSO was achieved using an Agilent 1100 RP-HPLC system consisting of a gradient
pump, a DAD detector, and a C18 column (Agilent Eclipse column XDB-C18 (5.0 à m particle size, 4.6 ì 150
mm)). Quantitative analysis was based on the peak areas. Detection and quantification were carried out at 254
nm. The column temperature was 25 ◦ C. The mobile phase consisted of methanol:water:methyl tert-butyl ether
(46:42:12 v/v/v) with a flow rate of 1.0 mL/min. To detect TQ in the BCSO, 0.1 g of BCSO was dissolved in
10 mL of hexane, vortexed for 1 min, and filtered; then 20 µL was injected into the HPLC system. Tocopherols
were determined according to the AOCS Lipid Library. 40 Separation and quantification were carried out on a
Agilent NP-HPLC using silica columns. The system used consisted of a gradient pump and an FLD detector
with a LiChrosorb SI 60 column (5 µ m, 4.6 × 150 mm). The excitation and emission wavelengths were 290 nm
and 330 nm, respectively. Hexane:2-propanol (99:1) was used as mobile phase for α -tocopherol, β -tocopherol,
γ -tocopherol, and δ -tocopherol at a flow rate of 0.8 mL/min. In the assay, 0.5 g of BCSO and WGO was
dissolved in 10 mL of hexane, vortexed for 1 min, and filtered; then 20 µ L was injected into the HPLC system
at 25 ◦ C.
3.4. DPPH radical scavenging assay
The antioxidant activities of WGO and BCSO were evaluated by DPPH radical scavenging assay, which was
originally described by Blois 41 with a slight modification by Guler et al. 42 First 0.2 mM DPPH solution in
ethanol was prepared and 1.0 mL of this solution was added to 1.0 mL of various concentrations (2.0 to 16.0
mg/mL) of WGO and BCSO samples dissolved in ethanol to be tested. The reference butylated hydroxyanisol
(BHA) and butylated hydroxytoluene (BHT) dissolved in ethanol (final concentration were 1.25 to 50 µ g/mL)
were used as reference test materials. The test samples and reference solutions were added to different test
tubes. After 30 min at room temperature in the dark, absorbance was measured at 517 nm by UV-Vis
spectrophotometer (Thermo Fischer, EVO 60 Model, Madison, WI, USA). All tests were performed in triplicate.
The scavenging activity (%) was calculated as follows:
[
DPPH radical scavenging activity(%) =
]
(A0 − A1 )
× 100,
A0
where A 0 was the integral intensity of the DPPH signal of the control sample and A 1 was the integral intensity
after the addition of the studied extract concentration to the control sample.
3.5. Determination of total phenolic contents
The Folin–Ciocalteu method was used for the determination of the total phenolic content (TPC) of WGO and
BCSO. 43,44 TPCs in the oil extracts were determined by UV-Vis spectrophotometer, according to a calorimetric
oxidation/reduction reaction. Folin–Ciocalteau reagent (2.0 N, 200 µ L) was mixed with 1160 µ L of distilled
809
S
AG
á ELECI et al./Turk J Chem
water and 40 à L of oil extract. The reaction was carried out for 5 min in the dark. Then 600 µ L of sodium
carbonate (20%) was added. The reaction mixture was incubated at 40 ◦ C for 30 min in a water bath and
centrifuged at 2000 × g for 10 min. The supernatant absorbance was measured by a UV-Vis spectrophotometer
at 765 nm. Gallic acid was used to plot the calibration curve for calculation. TPC was standardized against
gallic acid (GA), and the results were expressed in mg GA equivalent (GAE)/g oil extract. Analyses were
conducted in triplicate, and the TPCs were calculated by the following equation, which was obtained using a
standard GA curve (R 2 = 0.996):
A 760 nm = 0.0027 × [GAE].
3.6. Cell culture studies
A549 (lung cancer cells), U87 (human glioblastoma cells), HeLa (cervical cancer cells), and NIH-3T3 (normal
mouse fibroblast cells) cell lines were provided from the German Collection of Microorganisms and Cell Cultures
(DSMZ). All cells were grown in DMEM containing 10% FCS and 1.0% P/S. The cells were cultivated in medium
and incubated with samples and reagents at 37 ◦ C in a humidified environment with 5.0% CO 2 .
3.7. Cytotoxicity assay
3-(4,5-Dimethylthiazol-2-yl)-2,5-diphenyl tetrazolium bromide (MTT) assays were used to determine the dosedependent cytotoxicity effect of oils on A549, U87, HeLa, and NIH-3T3 cells. Cells were seeded out in 96well-tissue plates and cultivated for 3 days. Then the cells were washed once in PBS and treated with oils at
0.025, 0.05, 0.1, 0.25, 0.5, and 1.0 mg/mL concentrations and also 1.0, 5.0, 10, 25, 50, and 100 µ g/mL for 24
h. Samples were removed and cells were incubated in 110 µL/well 10% MTT solution (5.0 mg/mL PBS) in
medium for 4 h. Subsequently 100 µ L of SDS solution (1.0 g of SDS in 10 mL of 0.01 M HCl) was added
per well and after 24 h of incubation UV-Vis absorption was measured at 570 nm with 630 nm as reference
wavelength using a microplate reader Model 680 (BioRad).
3.8. Flow cytometry analysis using annexin V and PI double staining
For flow cytometry studies the cells were harvested by accutase treatment, washed once in ice-cold PBS, and
collected. Subsequently cells were treated for 2 h with 0.5 mg/mL BCSO and WGO and treated cells were tested
using the Annexin V-FLUOS staining kit (Roche Diagnostics GmbH, Mannheim, Germany). Briefly, cells were
incubated in 100 µL of incubation buffer including 2.0 µ L of Annexin fluorescein isothiocyanate (FITC) and
2.0 µ L of propidium iodide for 15 min. The stained cells were then analyzed in a COULTER EPICS XL-MCL
flow cytometer.
3.9. Protective effect against reactive oxygen species
The Image-iT LIVE Green Reactive Oxygen Species (ROS) Detection Kit (Invitrogen) was used to evaluate
the protective effect of BCSO and WGO on NIH-3T3 cells. The assay is based on 5-(and-6)-carboxy-2 ′ ,7 ′ dichlorodihydrofluorescein diacetate (carboxy-H2DCFDA), a reliable fluorogenic marker for ROS in live cells.
NIH-3T3 cells were grown to confluence in 96-well plates and incubated for 90 min with 100 µ M tert-butyl
hydroperoxide (TBHP) working solution in the presence or absence of 0.1 mg/mL BCSO and WGO. After
removing the samples, cells were treated with 25 µM carboxy-H2DCFDA solutions and were incubated for 30
810
˘ S
AG
¸ ELECI˙ et al./Turk J Chem
min at 37 ◦ C, protected from light. Cells were washed with PBS and DAPI fluoroshield was dropped on them.
Finally images were taken using a fluorescence microscope, Olympus IX50, equipped with an Olympus SC30
camera.
3.10. Cell proliferation
In the cell proliferation assay, the untreated NIH-3T3 cells were applied as a control and a 4-fold determination
was studied for each sample. BCSO and WGO at 100 µ g/mL concentration were added to the wells in triplicate.
Cells were cultivated for 3 h (time for adherence), 24 h, 48 h, and 72 h. At the end of each cultivation time,
cells were treated with 20 µ L of CellTiter-Blue Reagent per 100 µ L of medium for 4 h. Fluorescence (544
nmEx/590 nmEm) was measured using the Fluoroskan Ascent fluorescence plate reader (Thermo Scientific).
3.11. Statistical analysis
All experiments were repeated 4 times. Statistical analysis was carried out with the GraphPad Prism 6 statistical
software. One-way analysis of variance (ANOVA) was performed with Tukey’s test for multiple comparisons in
statistical evaluation. The difference between two groups was considered to be significant when the P value was
less than 0.05.
Acknowledgments
The authors thank TABIA for providing black cumin seed oil and wheat germ oil. The Konrad Adenauer
Foundation is acknowledged for financial support of PhD student Didem A˘g S¸eleci. The authors also thank
˙
SEM (Izmir)
for their support during the HPLC and GC analysis.
References
1. Luque de Castro, M. D.; Valcarcel, M. T.; Maria T. In Analytical Supercritical Fluid Extraction; Luque de Castro,
M. D.; Valcarcel, M. T.; Maria T., Eds. Springer-Verlag: Berlin, Heidelberg, Germany, 1994, pp. 79–168.
2. Reverchon, E.; De Marco, I. J. Supercrit. Fluid. 2006, 38, 146–166.
3. Dugo, P.; Mondello, L.; Bartle, K. D.; Clifford, A. A.; Breen, D.; Dugo, G. Flavour Frag. J. 1995, 10, 51–58.
4. Salgin, U.; Korkmaz, H. J. Supercrit. Fluid. 2011, 58, 239–248.
5. Panfili, G.; Cinquanta, L.; Fratianni, A.; Cubadda, R. J. Am. Oil Chem. Soc. 2003, 80, 157–161.
6. Eisenmenger, M.; Dunford, N. T. J. Am. Oil Chem. Soc. 2008, 85, 55–61.
7. Solati, Z.; Baharin, B. S.; Bagheri, H. Ind. Crop. Prod. 2012, 36, 519–523.
8. Frei, B. Am. J. Med. 1994, 97, S5–S13.
9. Paranich, V. A.; Cherevko, O. I.; Frolova, N. A.; Paranich, A. V. Lik. Sprava 2000, 2, 40–44.
10. Bansal, A. K.; Bansal, M.; Soni, G.; Bhatnagar, D. Chem-Biolog. Interact. 2005, 156, 101–111.
11. Irmak, S.; Turgut Dunford, N.; Milligan, J. Food Chem. 2006, 95, 312–318.
12. Menendez, R.; Fernandez, S. I.; Del Rio, A.; Gonzalez, R. M.; Fraga, V.; Amor, A. M.; Mas, R. M. Biol. Res.
1994, 27, 199–203.
13. Houtz, R. L.; Ries, S. K.; Tolbert, N. E. Plant Physiol. 1985, 79, 365–370.
14. McBride, P. T.; Clark, I. M.; Krueger, G. G. J. Invest. Dermatol. 1987, 89, 380–383.
15. Ohia, Y.; Ohashi, K.; Matsura, T.; Tokunaga, K.; Kitagawa, A.; Yamada, K. J. Clin. Biochem. Nutr. 2008, 42,
118–125.
811
˘ S
AG
¸ ELECI˙ et al./Turk J Chem
16. Chehl, N.; Chipitsyna, G.; Gong, Q.; Yeo, C. J.; Arafat, H. A. HPB (Oxford) 2009, 11, 373–381.
17. Ahmad, D.; Abulkhair, O.; Nemenqani, D.; Tamimi, W. Asian Pac. J. Cancer Prev. 2012, 13, 5839–5842.
18. Al-Sheddi, E. S.; Farshori, N. N.; Al-Oqail, M. M.; Musarrat, J.; Al-Khedhairy, A. A.; Siddiqui, M. A. Asian Pac.
J. Cancer Prev. 2014, 15, 983–987.
19. Bakathir, H. A.; Abbas, N. A. Afr. J. Tradit. Complement. Altern. Med. 2011, 8, 159–164.
20. Halamova, K.; Kokoska, L.; Flesar, J.; Sklenickova, O.; Svobodova, B.; Marsik, P. J. Food Prot. 2010, 73, 2291–
2295.
21. El Shenawy, N. S.; Soliman, M. F.; Reyad, S. I. Rev. Inst. Med. Trop. S˜
ao Paulo 2008, 50, 29–36.
22. Woo, C. C.; Kuma, A. P.; Sethi, G.; Tan, K. H. B. Biochem. Pharmacol. 2012, 83, 443–451.
23. Badary, O. A.; Taha, R. A.; Gamal El-Din, A. M.; Abdel-Wahab, M. H. Drug Chem. Toxicol. 2003, 26, 87–98.
24. Schneider-Stock, R.; Fakhoury, I. H.; Zaki, A. M.; El-Baba, C. O.; Gali-Muhtasib, H. U. Drug Discov. Today 2014,
19, 1830.
25. Ertaás, A.; Bo
ga, M.; Haásimi, N.; Yeásil, Y.; Gă
oren, A. C.; Top¸cu, G.; Kolak, U. Turk. J. Chem. 2014, 38, 592599.
ă I.
Turk. J. Chem. 2006, 30, 483494.
26. C
á akr, A.; Mavi, A.; Kazaz, C.; Yldrm, A.; Kă
ufrevio
glu, O.
27. Kizil, M.; Kizil, G.; Yavuz, M.; Ceken, B. Acta Aliment. 2010, 39, 457–470.
28. Adnan, L.; Osman, A.; Hamid, A. A. Int. J. Food Prop. 2011, 14, 1171–1181.
29. Hassanien, M. F. R.; Mahgoub, S. A.; El-Zahar K. M. Saudi J. Biol. Sci. 2014, 21, 280–288.
30. Kahl, R.; Kappus, H. Z. Lebensm. Unters. Forsch. 1993, 196, 329–338.
31. Kizil, G.; Kizil, M.; Yavuz, M.; Emen, S.; Hakimoglu, F. Pharm. Biol. 2008, 46, 231–242.
32. Baris, D.; Kizil, M.; Aytekin, C.; Kizil, G.; Yavuz, M.; Ceken, B.; Ertekin, A. S. Int. J. Food Prop. 2011, 14,
339–355.
33. Bourgou, S.; Pichette, A.; Marzouk, B.; Legault, J. J. Food Biochem. 2012, 36, 539–546.
34. Mbarek, L. A.; Mouse, H. A.; Elabbadi, N.; Bensalah, M.; Gamouh, A.; Aboufatima, R.; Benharref, A.; Chait, A.;
Kamal, M.; Dalal, A.; et al. Braz. J. Med. Biol. Res. 2007, 40, 839–847.
35. Gali-Muhtasib, H. U.; Abou Kheir, W. G.; Kheir, L. A.; Darwiche, N.; Crooks, P. A. Anti-Cancer Drug. 2004, 15,
389–399.
36. Shoieb, A. M.; Elgayyar, M.; Dudrick, P. S.; Bell, J. L.; Tithof, P. K. Int. J. Oncol. 2003, 22, 107–113.
37. Sakalar, C.; Yuruk, M.; Kaya, T.; Aytekin, M.; Kuk, S.; Canatan, H. Mol. Cell. Biochem. 2013, 383, 243–251.
38. Benhaddou-Andaloussi, A.; Martineau, L. C.; Spoor, D.; Vuong, T.; Leduc, C.; Joly, E.; Burt, A.; Meddah, B.;
Settaf, A.; Arnason, J. T.; et al. Pharm. Biol. 2008, 46, 96–104.
39. COI. International Olive Oil Council, COI/T.20/Doc. no.26, Madrid 2003.
40. Lampi, A. M. Am. Oil Chem. Soc. Lipid Library 2011.
41. Blois, M. S. Nature 1958, 181, 1199–1200.
42. Guler, E.; Barlas, F. B.; Yavuz, M.; Demir, B.; Gumus, Z. P.; Baspinar, Y.; Coskunol, H.; Timur, S. Colloid.
Surface. B 2014, 121, 299–306.
43. Singleton, V. L.; Orthofer, R.; Lamuela-Raventos, R. M. Method. Enzymol. 1999, 299, 152178.
ă urk, M.; Kuásman, T.; Barla Demirkoz, A. A.; Kolak, U.; Ulubelen, A. Turk. J. Chem. 2013, 37,
44. Topácu, G.; Oztă
619632.
812


![Effect of photoperiod on in vitro culture of Guggul [Commiphora wightii (Arnott)] – A medicinal plant](https://media.store123doc.com/images/document/2020_01/14/medium_rht1579001269.jpg)