An application of coacervate-based extraction for the separation and preconcentration of cadmium, lead, and nickel ions prior to their determination by flame atomic absorption
Bạn đang xem bản rút gọn của tài liệu. Xem và tải ngay bản đầy đủ của tài liệu tại đây (115.41 KB, 9 trang )
Turk J Chem
(2016) 40: 979 987
ă ITAK
c TUB
Turkish Journal of Chemistry
/>
doi:10.3906/kim-1605-80
Research Article
An application of coacervate-based extraction for the separation and
preconcentration of cadmium, lead, and nickel ions prior to their determination
by flame atomic absorption spectrometry in various water samples
˙
˙ ∗
Anies Awad SATTI, Ilknur
DURUKAN TEMUGE, Sema BEKTAS
¸, C
¸ i˘
gdem ARPA S
¸ AHIN
Department of Chemistry, Faculty of Science, Hacettepe University, Ankara, Turkey
Received: 31.05.2016
•
Accepted/Published Online: 13.07.2016
•
Final Version: 22.12.2016
Abstract: Cloud point extraction (CPE), which is the most popular coacervate-based extraction method, was utilized
for the separation and preconcentration of trace amounts of cadmium, lead, and nickel. Quinalizarin was used as
complexing agent and Triton X-114 was used as surfactant. After extraction, analyte ions were determined by flame
atomic absorption spectrometry. The detection limits (3 s) of 1.8 µ g L −1 for Cd(II), 3.2 µ g L −1 for Pb(II), and 2.8
µ g L −1 for Ni(II) were obtained using 50 mL of solutions. The relative standard deviation was calculated as 4.3% for
10 µ g L −1 Cd(II), 4.9% for 50 µ g L −1 Pb(II), and 4.6% for 50 µ g L −1 Ni(II). Obtained enrichment factors of Cd(II),
Pb(II), and Ni(II) were 144, 129 and 92, respectively. In addition, the method was successfully implemented for the
determination of Cd(II), Pb(II), and Ni(II) in water samples and standard reference materials and satisfactory recovery
values were obtained.
Key words: Cloud point extraction, coacervate-based extraction, atomic absorption spectrometry, preconcentration,
trace analysis, cadmium, lead, nickel
1. Introduction
Due to heavy metal contaminated water produced by several industries, all living organisms that have the ability
of bioaccumulation encounter serious health problems even at very small concentrations of heavy metals. For
surface waters, heavy metal pollution is one of the five basic types of important pollutions. 1 Nevertheless, some
heavy metals are known to be essential for life and some are known to be nonessential for biological activity. 2
Cadmium and lead are nonessential, extremely toxic elements and cause several adverse effects on health, even
at minute concentrations. 3 For a biological system, long-term exposure to cadmium leads to deterioration of
calcium regulation and this causes cell damage and death. Prolonged intake of lead causes cumulative poisoning,
which leads to central nervous system damage, hematological disorder, anemia, and kidney disorder. 4 Although
compared with lead and cadmium, nickel is essential and moderately toxic, it has many negative effects on
human health and an allergic reaction is the most important of these effects. 5−7 In addition, inhalation of
nickel compounds causes serious health problems such as cancer, eczema, and skin diseases. 8 Therefore, in
order to minimize the negative impact of heavy metals, it is important to measure and continuously monitor
their levels in environmental samples. From an analytical standpoint, the concentrations of heavy metals in
most samples are generally close to the detection limits of most analytical techniques and this is a significant
∗ Correspondence:
979
SATTI et al./Turk J Chem
problem on which analytical chemists work. Because of these reasons, the development of an accurate, sensitive,
and economical detection method for trace amounts of heavy metals is a very important task. 9,10
When considering speed, cheapness, and ease of use, flame atomic absorption spectrometry (FAAS)
is one of the most popular spectroscopic methods. However, FAAS suffers from unsatisfactory sensitivity and
interference effects. 11 In order to eliminate these handicaps a preconcentration/separation step is applied before
analysis. However, the preconcentration technique should be environmentally friendly, inexpensive, and simple
to use. These requirements are met by using a coacervate (a surfactant rich liquid and an extraction medium)
during sample preparation. Cloud point extraction (CPE) is one of the most popular coacervate-based extraction
techniques. Formation of micellar aggregates in aqueous solutions of nonionic surfactants lies at the basis of
the CPE technique. CPE involves three steps: (1) dissolution of analytes: analytes present in sample bound
to micelles; (2) clouding: by heating to a certain temperature called cloud point temperature (CPT) a cloudy
solution is obtained; (3) separation of phases: at a temperature above the CPT the micellar solution separates
into two phases (one is an analyte containing, small volume of surfactant rich phase and the other is aqueous
phase). 12,13
Quinalizarin (1,2,5,8-tetrahydroxyanthracene-9,10- dione) is a hydroxyl anthraquinone reagent and anthraquinone derivatives are very popular chelating agents for the sensitive and selective determination of metals
in analytical chemistry. 14 The reactions between quinalizarin and metal ions to form complexes are very rapid. 14
In the present study, a simple and selective CPE method for preconcentration and FAAS determination
of Cd(II), Pb(II), and Ni(II) in aqueous sample was proposed. For this purpose quinalizarin was used as
complexing agent and octylphenoxypolyethoxyethanol (Triton X-114) as surfactant. In order to improve the
efficiency of the method several parameters such as pH, amounts of quinalizarin and Triton X-114, temperature,
and duration were explored. The method was also adapted to the determination of the metal ions studied in
different water samples and standard reference materials.
2. Results and discussion
In coacervate-based techniques, determination of optimum parameters has prime importance. For example,
appropriate pH specifies formation of complex and coacervate and efficiency of extraction. 12 In addition, working
at a suitable temperature is also very important for phase separation. Therefore, to enhance extraction efficiency
and thus enrichment factor, several parameters that affect the formation of metal–ligand complex and the CPE
conditions were explained. Each optimization experiment was performed twice. Fifty milliliters of Cd(II), Pb(II),
and Ni(II) standard solutions containing 10 µ g L −1 , 50 µ g L −1 , and 50 µ g L −1 of the ions, respectively, were
used during these optimization experiments. Then optimized conditions (given in Table 1) were used to analyze
the metal ions of interest in certified reference materials and natural water samples.
2.1. Effect of pH
Extraction efficiency is dependent on the pH at which metal–ligand interactions occur. 15,16 The role of pH in
the formation and extraction of metal–quinalizarin complex was studied by changing pH in the range of 3–11
while other parameters were set at their optimum values. To adjust the pH to the desired value appropriate
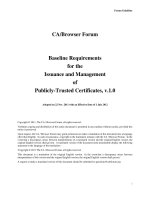
buffer solutions were used. The results obtained are shown in the Figure. The extraction efficiency of each
metal ion with quinalizarin into Triton X-114 was maximized and remained nearly constant at a pH value of
around 8.0. The decrease in the absorbance value of metal ions at low pH may be because of the competition
980
SATTI et al./Turk J Chem
of hydrogen ions with target ions for the reaction with quinalizarin. Hence the optimum pH value was chosen
as 8.0 for further studies.
Table 1. Optimum conditions for the CPE of Cd, Pb, and Ni ions.
Optimum conditions for CPE of Cd, Pb, and Ni
Concentration of chelating agent
Concentration of surfactant
pH
Equilibrium temperature (◦ C)
Equilibrium time (min)
Centrifugation rate (rpm)
Centrifugation time (min)
Diluent
Value
0.25% (w/v)
0.02% (v/v)
8
70
30
3000
1
0.1 mol L−1 HNO3 in ethanol
0.25
Pb (II)
0.2
Absorbance
Cd (II)
Ni (II)
0.15
0.1
0.05
0
0
2
4
6
8
10
12
pH
Figure. Influence of pH on the absorption of Cd, Pb, and Ni by CPE. Analyte concentration: 10 µ g L −1 Cd(II), 50 µ g
L −1 Ni(II), and 50 µ g L −1 Pb(II); Sample volume, 50 mL; surfactant, 0.02% Triton X-114; ligand, 0.25% Quinalizarin;
dilution solvent, ethanolic HNO 3 ; equilibration temperature, 70
◦
C; equilibration time, 30 min.
2.2. Effect of amount of quinalizarin
The distribution ratio of the metal–ligand complex between micellar phase and aqueous phase determines the
extraction efficiency of metal ions. 17 If the pH of the aqueous phase is kept constant, the distribution ratio and
thus extraction efficiency improve by increasing complexing agent concentration. The effect of complexing agent
amount on the extraction efficiency of the metal ions of interest was studied in the range of 0.05%–1.0% (w/v).
According to the results obtained after optimization experiments, for all metal ions studied, the recovery value
obtained increased with the increase in quinalizarin concentration up to 0.25%, and then remained constant,
which indicates complete complexation. Therefore, 0.25% (w/v) quinalizarin concentration was chosen as the
best value for subsequent experiments.
2.3. Effect of Triton X-114 concentration
Triton X-114 was used as extractant and the concentration of this surfactant affects both the extraction efficiency
and the volume of the surfactant-rich phase. In order to obtain easy phase separation and maximum extraction
efficiency the optimum amount of Triton X-114 should be determined. 18 For this purpose, the change in the
analytical signal of the metal ion of interest within the Triton X-114 concentration range of 0.0%–0.5% (v/v) was
studied. When the concentration of Triton X-114 was greater than 0.02% (v/v) extraction was quantitative.
981
SATTI et al./Turk J Chem
It can be assumed that when the concentration was lower than 0.02% (v/v) the hydrophobic complex was
not quantitatively entrapped by insufficient number of surfactant molecules. With an increase in Triton X-114
concentration above 0.20% (v/v), extraction efficiency decreases. This can be explained by increasing the volume
and viscosity of the surfactant rich phase. Hence, a concentration of 0.02% (v/v) was chosen for subsequent
experiments.
2.4. Effects of the equilibrium temperature and time
In order to achieve convenient phase separation with maximum efficiency, equilibration temperature and incubation time should be applied. To optimize the equilibration temperature and extraction time a series of
experiments were performed in the range of 25–90 ◦ C and 5–90 min, respectively. Based on the results obtained, 70 ◦ C and 30 min were chosen as optimal.
2.5. Effect of viscosity
After performing CPE the extraction phase obtained has high viscosity, because of a very high concentration
of Triton X-114. In order to make sample transfer to the FAAS nebulizer easy, the viscosity of the surfactant
rich phase should be reduced. For this purpose, ethanol, methanol acetone, and acidic solutions of ethanol and
methanol were tested in order to increase the analytical signals and sensitivity. The results proved that 500
µ L of ethanol solution containing 0.1 mol L −1 nitric acid was the best choice. For conventional aspiration this
amount of solution was sufficient to ensure a sufficient volume of sample. However, at smaller volumes, the
reproducibility of the signals was very poor, and, for higher volumes, there was a decrease in the signal because
of dilution.
2.6. Effect of salt addition
According to the literature, addition of salt to the CPE medium can lower the value of CPT and enhance the
density of the surfactant rich phase, facilitating the separation of aqueous and surfactant rich phases. 19,20 To
explore the ionic strength effect caused by the addition of salt on performance of CPE, a series of experiments
were performed by adding different amounts of NaCl in the range of 0% and 4% (w/v) to each metal ion
solution of interest. The results indicated ionic strength has no considerable effect upon extraction efficiency or
sensitivity. This result is consistent with some studies in the literature. 10,21
2.7. Effect of interfering ions
In order to explore the effects of possible matrix ions in natural water samples, several interfering ions were
added individually to a solution containing 10 µ g L −1 Cd(II), 50 µ g L −1 Ni(II), and 50 µ g L −1 Pb(II). A set
of 50 mL of solutions containing varying amounts of interferent ions and the metal ion of interest was taken and
the same CPE procedure was applied. If an added foreign ion caused ±5% variation in the absorbance value
of analyte, it was considered an interfering species. The results obtained are summarized in Table 2. The table
shows that the ions that usually exist in water samples do not interfere under the experimental conditions used.
2.8. Analytical features
Using the optimized conditions of the CPE procedure, calibration graphs prepared for cadmium (2.5–25 µ g
L −1 ), nickel (5.0–200 µ g L −1 ), and lead (5.0–200 µ g L −1 ) were found to be linear. The enrichment factor,
calculated as the ratio of the slope of calibration curves of the analyte after CPE to that of prior CPE, was 144
982
SATTI et al./Turk J Chem
for cadmium, 92 for nickel, and 129 for lead. In order to prove the precision, the relative standard deviation
(RSD), calculated for 10 replicate measurements from 50-mL sample solutions containing 10 µ g L −1 Cd 2+ , 50
µ g L −1 Pb 2+ , and 50 µ g L −1 Ni 2+ , was 4.3% (n = 10), 4.9% (n = 10), and 4.6% (n = 10), respectively. The
limit of detection (LOD), defined as the concentration equivalent to three times the standard deviation (3s)
of 10 measurements of the blank, was 1.8 µ g L −1 for Cd 2+ , 3.2 for µ g L −1 Pb 2+ , and 2.8 µ g L −1 Ni 2+ .
The limit of quantification (LOQ) was defined as 10 times the standard deviation (10s) of 10 measurements.
The LOQ was calculated as 5.8 µ g L −1 for Cd 2+ , 10.6 for µ g L −1 Pb 2+ , and 9.3 µ g L −1 Ni 2+ . Table 3
summarizes some analytical figures of the method.
Table 2. Effect of interfering ions on enrichment of 10 µ g L −1 Cd(II), 50 µ g L −1 Ni(II), and 50 µ g L −1 Pb(II).
Interfering ion, M
Na+
NH+
4
Ca2+
Cd2+
Cu2+
Pb2+
Mn2+
Zn2+
Co2+
Ni2+
Mg2+
Sn2+
Al3+
Fe3+
Cr3+
CH3 COO−
Cl−
NO−
3
CO2−
3
SO2−
4
Added as
NaNO3
NH4 NO3
CaCl2
Cd(NO3 )2
Cu(NO3 )2
Pb(NO3 )2
MnCl2
Zn(NO3 )2
Co(NO3 )2
Ni(NO3 )2
MgSO4
SnCl2
Al(NO3 )3
Fe(NO3 )3
Cr(NO3 )3
NH4 CH3 COO
NH4 Cl
KNO3
Na2 CO3
Na2 SO4
[Cd2+ ]:[M]
> 1 : 5000
> 1 : 2000
> 1 : 2000
1:100
1:100
> 1 : 1000
1:1000
> 1 : 2000
> 1 : 2000
> 1 : 2000
1:500
1:1000
> 1 : 1000
1:1500
1:5000
1:1500
1:1000
1:1500
1:5000
[Pb2+ ]:[M]
> 1 : 5000
> 1 : 2000
1:1000
1:100
1:500
> 1 : 2000
> 1 : 2000
> 1 : 2000
> 1 : 2000
> 1 : 2000
1:500
1:1000
1:2000
1:1000
1:5000
1:1000
1:2000
1:2000
1:5000
[Ni2+ ]:[M]
> 1 : 5000
> 1 : 2000
1:1000
> 1 : 2000
1:500
1:100
> 1 : 2000
1:2000
1:1000
1:2000
1:500
1:1000
> 1 : 2000
1:1000
1:5000
1:2000
1:2000
1:1000
1:5000
Table 3. Analytical characteristics of the method.
Parameter
Enrichment factor
Sample volume, mL
Limit of detection, µg L−1 (3s)
Limit of quantification, µg L−1 (10s)
Precision RSD (%)
(for 10 µg L−1 Cd(II),
50 µg L−1 Ni(II), and
50 µg L−1 Pb(II); n = 10)
Linear range, µg L−1
Calibration equation
Linear regression coefficient, R2
Analytical feature
Cd
Pb
144
129
50
50
1.8
3.2
5.8
10.6
Ni
92
50
2.8
9.3
4.3
4.9
4.6
2.5–50
A = 1.27 × 10⁻²
C + 3.76 × 10⁻²
0.9929
5–200
A = 9.94 × 10⁻⁴
C + 1.14 × 10⁻²
0.9815
5–200
A = 1.70 × 10⁻³
C + 4.22 × 10⁻²
0.9621
983
SATTI et al./Turk J Chem
2.9. Accuracy of the method
In order to explore the performance of the study the CPE method was applied to two different reference
materials, i.e. TMDA 51.3 (fortified water) and SPS-SW2 (surface water), for the assessment of Cd 2+ , Pb 2+ ,
and Ni 2+ ions. The certified and calculated values for the analysis of certified reference materials are given
in Table 4. The results given in Table 4 are the average of three parallel experiments. A t-test for 2 degrees
of freedom and at the 95% confidence level showed that there was good agreement between the estimated
content by the proposed method and the certified values for the analyte ions studied. Considering the results
obtained one can conclude that the developed method is free from interferences of the various constituents and
is successful for the quantitation of the metal ions studied.
Table 4. Determination of analyte ions in certified reference materials using the proposed methodology (n = 3).
CRM*
SPS-SW2 (surface water)
TMDA 51.3 (fortified water)
TMDA 51.3 (fortified water)
Ion
Cd(II)
Pb(II)
Ni(II)
Certified (µg L−1 )
2.5
36.6
68.3
Found (µg L−1 )
2.6 ± 0.1
34.9 ± 0.3
67.8 ± 0.3
Recovery %
104
95
99
*Certified reference material
2.10. Analysis of real samples
To evaluate the accuracy of the proposed study, recovery experiments were performed by spiking different water
samples such as tap (Ankara, Turkey) and sea (Black Sea, Turkey) water samples. The results are given in
Table 5 and 6. As can be seen from the tables, the recovery values for spiked water samples are quantitative.
Table 5. Determination of analyte ions in tap water samples using the proposed methodology (n = 3).
Ion
Cd(II)
Pb(II)
Ni(II)
Added (µg L−1 )
10
25
40
5
10
50
5
10
50
Found (µg L−1 )
1.6 ± 0.2
11.9 ± 0.2
27.5 ± 0.5
39.8 ± 0.4
11.8 ± 0.3
16.5 ± 0.3
22.1 ± 0.3
61.8 ± 0.5
29.8 ± 0.2
34.3 ± 0.4
39.6 ± 0.4
78.1 ± 0.6
Recovery (%)
103
103
96
94
103
100
90
98
97
2.11. Comparison with the literature
As a type of coacervate-based extraction technique CPE is a simple, rapid, inexpensive, and nonpolluting
methodology and because of these properties it is a great alternative to conventional preconcentration methods.
The obtained high recoveries and low detection limits by the developed study provide an ideal occasion to
preconcentrate trace metals in aqueous solutions. Table 7 gives a comparison of the proposed method with
other CPE methods for the determination of Cd 2+ , Pb 2+ , and Ni 2+ ions in the literature. 21−26 The obtained
detection limits and enhancement factors by the proposed study are higher than those reported in the literature.
984
SATTI et al./Turk J Chem
Table 6. Determination of analyte ions in sea water (Black Sea) samples using the proposed methodology (n = 3).
Ion
Cd(II)
Pb(II)
Ni(II)
Added (µg L−1 )
10
25
40
5
10
50
5
10
50
Found (µg L−1 )
4.6 ± 0.3
14.9 ± 0.2
28.4 ± 0.4
44.1 ± 0.3
35.3 ± 0.3
39.8 ± 0.7
44.7 ± 0.6
83.7 ± 0.8
38.5 ± 0.2
43.3 ± 0.4
47.9 ± 0.4
88.8 ± 0.9
Recovery (%)
102
96
99
90
94
97
96
94
101
Table 7. Comparison of the characteristic data between recently published CPE methods and the presented method.
EFa
Cd
Sample
volume (mL)
9
13.5
LODb
(µg L−1 )
3
Pb
50
25
3.42
40
42
39
45
58
43
144
129
92
0.37
2.6
4.3
0.6
0.27
1.02
1.8
3.2
2.8
Reagent
Surfactant
Element
Methyl Green
1-Phenylthio
semicarbazide
1-(2-Pyridilazo)2-naphthol
Dithizone
2,2’-Furyldioxime
Triton X-114
Triton X-114
Dithizone
TX-114
Quinalizarin
Triton X-114
a
Triton X-114
Triton X-114, Octanol
Triton X-114, Octanol
Cd
Ni
Pb
Ni
Cd
Ni
Cd
Pb
Ni
15
40
25
10
50
Sample
Ref.
Food
Food and
drinks
22
Water
24
Water
Food
25
21
Water
26
Water
This
study
23
Enrichment factor, b Limit of detection
3. Experimental
3.1. Instrumentation
A PerkinElmer (USA) model AAnalyst 800 Atomic Absorption Spectrometer equipped with deuterium background correction and an air/acetylene burner with 17 and 2 L min −1 flow rates was used for absorbance
measurements. As a source, hollow cathode lamps were used. The working current/wavelength values for cadmium, lead, and nickel were 4 mA/228.8 nm, 10 mA/283.3 nm, and 25 mA/232.0 nm, respectively. A 0.2-nm
slitwidth was used for all analytes. A Fisher Scientific Accumet 15 model pH meter was used for pH adjustments
and a Clifton NE1-22 model thermostatic bath was used to heat solutions for CPE. A Hettich EBA 21 model
centrifuge was used to facilitate the separation of phases.
3.2. Reagent and solutions
Standard stock solutions of 1000 mg L −1 Cd 2+ , Pb 2+ , or Ni 2+ were separately prepared from Pb(NO 3 )2 ,
Cd(NO 3 )2 ·4H 2 O, or Ni(NO 3 )2 ·6H 2 O (Merck, Darmstadt, Germany) in deionized water. Diluted solutions of
985
SATTI et al./Turk J Chem
the metal ions of interest were prepared daily from standard stock solutions. Deionized water with a resistivity
of 18.1 MΩ cm −1 was obtained from a Banstead, Nanopure Diamond purification system. The chelating
reagent, 0.25% (w/v) quinalizarin, was prepared daily by dissolving the necessary amounts of quinalizarin
(Merck Chemicals, Germany) in acetone. Triton X-114 (Sigma, St. Louis, MO, USA) was used without
further purification. Phosphate buffer solutions (Merck Chemicals, Germany) were prepared and used for pH
adjustment. For validation of the proposed method the certified reference materials TMDA 51.3 (fortified water,
LGC, Teddington, UK) and SPS-SW2 (surface water, LGC) were used.
3.3. CPE procedure
For CPE, sample or standard containing 50 mL of solutions of the metal ions of interest was prepared and taken
in a conical graduated tube. pH was adjusted to 8 using 2 mL of phosphate buffer. Next 250 µ L of quinalizarin
(0.25% m/v) and 500 µ L of Triton X-114 (0.02% v/v) were added and mixed well with the aid of a vortex and
kept in a thermostated bath at 70 ◦ C for 30 min. Subsequently the tubes were centrifuged at 3000 rpm for 1
min to facilitate phase separation. After centrifugation the initial solution was divided into two phases: one of
the phases was the analyte containing a small volume of surfactant rich phase and the other was the aqueous
phase. Then, in order to obtain denser surfactant rich phase, the mixture was inserted into an ice bath. After
the aqueous phase was carefully transferred with the aid of a pipette, 500 µ L of ethanol containing 0.1 mol
L −1 nitric acid was added to the surfactant rich phase to reduce its viscosity and the solution obtained was
aspirated to FAAS for determination of the metal ions of interest.
Acknowledgment
This work was supported by the Scientific Research Foundation of Hacettepe University (project number: 09
01 601 012-841).
References
1. Emoyan, O. O.; Ogban, F. E.; Akarah, E. J. Appl. Sci. Environ. Mgt. 2006, 10, 121-127.
2. Mekkawy, I. A. A.; Mahmoud U. M.; Wassif, E. T.; Naguib, M. Fish. Physiol. Biochem. 2011, 37, 71-84.
3. Monteiro, C. M.; Fonseca, S. C. J. Appl. Phycol. 2011, 23, 97-103.
4. Naeemullah; Kazi, T. G.; Afridi, H. I.; Shah, F.; Arain, S. S.; Brahman, K. D.; Ali, J.; Arain, M. S. Arab. J. Chem.
2016, 9, 105-113.
5. Aras, N. K.; Ataman, O. Y. Trace Element Analysis of Food and Diet, Royal Society of Chemistry: Cambridge,
UK, 2006, pp. 241.
6. Sauer, A.; Cohen, H.; Meyerstein, D. Inorg. Chem. 1988, 27, 4578-4581.
7. Jabri, E.; Karplus, P. A. Biochem. 1996, 35, 10616-10626.
8. Shemirani, F.; Jamali, M. R.; Kozani, R. R. Sep. Sci. Tech. 2006, 41, 3065-3077.
9. Krawczyk, M.; Jeszka-Skowron, M. Microchem. J. 2016, 126, 296-301.
10. Tă
uzen, M; Melek, E.; Soylak, M. J. Hazard. Mater. 2006, 136, 597-603.
11. Durukan, I.; Arpa Sahin, C.; Satıroglu, N.; Bektas, S. Microchem. J. 2011, 99, 159-163.
12. Melnyk, A.; Namiesnik, J.; Wolska, L. Trac-Trend. Anal. Chem. 2015, 71, 282-292.
13. Moftakhara, M. K.; Yaftiana, M. R.; Zamanib, A. J. Anal. Chem. 2015, 70, 1085-1091.
14. Abd El-Hay, S. S.; Gouda, A. A. J. Radioanal. Nucl. Chem. DOI 10.1007/s10967-016-4780-y.
986
SATTI et al./Turk J Chem
15. Shemirani, F.; Baghdadi, M.; Ramezani, M.; Jamali, M. R. Anal. Chim. Acta 2005, 534, 163-169.
16. Durukan, I.; Soylak, M.; Do˘
gan, M. Atom. Spectrosc. 2013, 34, 20-25.
17. S
¸ atıro˘
glu, N.; Arpa C. Microchim. Acta 2008, 162, 107-112.
18. Ghaedi, M.; Shokrollahi, A.; Niknam, K.; Niknam, E.; Najibi, A.; Soylak, M. J. Hazard. Mater. 2009, 168, 10221027.
19. Coelho, L. M.; Arruda, M. A. Z. Spectrochim. Acta B 2005, 60, 743-748.
20. Fan, C.; Luo, S; Liu, R. RSC Adv. 2015, 5, 65321-65327.
21. Rahnama, R.; Najafi, M. Environ. Monit. Assess. 2016, 188, 150-159
22. Xiang, G.; Wen, S.; Wu, X.; Jiang, X.; He, L.; Liu, Y. Food Chem. 2012, 132, 532-536.
23. Citak, D.; Tuzen, M. Food Chem. Toxicol. 2010, 48, 1399-1404.
24. Galbeiro, R.; Garcia, S.; Gaubeur, I. J. Trace Elem. Med. Biol. 2014, 28, 160-165.
25. Wen, X.; Deng, Q.; Ji, S.; Yang, S.; Li, S. Microchem. J. 2012, 100, 31-35.
26. Naeemullah, Kazi, T. G.; Tuzen, M. J. Ind. Eng. Chem. 2016, 35, 93-98.
987