Tài liệu Module 17: Introduction to Data Mining pptx
Bạn đang xem bản rút gọn của tài liệu. Xem và tải ngay bản đầy đủ của tài liệu tại đây (1.18 MB, 40 trang )
Contents
Overview 1
Introducing Data Mining 2
Training a Data Mining Model 12
Building a Data Mining Model with
OLAP Data 13
Browsing the Dependency Network 23
Lab A: Creating a Decision Tree with
Relational Data 27
Review 32
Module 17: Introduction
to Data Mining
BETA MATERIALS FOR MICROSOFT CERTIFIED TRAINER PREPARATION PURPOSES ONLY
Information in this document is subject to change without notice. The names of companies,
products, people, characters, and/or data mentioned herein are fictitious and are in no way intended
to represent any real individual, company, product, or event, unless otherwise noted. Complying
with all applicable copyright laws is the responsibility of the user. No part of this document may
be reproduced or transmitted in any form or by any means, electronic or mechanical, for any
purpose, without the express written permission of Microsoft Corporation. If, however, your only
means of access is electronic, permission to print one copy is hereby granted.
Microsoft may have patents, patent applications, trademarks, copyrights, or other intellectual
property rights covering subject matter in this document. Except as expressly provided in any
written license agreement from Microsoft, the furnishing of this document does not give you any
license to these patents, trademarks, copyrights, or other intellectual property.
2000 Microsoft Corporation. All rights reserved.
Microsoft, BackOffice, MS-DOS, Windows, Windows NT, <plus other appropriate product
names or titles. Replace this example list with list of trademarks provided by copy editor.
Microsoft is listed first, followed by all other Microsoft trademarks in alphabetical order. > are
either registered trademarks or trademarks of Microsoft Corporation in the U.S.A. and/or other
countries.
<This is where mention of specific, contractually obligated to, third party trademarks, which are
added by the Copy Editor>
The names of companies, products, people, characters, and/or data mentioned herein are fictitious
and are in no way intended to represent any real individual, company, product, or event, unless
otherwise noted.
Other product and company names mentioned herein may be the trademarks of their respective
owners.
Module 17: Introduction to Data Mining iii
BETA MATERIALS FOR MICROSOFT CERTIFIED TRAINER PREPARATION PURPOSES ONLY
Instructor Notes
This module introduces students to data mining and explains how to build and
browse data mining models by using Microsoft
®
SQL Server
™
2000 Analysis
Services. Students will learn fundamental data mining terminology, concepts,
techniques, and algorithms.
This is an overview module that focuses on the use of built-in Analysis
Manager wizards. It is not intended to provide in-depth knowledge of data
mining.
After completing this module, students will be able to:
!
Describe data mining characteristics, applications, and modeling techniques.
!
Describe the process of training a model.
!
Use the online analytical processing (OLAP) Mining Model Wizard to edit,
process, and explore the decision trees.
!
Analyze relational data relationships in the dependency network browser.
!
Describe the steps required to build a clustering model by using OLAP data.
Materials and Preparation
This section lists the required materials and preparation tasks that you need to
teach this module.
Required Materials
To teach this module, you need Microsoft PowerPoint
®
file 2074A_17.ppt.
Preparation Tasks
To prepare for this module, you should:
!
Read all the materials for this module.
!
Read the instructor notes and margin notes.
!
Practice combining the lecture with the demonstrations.
!
Complete the lab.
!
Review the Trainer Preparation presentation for this module on the Trainer
Materials compact disc.
!
Review any relevant white papers that are located on the Trainer Materials
compact disc.
Presentation:
40 Minutes
Lab:
20 Minutes
iv Module 17: Introduction to Data Mining
BETA MATERIALS FOR MICROSOFT CERTIFIED TRAINER PREPARATION PURPOSES ONLY
Demonstration: Determining Why Students Attend College
The following demonstration procedures provide information that will not fit
in the margin notes or is not appropriate for student notes.
In this demonstration, you will create a data mining model by using a decision
tree with relational data. Specifically, you will create a decision tree that
determines why students attend college.
You will create a new OLAP database with a data source connecting to the
Module 17 relational database.
!
To create an OLAP database
1. In Analysis Manager, expand the Analysis Servers folder, right-click your
local server, and then click New Database.
2. Enter Module 17 as the database name, and then click OK.
3. Expand the Module 17 database, right-click the Data Sources folder, and
then click New Data Source.
4. On the Provider tab of the Data Link Properties dialog box, click
Microsoft OLE DB Provider for SQL Server. Click Next.
5. Type localhost in Step 1.
6. In Step 2, click Use Windows NT Integrated security.
7. In Step 3, click Module 17 from the list of databases. Click OK.
!
To create the data mining model
In this procedure, you will create the data mining model by selecting source,
case table, data mining technique, and key column.
1. In the Module 17 database, right-click the Mining Models folder, and then
click New Mining Model.
2. At the welcome page, click Next.
3. From the Select source type step of the Mining Model Wizard, click
Relational data, and then click Next.
Point out that either relational tables or OLAP cubes can be used as source
data. For this model, you are accessing relational data.
4. From the Select case tables step, in the Available tables list, click College
Plans, and then click Next.
5. From the Select data mining technique step, in the Technique list, click
Microsoft Decision Trees, and then click Next.
Two algorithms ship with Analysis Services: Microsoft Decision Trees and
Microsoft Clustering. Use the Decision Trees algorithm for this
demonstration.
6. From the Select the key column step, in the Case key column list, click
StudentID, and then click Next.
Demonstration:
10 Minutes
Module 17: Introduction to Data Mining v
BETA MATERIALS FOR MICROSOFT CERTIFIED TRAINER PREPARATION PURPOSES ONLY
!
To select input and predictable columns for the mining model
1. From the Select input and predictable columns step of the Mining Model
Wizard, in the Available columns list, click CollegePlans at the bottom of
the column list.
2. Click the top arrow (>) to choose CollegePlans as a predictable column.
3. In the Available columns list, click Gender, and then click the bottom
arrow (>) to choose that column as an input column.
4. In the Available columns list, click ParentIncome, and then click the
bottom arrow (>) to choose that column as an input column.
5. In the Available columns list, click IQ, and then click the bottom arrow (>)
to select that column as an input column.
6. In the Available columns list, click ParentEncouragement, and then click
the bottom arrow (>) to select that column as an input column. Click Next.
!
To finish the Mining Model Wizard
In this procedure, you name the model, initiate processing and then close the
wizard.
1. From the Finish the mining model wizard step, in the Model name box,
type CollegePlans.
2. Click Finish to create and process the model.
3. When the model has completed processing, click Close to close the Process
dialog box.
!
To explore data in the decision tree
1. In the Relational Mining Model Editor, click the Content tab.
2. In the Content Detail pane, click the All node.
View the Totals tab of the Attributes pane, and point out that more than 67
percent of the students interviewed do not plan to attend college.
3. Click the Parent Encouragement = Encouraged node.
Point out to the students that parental encouragement is the most dominant
attribute in this model. More than 57 percent of students that are encouraged
by their parents plan to attend college.
4. Click Parent Encouragement = Not Encouraged.
Fewer than 7 percent of students who are not encouraged by their parents
plan to attend college.
5. Close the Relational Mining Model Editor.
vi Module 17: Introduction to Data Mining
BETA MATERIALS FOR MICROSOFT CERTIFIED TRAINER PREPARATION PURPOSES ONLY
Module Strategy
Use the following strategy to present this module:
The structure of this module is multiple demonstrations showing students how
to build and browse various types of data mining models. Except for the first
example about students attending college, the demonstrations are documented
directly in the student manual. Integrate your lecture with live demonstration
following the procedures included in the student notes. Encourage students to
follow along with your demonstrations on their computers. Some students may
choose to watch your demonstrations only, which is also acceptable.
!
Introducing Data Mining
The case study introduces students to data mining. Data mining may be new
to many students and should be described in very simple terms highlighting
the business application and uses. Emphasize to students why this
technology is useful and complementary to the other forms of analysis they
have been exposed to. Then describe the various data mining techniques that
are available.
!
Training a Data Mining Model
Describe the process required to create a data mining model. Define training
data and cases.
!
Building a Data Mining Model with OLAP Data
Introduce students to the membership card scenario. Use the membership
card scenario to step students through the process of building a data mining
model with OLAP data by using the Mining Model Wizard. Describe each
step in the process—selecting the data mining technique, selecting the case,
selecting the training data, creating a dimension and virtual cube, and
browsing the data mining model.
!
Browsing the Dependency Network
Demonstrate how to browse the dependency network. Explain that the
Dependency Network Browser can be used to view all the relationships in
your model.
Module 17: Introduction to Data Mining 1
BETA MATERIALS FOR MICROSOFT CERTIFIED TRAINER PREPARATION PURPOSES ONLY
Overview
!
Introducing Data Mining
!
Training a Data Mining Model
!
Building a Data Mining Model with OLAP Data
!
Browsing the Dependency Network
This module provides you with an introduction to Microsoft
®
SQL Server
™
2000 Analysis Services Data Mining.
The objective of the module is to introduce you to both data mining principles
and applications while exploring the Analysis Services wizard-driven interface
for creating data mining models.
After completing this module, you will be able to:
!
Describe data mining characteristics, applications, and modeling techniques.
!
Describe the process of training a model.
!
Use the online analytical processing (OLAP) Mining Model Wizard to edit,
process, and explore the decision trees.
!
Analyze relational data relationships in the dependency network browser.
!
Describe the steps required to build a clustering model by using OLAP data.
Topic Objective
To provide an overview of
the module topics and
objectives.
Lead-in
In this module, you will learn
about data mining, how data
mining can be used to
address business
application requirements,
and how to create data
mining models by using the
Analysis Manager.
2 Module 17: Introduction to Data Mining
BETA MATERIALS FOR MICROSOFT CERTIFIED TRAINER PREPARATION PURPOSES ONLY
#
##
#
Introducing Data Mining
!
Defining Data Mining
!
Data Mining Applications
!
Data Mining Models
!
Introductory Example
!
Exploring the Decision Tree
This section introduces data mining concepts, including:
!
Defining data mining.
!
Discussing how data mining can be applied to solve common business
applications.
!
Describing what data mining models are available.
!
Presenting a simple example of how data mining can be used.
!
Exploring the decision tree.
Topic Objective
To introduce the concept of
data mining.
Lead-in
In this section, you will be
introduced to a simple case
study example. In that
example, data mining will be
defined, common
applications and techniques
discussed, and its role in the
data warehouse explored.
Module 17: Introduction to Data Mining 3
BETA MATERIALS FOR MICROSOFT CERTIFIED TRAINER PREPARATION PURPOSES ONLY
Defining Data Mining
!
Is The Process of Deducing Meaningful Patterns and
Rules from Large Quantities of Data
!
Searches for Patterns in Data Rather than Answering
Predefined Questions
!
Is Used To:
$
Provide historical insights
$
Predict future values or outcomes
$
Close the loop for analysis
In many organizations, data volumes are so large that it is difficult, even for the
most seasoned analyst, to identify the key information most relevant to
managing the business.
Data mining is the automatic or semi-automatic process of deducing meaningful
patterns and rules from large quantities of data. These patterns provide valuable
insights to business managers and offer information that may be overlooked by
more traditional manual methods of analysis.
Data mining programs search for patterns in data rather than answer predefined
questions. Because of this, they can be used for knowledge discovery in
addition to hypothesis testing.
Data mining is used to:
!
Provide insight into historical data.
!
Predict future values or outcomes based on historical patterns.
!
Close the analysis loop by taking action based on the information derived
from the analysis.
Topic Objective
To provide a definition of
data mining.
Lead-in
Data mining provides a
means by which the system
deduces knowledge from
the data by identifying
correlations and other
patterns in the data.
4 Module 17: Introduction to Data Mining
BETA MATERIALS FOR MICROSOFT CERTIFIED TRAINER PREPARATION PURPOSES ONLY
Data Mining Applications
!
Advertising on the Internet
$
“What banner will I display to this visitor?”
$
“What other products is this customer likely to buy?
!
Detecting Fraud
$
“Is this insurance claim a fraud?”
!
Pricing Insurance
$
“How much of a discount will I offer to this customer?”
!
Managing Credit Risk
$
“Will I approve the loan for this customer?”
Data mining techniques are used in a variety of applications. This section
provides some interesting examples.
Advertising on the Internet
You can use data mining to classify groups of customers with similar
information into segments for targeting advertising or special offers.
Following are two Internet customer examples:
!
An e-commerce Web site sells sporting equipment. When a customer
registers, a database management system collects information about the
customer, such as gender, marital status, favorite sport, and age.
By using data mining techniques, the Web site displays a masculine banner
ad with a golfing motif for the male, golf-loving, 40-year-old who returns to
the Web site after registering.
!
When you purchase merchandise on the Internet, you are sometimes offered
additional merchandise that the Web site predicts you might be interested
in—for example, a book similar to the one you are currently purchasing.
Such recommendations are based on data mining techniques that search out
purchase patterns of customers who purchased the same book you are now
buying. The system recommends: “If you like xyz books, check out the
additional books below.”
Detecting Fraud
You can use a data mining system to identify characteristics of suspicious
insurance claims by analyzing characteristics of legitimate and fraudulent
claims. For example, specific types of injuries that are difficult to diagnose,
such as neck and back injuries, may be more likely candidates for a fraudulent
claim.
Topic Objective
To identify different
applications for data mining.
Lead-in
Data mining is used for a
variety of different
applications. We are now
going to talk about some
common uses.
Delivery Tips
Incorporate your own
examples of how data
mining is used to solve
business problems. Ask
students for examples from
their businesses.
Point out that data mining is
no longer an art used by just
PhDs. This technology is
available and useful to a
variety of businesses.
Module 17: Introduction to Data Mining 5
BETA MATERIALS FOR MICROSOFT CERTIFIED TRAINER PREPARATION PURPOSES ONLY
Pricing Insurance
In the insurance industry, you use data mining techniques to analyze historical
data such as age, marital status, gender, and driving history. All these factors
play a role in predicting the likelihood of a specific driver for getting into an
automobile accident. Data mining techniques help you to weigh and factor these
data points into pricing for an individual insurance policy.
Managing Credit Risk
When you apply for a loan, the bank collects a broad range of information about
you—for example, income, years of employment at a current job, marital status,
and credit standing.
By using data mining techniques applied to historical loan application
information, the bank can predict whether you are a good or bad credit risk and
can use this information when deciding on loan approval.
6 Module 17: Introduction to Data Mining
BETA MATERIALS FOR MICROSOFT CERTIFIED TRAINER PREPARATION PURPOSES ONLY
Data Mining Models
!
Analysis Services Models
$
Microsoft Clustering
$
Microsoft Decision trees
!
Other Models
$
Market basket analysis (affinity grouping)
$
Memory-based reasoning
$
Neural networks
Several data mining techniques are available that you can use to identify the
patterns in large volumes of data. You use different data mining techniques for
different types of applications. In this section, you will learn the most common
data mining techniques and when to apply them.
Analysis Services Models
Analysis Services includes two data mining techniques—Microsoft Clustering
and Microsoft Decision Trees.
Clustering
You use the clustering technique, sometimes called K-nearest neighbor, to
group data records that are similar to each other. You often use this common
technique as the starting point for market or customer analysis.
For example, you may want to segment your market so that you can offer
customized programs and pricing to specific customer groups. With clustering,
you can segment your customers into groups with similar characteristics.
Decision Trees
Decision trees are a popular method for both classifying and predicting. By
using a series of questions and rules to categorize data cases, you can predict
the likelihood of certain types of cases having a specific outcome.
For example, insurance companies use a decision tree to predict the likelihood
of high claims by analyzing statistical data organized by a set of rules that help
predict the likelihood of high claims.
Topic Objective
To describe different data
mining models and how they
apply to data analysis.
Lead-in
A variety of data mining
models are available. These
techniques represent
different approaches to
classification and prediction.
Delivery Tip
Do not spend much time
describing the different
models. Simply discuss that
various models are available
for analysis and that
Microsoft provides two of
the models in Analysis
Services.
Module 17: Introduction to Data Mining 7
BETA MATERIALS FOR MICROSOFT CERTIFIED TRAINER PREPARATION PURPOSES ONLY
Other Models
Analysis Services provides two types of data mining models—clustering and
decision trees. However, users may define their own models or use other
proprietary data mining algorithms. Common data mining models include
market basket analysis, memory-based reasoning, and neural networks.
Market Basket Analysis (Affinity Grouping)
Market basket analysis, sometimes called affinity grouping, is used for finding
groups of items that occur frequently together in a single transaction.
For example, customers who buy gin may also purchase tonic water, which is a
frequent accompaniment. Customers who buy potato chips frequently buy
potato chip dips on the same shopping trip. Understanding when products sell
together helps a retail store manage placement of items on shelves to maximize
affinity group purchases.
Memory-Based Reasoning
Memory-based reasoning (MBR) is a directed data mining technique that is
used for prediction and classification. MBR analyzes a collection of the known
instances of the nearest neighbor and from that information makes predictions
about unknown instances.
For example, if a patient exhibits a series of symptoms, doctors apply their
experience with similar patients to diagnose the current case. The doctors
perform their diagnoses by using a form of MBR.
Neural Networks
Just as a human can learn from experience, so can computers. Neural networks
model the neural connections in a human brain and thereby simulate learning.
If you assemble data where the input and output factors are both known, the
computer can “learn” from those patterns and set up rules and mathematical
factors to help calculate or predict the output value.
Suppose you want to sell your car. Several factors affect the sales price, such as
the age of the car, its condition, its manufacturer and model, and so forth.
Analyzing historical car prices, the neural network can create a series of input
and output factors to predict the sales price.
Summary of Models
The following table defines commonly used data mining models and their
typical usages.
Technique Typical usage
Clustering (K-nearest neighbor) Classification
Decision trees Classification and prediction
Market basket analysis (affinity
grouping)
Clustering or affinity grouping
Memory-based reasoning Classification and prediction
Neural networks Classification, prediction, and clustering
8 Module 17: Introduction to Data Mining
BETA MATERIALS FOR MICROSOFT CERTIFIED TRAINER PREPARATION PURPOSES ONLY
Introductory Example
Why Do High School Students Attend College?
A survey was conducted recently in the United States asking high-school
seniors to answer the following five questions:
1. What is your gender?
2. What is your parents' income?
3. What is your IQ?
4. Do your parents encourage or not encourage you to go to college?
5. Do you plan to attend college?
Data from the survey was compiled into a table shown in the preceding
illustration.
Glancing at the table, you cannot easily determine how many students plan to
attend college and how many do not. You can see that roughly 50 percent will
attend based on the first 22 records of this file. This result may or may not be
representative of the whole set of 9,000 cases.
To determine how many students plan to attend college, you can execute a
query that counts students grouped by those planning on attending and those not
planning on attending.
Suppose you are interested in determining the attribute or combination of
attributes that have the highest potential of predicting the likelihood of a student
for attending college. This is a more complex question and involves segmenting
the data based on various attributes you collect.
To answer the question, you can spend several hours exploring the data
manually, or you can use data mining to explore the data automatically.
Topic Objective
To introduce an example of
how data mining can be
used for prediction.
Lead-in
What do you think is the
principal attribute for
predicting whether students
attend college? What, if
anything, can you conclude
from the information in the
table?
Delivery Tips
Browse the actual relational
table data when discussing
the case study. You can find
the CollegePlans table in
the Module 17 SQL Server
2000 database.
Ask students what they think
are the most dominant
attributes that will predict
whether a student plans to
attend college.
Module 17: Introduction to Data Mining 9
BETA MATERIALS FOR MICROSOFT CERTIFIED TRAINER PREPARATION PURPOSES ONLY
Demonstration: Determining Why Students Attend College
In this demonstration, you will create a data mining model by using a decision
tree with relational data. Specifically, you will create a decision tree that
determines what causes students to attend college.
Topic Objective
To demonstrate how to
create a data mining model
by using a decision tree with
relational data.
Lead-in
In this demonstration, you
will learn how to create a
decision tree that
determines what causes
students to attend college.
Delivery Tips
The steps for this
demonstration are included
in the Instructor Notes.
Encourage students to
follow your demonstration
on their computers.
10 Module 17: Introduction to Data Mining
BETA MATERIALS FOR MICROSOFT CERTIFIED TRAINER PREPARATION PURPOSES ONLY
Exploring the Decision Tree
Attend College:
33% Yes
67% No
All Students
Parental
Encouragement
?
IQ IQ
Attend College
:
57% Yes
43% No
Parents Encourage = Yes
Attend College:
6% Yes
94% No
Parents Encourage = No
Attend College:
74% Yes
26% No
Attend College:
29% Yes
71% No
High IQ Low IQ
Attend College
:
18% Yes
82% No
Attend College
:
9% Yes
91% No
Attend College:
4% Yes
96% No
High IQ
Medium IQ
Low IQ
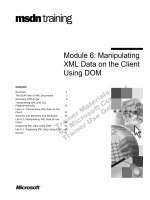
Applying a decision tree algorithm to the survey data, the following
relationships are discovered:
!
Of students surveyed, 32.68 percent plan to attend college. The remaining
students do not plan to attend.
!
The most dominant attribute in predicting whether a student is likely to
attend college is whether their parents encourage them to attend.
The most dominant attribute is always the first rule in the decision tree.
!
Students who received encouragement from their parents had a 57.27
percent probability of planning to attend. This is much higher than the
general population. Of the students who were encouraged by their parents:
• Those with an IQ higher than 110.25 had more than a 74 percent
probability of attending college.
• Those who also had parents with a high income were even more likely to
attend college—77 percent.
!
Students who did not receive encouragement had a very low probability,
6.22 percent, of planning to attend. Of the students who were not
encouraged by their parents:
• Those students with a very high IQ had a higher probability than those
with a lower IQ. Of students with an IQ higher than 118.25, 17.96
percent plan to attend versus 3.52 percent of students with an IQ lower
than 99.25.
• Parental income had no impact on the likelihood of planning to attend
college if the student were exceptionally smart with an IQ higher than
118.25.
Topic Objective
To demonstrate how data
mining is applied by using a
decision tree.
Lead-in
Looking at all the students
interviewed, roughly 33
percent plan to attend and
the remaining do not plan to
attend.
Delivery Tips
After switching to the slide,
ask students the following
question: Of the collected
attributes, which do you
think is most likely to have
an impact on a student’s
decision to attend college?
Then use the build slide to
step through the results.
Switch to Analysis Manager
to show the same results in
the Relational Mining Model
Editor.
Ti
p
Module 17: Introduction to Data Mining 11
BETA MATERIALS FOR MICROSOFT CERTIFIED TRAINER PREPARATION PURPOSES ONLY
This example demonstrates that data mining allows you to validate or discredit
specific hypothesis. Data mining also helps you identify patterns that you may
not expect or notice by analyzing the data manually.
12 Module 17: Introduction to Data Mining
BETA MATERIALS FOR MICROSOFT CERTIFIED TRAINER PREPARATION PURPOSES ONLY
Training a Data Mining Model
Mining Model
DM
Engine
Data
To Predict
DM
Engine
Predicted Data
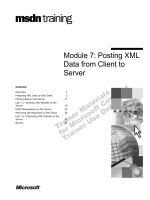
Training Data Mining Model
To create a model, you must assemble a set of data where the attributes to be
predicted are known. Such a data set is called the training data. During the
training process, data is inserted into the data mining model. The data mining
model analyzes the training data and looks for rules and patterns that can be
used later to determine the predictive columns.
You perform training by processing the data mining model in Analysis
Manager.
The training data has two characteristics:
!
It is typically historical data.
!
It is statistically representative of the cases for which you are building a
predictive model.
The case is the basic unit for analysis in the mining model. The case is the
element that is used for classifying and grouping the data.
As depicted in the preceding illustration, the data mining engine evaluates the
cases identified in the training data and creates the model based on the
algorithm selected. When the model is built, it can be applied to future data to
predict outcomes or classify data.
Topic Objective
To explain the methodology
for creating a mining model
and to define terminology.
Lead-in
When creating a data
mining model, you need a
training data set. This is
typically historical data
where the attributes to be
predicted are known.
Delivery Tip
Use the build slide to
explain how Analysis Server
evaluates training data to
build a data mining model,
and then uses the model to
predict future outcomes
based on new data sets.
Module 17: Introduction to Data Mining 13
BETA MATERIALS FOR MICROSOFT CERTIFIED TRAINER PREPARATION PURPOSES ONLY
#
##
#
Building a Data Mining Model with OLAP Data
!
Introducing the Membership Card Scenario
!
Selecting the Data Mining Technique
!
Selecting the Case
!
Selecting Predicted Entity
!
Selecting Training Data
!
Creating a Dimension and Virtual Cube
!
Browsing the Data Mining Model
You can use the Mining Model Wizard in Analysis Manager to create a data
mining model. This section uses the Membership Card scenario to demonstrate
the creation of a data mining model.
Building and reviewing a data mining model entails several steps:
1. Selecting the data mining technique.
2. Identifying the case.
3. Selecting the entity to be predicted.
4. Identifying the training data.
5. Optionally creating a dimension and virtual cube from the resulting model.
6. Processing the model and browsing the results.
Topic Objective
To describe the steps used
to build a data mining model
with OLAP data.
Lead-in
These are a variety of steps
involved in building a data
mining model with OLAP
data.
14 Module 17: Introduction to Data Mining
BETA MATERIALS FOR MICROSOFT CERTIFIED TRAINER PREPARATION PURPOSES ONLY
Introducing the Membership Card Scenario
!
The VP of Marketing Wants to Evaluate Member Card Programs
$
Identify opportunities for enhancing services at each current
card level
$
Market programs based on customer demographics
!
We Will Predict Card Selection Patterns By Using Data Mining
$
Find membership card selection patterns
$
Select Customer as the mined dimension
$
Select the Member Card property as the pattern identifier
$
Use Customer demographics to train the model
$
Browse the decision tree
The Vice President of Marketing of Foodmart wants to evaluate current
member card programs. To improve customer retention and satisfaction, she
specifically wants to identify opportunities for enhancing services provided at
each card level:
!
Golden
!
Silver
!
Bronze
!
Normal
Demographic information about customers is available. The information
includes:
!
Gender
!
Marital status
!
Yearly income
!
Education level
In this card membership scenario, you will learn how historical data in the
Foodmart 2000 Sales cube predicts the likelihood of customers applying for
different levels of membership cards based on a variety of attributes.
Topic Objective
To introduce a business
scenario for creating a
model.
Lead-in
The Vice President of
Marketing of Foodmart
wants to evaluate the
current member card
programs.
Delivery Tip
Use this example to
describe each of the
following pages in this
section.
Module 17: Introduction to Data Mining 15
BETA MATERIALS FOR MICROSOFT CERTIFIED TRAINER PREPARATION PURPOSES ONLY
Following is the systematic process for predicting the card selection patterns:
1. Use the Microsoft Decision Tree model to find card selection patterns in the
customer base.
2. Select the Customer as the dimension being mined—the case dimension.
3. Select the Member Card member property as the information used by the
data mining algorithm to identify the patterns.
4. Use the Customer demographic information available to train the model.
5. Browse the decision tree that is created by using the data mining algorithm.
Based on the patterns discovered, the marketing department can enhance the
services available at each card level to ensure that the specific card programs
are suited to customers who apply for each type of card.
16 Module 17: Introduction to Data Mining
BETA MATERIALS FOR MICROSOFT CERTIFIED TRAINER PREPARATION PURPOSES ONLY
Selecting the Data Mining Technique
There are varieties of data mining techniques used to build a data mining
model. Microsoft currently offers two data mining techniques:
!
Microsoft Decision Trees
!
Microsoft Clustering
The Microsoft Decision Trees technique is used for classification and
prediction. You can use the decision tree technique for the membership card
scenario because it predicts and assigns probabilities of outcomes based on a
variety of attributes. The objective of the scenario is to predict card levels based
on demographic characteristics of customers.
The Microsoft Clustering technique is used for classification. It is a method that
uses various techniques to group records into groups or clusters that exhibit
similar, predictable characteristics.
The Mining Model Wizard prompts you to select the technique for creating the
model.
Topic Objective
To demonstrate how to
select the data mining
technique by using the
Wizard.
Lead-in
Microsoft offers two data
mining techniques: Microsoft
Decision Trees and
Microsoft Clustering. You
select decision trees in this
case because it is a good
technique for prediction.
Module 17: Introduction to Data Mining 17
BETA MATERIALS FOR MICROSOFT CERTIFIED TRAINER PREPARATION PURPOSES ONLY
Selecting the Case
The case is the basic unit for analysis in the mining model. It is the base
element for classifying and grouping data.
In the first data mining example presented in this module—whether a student
will attend college or not—the case is each student. In this membership card
example, the case is each customer in the Foodmart database.
In an OLAP cube, the case is a level—typically the leaf level—of a dimension.
The Mining Model Wizard prompts you to select the case that you want use to
create the model.
Topic Objective
To demonstrate how to
select the case for an OLAP
mining model.
Lead-in
The case is the basic unit
for analysis in the mining
model—the base element
for classifying and grouping
data.
Delivery Tip
Ask students what the case
dimension and level are for
the membership card
scenario.
18 Module 17: Introduction to Data Mining
BETA MATERIALS FOR MICROSOFT CERTIFIED TRAINER PREPARATION PURPOSES ONLY
Selecting the Predicted Entity
The predicted entity is the element you want the model to predict.
In the students attending college example, “planning to attend college or not” is
the predicted entity. In the membership card scenario, you want to predict what
membership card a person is likely to apply for based on that person’s
demographic attributes. Therefore, the predicted entity is membership card.
In an OLAP cube, a predicted element can be:
!
A measure
!
A member property of the case level
!
Members of another dimension
Although only one entity can be see from the wizard, additional entities can be predicted in one model using the editor.
Although only one predicted entity can be selected by using the wizard,
additional entities may be added by using the Data Mining Editor.
The Mining Model Wizard prompts you to select the predicted entity for this
model.
Topic Objective
To define the predicted
entity and demonstrate how
to select the predicted entity
in the wizard.
Lead-in
The predicted entity is the
element you want the model
to predict. The predicted
entity can be a measure, a
member property of the
case level, or a member of
another dimension.
Delivery Tip
Ask students what the
predicted entity is in the
membership card scenario.
Note
Module 17: Introduction to Data Mining 19
BETA MATERIALS FOR MICROSOFT CERTIFIED TRAINER PREPARATION PURPOSES ONLY
Selecting Training Data
To build the model, the model must “learn” from the training data.
The training data is a statistically representative subset of historical data where
the attributes to be predicted are known. The training data must contain the case
data element, the predicted entity, and at least one other attribute that can be
used for predicting that entity.
The Mining Model Wizard prompts you to select the training data to be used in
building the model.
Topic Objective
To review the meaning of
training data and
demonstrate how to select
training data.
Lead-in
What is training data? What
training data would you like
to use in this model?