Tài liệu Coatings Technology Handbook P2 ppt
Bạn đang xem bản rút gọn của tài liệu. Xem và tải ngay bản đầy đủ của tài liệu tại đây (324.96 KB, 10 trang )
Coating Rheology 2-13
In the discussion above, high surface tension and low viscosity are required for good flow-out and
leveling. But high surface tension can cause cratering, and excessively low viscosity would result in sagging
and poor edge coverage. To obtain an optimal coating, the balance between surface tension and viscosity
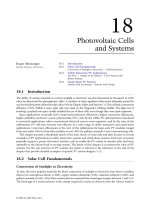
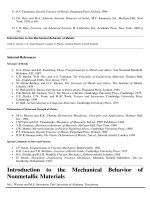
is important. Figure 2.12 illustrates coating performance as a function of surface tension and melt
viscosity. Coating is a fairly complex process; achieving an optimal result calls for the consideration of
many factors.
Acknowledgments
We are grateful to Steve Trigwell for preparing the figures.
References
1. A. W. Adamson, Physical Chemistry of Surfaces, 4th ed. New York: Wiley, 1982.
2. L. Du Nouy, J. Gen. Physiol., 1, 521 (1919).
3. R. H. Dettre and R. E. Johnson, Jr., J. Colloid Interface Sci., 21, 367 (1966).
4. D. S. Ambwani and T. Fort, Jr., Surface Colloid Sci., 11, 93 (1979).
5. J. R. J. Harford and E. F. T. White, Plast. Polym., 37, 53 (1969).
6. J. Twin, Phil. Trans., 29–30, 739 (1718).
7. J. W. Strutt (Lord Rayleigh), Proc. R. Soc. London, A92, 184 (1915).
8. S. Sugden, J. Chem. Soc., 1483 (1921).
9. J. M. Andreas, E. A. Hauser, and W. B. Tucker, J. Phys. Chem., 42, 1001 (1938).
10. S. Wu, J. Polym. Sci., C34, 19 (1971).
11. R. J. Roe, J. Colloid Interface Sci., 31, 228 (1969).
12. S. Fordham, Prac. R. Soc. London., A194, 1 (1948).
13. C. E. Stauffer, J. Phys. Chem., 69, 1933 (1965).
14. J. F. Padday and A. R. Pitt, Phil. Trans. R. Soc. London, A275, 489 (1973).
15. H. H. Girault, D. J. Schiffrin, and B. D. V. Smith, J. Colloid Interface Sci., 101, 257 (1984).
16. C. Huh and R. L. Reed, J. Colloid Interface Sci., 91, 472 (1983).
FIGURE 2.12 The effects of surface tension and melt viscosity on coating appearance.
High
Low
Surface Tension
Acceptable Appearance
Increasingly Better Flow
Sagging
Poor Flow
(Melt Viscosity
too High)
Poor Flow
(Surface Tension too Low)
Low High
Melt Viscosity
Cratering
(Surface Tension too High)
DK4036_book.fm Page 13 Monday, April 25, 2005 12:18 PM
© 2006 by Taylor & Francis Group, LLC
2-14 Coatings Technology Handbook, Third Edition
17. Y. Rotenberg, L. Boruvka, and A. W. Neumann, J. Colloid Interface Sci., 93, 169 (1983).
18. O. C. Lin, Chemtech, January 1975, p. 15.
19. L. Kornum, Rheol. Acta., 18, 178 (1979).
20. O. C. Lin, J. Apl. Polym. Sci., 19, 199 (1975).
21. H. Freundlich and A. D. Jones, J. Phys. Chem., 4(40), 1217 (1936).
22. W. H. Bauer and E. A. Collins, in Rheology, Vol. 4, F. Eirich, Ed. New York: Academic Press, 1967,
Chapter 8.
23. P. S. Roller, J. Phys. Chem., 43, 457 (1939).
24. S. Reiner and G. W. Scott Blair, in Rheology, Vol. 4, F. Eirich, Ed. New York: Academic Press, 1967,
Chapter 9.
25. S. LeSota, Paint Varnish. Prod., 47, 60 (1957).
26. R. B. Bird, R. C. Armstrong, and O. Hassager, Dynamics of Polymeric Fluids, Vol. 1. New York:
Wiley-Interscience, 1987, p. 61.
27. S. J. Storfer, J. T. DiPiazza, and R. E. Moran, J. Coating Technol., 60, 37 (1988).
28. V. G. Nix and J. S. Dodge, J. Paint Technol., 45, 59 (1973).
29. T. C. Patton, Paint Flow and Pigment Dispersion, 2nd ed. New York: Wiley-Interscience, 1979.
30. A. G. Frederickson, Principles and Applications of Rheology. Englewood Cliffs, NJ: Prentice Hall,
1964.
31. S. Wu, J. Appl. Polym. Sci., 22, 2769 (1978).
32. J. F. Rhodes and S. E. Orchard, J. Appl. Sci. Res. A, 11, 451 (1962).
33. R. K. Waring, Rheology, 2, 307 (1931).
34. N. O. P. Smith, S. E. Orchard, and A. J. Rhind-Tutt, J. Oil Colour. Chem. Assoc., 44, 618 (1961).
35. S. Wu, J. Appl. Polym. Sci., 22, 2783 (1978).
36. J. S. Dodge, J. Paint Technol., 44, 72 (1972).
37. K. Walters and R. K. Kemp, in Polymer Systems: Deformation and Flow. R. E. Wetton and R. W.
Wharlow, Eds. New York: Macmillan, 1967, p. 237.
38. A. Quach and C. M. Hansen, J. Paint Technol., 46, 592 (1974).
39. L. O. Kornum and H. K. Raaschou Nielsen, Progr. Org. Coatings, 8, 275 (1980).
40. L. Weh, Plaste Kautsch, 20, 138 (1973).
41. C. G. M. Marangoni, Nuovo Cimento, 2, 239 (1971).
42. C. M. Hansen and P. E. Pierce, Ind. Eng. Chem. Prod. Res. Dev., 12, 67 (1973).
43. C. M. Hansen and Pierce, Ind. Eng. Chem. Prod. Res. Dev., 13, 218 (1974).
44. J. N. Anand and H. J. Karma, J. Colloid Interface Sci., 31, 208 (1969).
45. J. R. A. Pearson, J. Fluid Mech., 4, 489 (1958).
46. P. Fink-Jensen, Farbe Lack, 68, 155 (1962).
47. A. V. Hersey, Phys. Ser., 2, 56, 204 (1939).
48. T. Satoh and N. Takano, Colour Mater., 47, 402 (1974).
DK4036_book.fm Page 14 Monday, April 25, 2005 12:18 PM
© 2006 by Taylor & Francis Group, LLC
3
-1
3
Leveling
3.1 Introduction
3-
1
3.2 Yield Value
3-
1
3.3 Leveling and Viscosity
3-
2
Thixotropy
3.4 Leveling and Surface Tension
3-
3
3.5 Leveling of Brush and Striation Marks
3-
4
References
3-
4
Bibliography
3-
4
3.1 Introduction
A coating is applied to a surface by a mechanical force: by a stroke of a brush, by transfer from a roll,
by removing the excess with a knife’s edge, or by other means. Most of these coating processes leave
surface disturbances: a brush leaves brush marks; a reverse roll coater leaves longitudinal striations; knife
coating leaves machine direction streak; roll coating leaves a rough surface, when the coating splits
between the roll and the substrate; and spraying may produce a surface resembling orange peel.
3.2 Yield Value
These surface disturbances may disappear before the coating is dried, or they may remain, depending
on the coating properties and time elapsed between the coating application and its solidification. The
surface leveling process is driven by surface tension and resisted by viscosity. Some coatings, especially
thickened aqueous emulsions, may exhibit pseudoplastic flow characteristics and may have a yield value:
driving force (surface tension) must be higher than the yield value. Solution coatings are usually New-
Viscosity measurements at very low shear rates are required to determine the yield value. Some of the
operates at shear rates of 0.6 to 24 sec
–1
, is not suitable for investigating the leveling effects that appear
at much lower shear rates. Shear rates experienced during various coating processes are very high, and
the viscosity measurements at low shear rates might not disclose coating behavior at these high shear rates.
A yield value of 0.5 dynes/cm
2
produces very fine brush marks, while a yield value of 20 dynes/cm
2
produces pronounced brush marks. The yield stress necessary to suppress sagging is estimated at 5 dynes/
D. Satas*
Satas & Associates
* Deceased.
DK4036_book.fm Page 1 Monday, April 25, 2005 12:18 PM
© 2006 by Taylor & Francis Group, LLC
tonian (have no yield value) and level rather well. Hot melt coatings solidify fast and may not level
shear rates experienced in various processes are shown in Table 3.2. A Brookfield viscometer, which
adequately. Some typical yield values for various coatings are given in Table 3.1.
minimum force required to cause the coating to flow (see Figure 3.1). For such coating to level, the
3
-2
Coatings Technology Handbook, Third Edition
cm
2
, which is not compatible with the best leveling properties. Therefore, to produce both adequate
leveling and nonsagging behavior, thixotropic properties must be introduced to a coating.
3.3 Leveling and Viscosity
The driving force of the leveling process is surface tension. The force that resists leveling is viscosity and,
to a lesser degree, the elasticity of a coating. To facilitate leveling, therefore, it is desirable to employ
coating of low viscosity. Low viscosity coatings, however, cannot always be used. It is difficult to deposit
heavy coatings if the viscosity is low. If the coating is applied on a vertical surface, a high viscosity is
needed to prevent sagging.
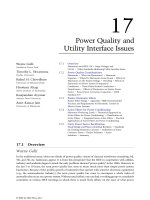
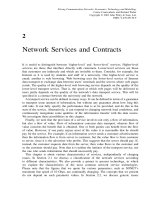
Aqueous coatings are often pseudoplastic: they exhibit a rate-dependent viscosity. They may have a
low viscosity (20 to 30 mPa
⋅
sec) at high shear rates (10
4
sec
–1
), such as experienced in roll coating
FIGURE 3.1
Viscosity of pseudoplastic emulsion coating as a function of shear rate compared to Newtonian oil.
TA B LE 3.1
Yield Values and Thixotropy Ratings for Various Coatings
Coating Type Yield Value (dynes/cm
2
)Thixotropy Rating
Enamels, glossy 0–30 None to slight
Enamels, semiglossy 50–120 Slight
Flat paints 20–100 Slight to marked
Aqueous wall coatings 10–100 Slight to marked
Metal primers 0–100 None to marked
Va rnishes 0 None
TA B LE 3.2
Shear Rates for Various Processes
Process Shear Rate (sec
–1
)
Leveling 0.01–0.10
Pouring if solution 10–100
Mixing 50–1,000
Reverse roll coating 100–10,000
Knife over roll coating 1,000–10,000
Brushing 10,000–50,000
Spraying 10,000–70,000
12
10
8
6
4
2
0 100 200 300 400 500
Shear Rate, sec
−1
Oil
Latex Coating
DK4036_book.fm Page 2 Monday, April 25, 2005 12:18 PM
© 2006 by Taylor & Francis Group, LLC
Leveling
3
-3
operations, and a much higher viscosity (1 to 3 pa
⋅
sec) at low shear rates (0.01 to 10 sec
–1
), prevalent
during leveling. Such coatings do not level well because of the high viscosity at low shear rates.
The rheology index is sometimes used as an indicator of the leveling capabilities of a coating. The
rheology index is defined as the ratio of high shear rate viscosity to low shear rate viscosity. If the rheology
index is one, the coating is Newtonian; if it is larger than one, the coating is dilatant; if it is smaller than
one, the coating is pseudoplastic. A large rheology index favors good leveling; it should exceed 0.25 for
aqueous systems of acceptable leveling properties.
3.3.1 Thixotropy
Thixotropic behavior of some coatings is utilized to circumvent the dilemma of having a coating of
sufficiently low viscosity that levels well and a coating of sufficiently high viscosity that does not sag.
Thixotropy is the dependence of viscosity on time. There are coatings that retain a low viscosity for a
short period after shearing, thus allowing good leveling, but that thicken fast enough to prevent sagging.
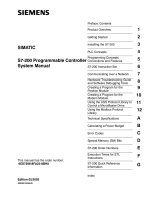
The thixotropic behavior of a coating is usually characterized by the thixotropy loop as shown in
Figure 3.2. At the beginning, the coating is sheared at a continuously increasing shear rate, producing
curve
a
. Then the coating is sheared at a constant shear rate until constant viscosity (curve
b
) is reached.
The shear rate is then gradually decreased, producing curve
c
. The area enclosed by the thixotropy loop
indicates the degree of thixotropy: the larger the area, the more pronounced is the thixotropic behavior
of the coating. A pseudoplastic coating that exhibits no thixotropy would form no loop, and curve
a
would coincide with curve
c
. Curve
b
would not be formed, because the viscosity is not time dependent
in nonthixotropic coatings. Thixotropic behavior is quite common in many aqueous coatings and high
viscosity inks, and it is utilized to improve the coatability.
3.4 Leveling and Surface Tension
If the coating contains ingredients of differing surface tension and volatility, a surface tension gradient
may be formed during drying, which results in poor leveling.
1
This behavior was observed when a drop
of alkyd resin was dried in heptane solution. A high surface tension is created around the outer edges
because of a faster solvent evaporation rate in that region. This causes a flow of the solution from the
center of the drop, resulting in formation of a doughnut-shaped resin deposit. When xylene is employed
as the solvent, the result is the opposite. A region of lower surface tension is produced around the outer
perimeter of the drop, resulting in a thicker center of the dried deposit. The addition of a solvent-soluble
surface active agent eliminates the formation of the surface tension gradient, resulting in a dried deposit
of uniform thickness.
FIGURE 3.2
Thixotropic loop.
c
a
b
Shear Stress
Shear Rate
DK4036_book.fm Page 3 Monday, April 25, 2005 12:18 PM
© 2006 by Taylor & Francis Group, LLC
3
-4
Coatings Technology Handbook, Third Edition
3.5 Leveling of Brush and Striation Marks
Brush application produces brush marks dependent on the rush fineness. Reverse roll and other roll
coaters in which the coating splits between the rolls produce regular longitudinal striation marks in the
coating. Knife coaters produce longitudinal streaks caused by the restriction of the flow under the knife
by gel and other particles. The geometry of such coating striations or brush marks is shown schematically
in Figure 3.3.
According to Orchard’s
2
mathematical model of the leveling process, the leveling half-time may be
expressed in the following manner:
T
1/2
∝
where
γ
is the surface tension and
η
L
the viscosity (at low shear rate).
The equation states that a low viscosity and a high surface tension favor the rate of leveling. The geometry
of the coating (distance between striation marks and the coating thickness) has a very large effect on
leveling. Decreasing the distance between the striation or brush marks is very effective in accelerating
leveling, as is an increase in coating thickness. It has also been stated by some authors
3
that coating elasticity
has a retarding effect on leveling, although the effect is less important than that of viscosity.
References
1. D. A. Bultman and M. T. Pike,
J. Chem. Spec. Manuf. Assoc.,
January 1981.
2. S. Orchard,
Appl. Sci. Res., A11,
451 (1962).
3. M. Bierman,
Rheol. Acta,
138 (1968).
Bibliography
Beeferman, H. L., and D. A. Bregren,
J. Paint Technol., 38
(492), 9–17 (1966).
Kooistra, M. F., “Film formation phenomena: Fundamentals and applications,” in
Third International
Conference in Organic Coatings Science and Technology,
G. D. Parfitt and A. V. Patsis, Eds. Westport,
CT: Technomic, 1979.
Matsuda, T., and W. H. Brendly, Jr.,
J. Coating Technol.,
51
(658), 46–60 (1979).
Overdiep, W. S. “The leveling of paints,” in
Proceedings of the Conference on Physical Chemistry and
Hydrodynamics,
Oxford, July 1–13, 1977.
Patton, T. C.,
Paint Flow and Pigment Dispersion,
2nd ed. New York: Wiley, 1979.
Satas, D., “Surface appearance,” in
Plastics Finishing and Decoration,
D. Satas, Ed. New York: Van Nostrand
Reinhold, 1986, pp. 17–20.
Smith, N. D. P., S. E. Orchard, and A. J. Rhind-Tutt,
J. Oil Chem. Colour. Assoc., 44
,
618–633 (September
1961).
FIGURE 3.3
Profile of coating striation marks.
h
D
λ
η
γ
λL
h
4
3
DK4036_book.fm Page 4 Monday, April 25, 2005 12:18 PM
© 2006 by Taylor & Francis Group, LLC
4
-1
4
Structure–Property
Relationships in
Polymers
4.1 Structural Parameters
4-
1
4.2 Properties of Wet Coatings
4-
2
4.3 Properties of Dried Films
4-
4
References
4-
6
Most of the binders used in paints, varnishes, lacquer films, and photolithographic coatings are made
up of macromolecules. The final dry coating consists predominately of a polymer, either cross-linked or
un-cross-linked. The material may have been polymeric before application or cured to become a polymer
after application. In either case, a knowledge of the properties of polymers as related to structural features
helps in obtaining coatings with desired performance characteristics.
4.1 Structural Parameters
We begin by defining some important structural parameters of polymers.
4.1.1 Molecular-Weight Averages
As all polymers contain a distribution of molecules of differing masses, it is customary to define averages
of the distribution:
where
N
i
= number of molecules of molar mass
M
i
, and
w
i
their weight, and
α
is the Mark–Houwink
exponent defined by
M
NM
N
M
n
ii
i
w
(
(
number average)
weight averag
−=
∑
∑
−
ee)
viscosity average
=
∑
∑
−=∑
wM
w
MwM
ii
i
vii
a
()[]
1//α
Subbu Venkatraman
Raychem Corporation
DK4036_C004.fm Page 1 Thursday, May 12, 2005 9:39 AM
© 2006 by Taylor & Francis Group, LLC
Molecular-Weight Averages • Molecular Weight Between
Viscosity of Polymer Solutions • Viscosity of Suspensions
Cross-Links • Particle Size and Particle Size Distribution
The Glass Transition Temperature • Tensile and Shear Moduli •
Other Properties
4
-2
Coatings Technology Handbook, Third Edition
(4.1)
where [
η
] is the intrinsic viscosity.
The number
M
n
is usually measured by nuclear magnetic resonance (NMR) spectrometry or osmom-
etry;
M
w
can be obtained via light-scattering techniques, while intrinsic viscosity measurements yield
estimates of
M
v
, Size-exclusion chromatography or gel permeation chromatography (GPA) can, in prin-
ciple, be used to obtain all the averages mentioned above; care must be taken to ensure proper calibration
of the column with standards that have the same molecular structure as the polymer of interest.
Although different definitions exist for the breadth of a distribution, we will use the most common
one involving the averages defined above:
A value of unity for this quantity defines a “narrow distribution” polymer; a value of 2 is obtained in
condensation polymers, and higher values indicate considerable breadth of molecular weights. A measure
of this quantity can be obtained via GPC, or a combination of NMR and light-scattering techniques.
4.1.2 Molecular Weight Between Cross-Links
This is defined as the average molar mass between successive cross-link sites in a network polymer and
is denoted by the symbol
M
c
. It is a measure of the density of cross-linking and can be estimated from
measurements of the equilibrium degree of swelling or of the modulus.
4.1.3 Particle Size and Particle Size Distribution
In the case of latexes, many properties of the wet and dry coatings are determined by the sizes of the
latex particles. Estimations can be obtained directly through scanning electron micrography (SEM) if a
film can be made. For the suspension, however, it is more customary to use light-scattering techniques
(Coulter model N4, Brookhaven model DCP-1000) or optical sedimentation techniques (Horiba CAPA-
700). In either case, it is possible to obtain a major portion of the particle size distribution.
4.2 Properties of Wet Coatings
Described below are some of the more important properties of coatings that are relevant to their ease of
application, either in solution or as suspensions. Most wet coatings are brushed on (as with paints) or
sprayed on (as with some epoxies used as insulation). The solution coatings are mostly polymer based,
and thus a survey of the rheological properties of polymer solutions is given; in addition, some properties
of suspensions are discussed.
4.2.1 Viscosity of Polymer Solutions
Although several theories of polymer solutions
1
examine the dependence of viscoelastic properties on
molecular parameters, we shall not discuss these here. Instead, we shall focus on some generally accepted
empirical relationships. Most of these are covered extensively by Ferry.
2
4.2.1.1 Dependence on Molecular Weight
For pure polymers, the molecular weight dependence is usually expressed by the following type of
relationship:
[]η
α
= KM
v
MWD (molecular weight dispersity) =
M
M
w
n
DK4036_C004.fm Page 2 Thursday, May 12, 2005 9:39 AM
© 2006 by Taylor & Francis Group, LLC
Structure–Property Relationships in Polymers
4
-3
(4.2)
where
η
0
is the “zero-shear” viscosity, and
K
is a solvent- and temperature-dependent constant. The value
of the exponent
β
is determined by the molecular weight range under consideration:
for
M
<
M
c
,
β
= 1 and for M >
M
c
,
β
= 3.4 (4.3)
where
M
c
is a critical molecular weight that expresses the onset of entanglements between molecules. The
magnitude of
M
c
is characteristic of the polymer structure; Table 4.1 gives some representative numbers.
Although
M
c
signals the onset of topological effects on the viscosity, it is not identical to the molecular
weight between entanglements,
M
e
. (The latter quantity is estimated from the magnitude of the rubbery
plateau modulus.) Approximately, we have
(4.4)
Also,
M
c
is a function of polymer concentration. In the pure polymer (denoted by superscript zero),
it attains its lowest value, ; in a solution of concentration
C
, its magnitude varies as discussed in
Section 4.2.1.2.
The exponent
β
assumes the values quoted in Equation 4.3 only if the measured viscosity is in the so-
called zero-shear-rate limit. At higher rates,
β
assumes values lower than unity and 3.4, in the two regimes.
4.2.1.2 Concentration Dependence of the Viscosity
As mentioned in Section 4.2.1.1, below a certain concentration, C*, entanglement effects are not signif-
icant. This concentration is estimated from the following:
(4.4a)
where
M
is the molecular weight of the polymer in the coating solution. The concentration C* cannot be
estimated from a plot of
η
0
against concentration, however; the transition is not sharp, but gradual.
4
No
single expression for the concentration exists below C
*
; however, in the entangled regime, the expression
(4.5)
works well for some polymers.
5,6
This relation does not hold all the way to the pure polymer, where
higher exponents are found.
6
Equation 4.5 also does not hold in the case of polymer solutions in which
there are other specific attractive forces, such as in poly(
n
-alkyl acrylates).
7
TA B LE 4.1
Critical Molecular Weight
of Source Polymers
Polymer M
c
Polyvinyl chloride 6,200
Polyethylene 3,500
Polyvinyl acetate 25,000
Polymethyl acrylate 24,000
Polystyrene 35,000
Source
: From D. W. Van Krevelen,
Proper-
ties of Polymers
, Elsevier, New York, 1976.
3
η
0
= KM
β
MM
ce
~2
M
c
0
C
M
M
c
* =ρ
0
η
0
534
= CM
.
DK4036_C004.fm Page 3 Thursday, May 12, 2005 9:39 AM
© 2006 by Taylor & Francis Group, LLC
4
-4
Coatings Technology Handbook, Third Edition
There are two reasons for a reduction in viscosity of a polymer upon dilution: (a) the dilution effect,
which causes the solution viscosity to be between those of the two pure components, and (b) a decrease of
viscosity due to a lowering of
T
g
upon dilution. The latter is solvent-specific and is the main reason for the
apparent difficulty in establishing a universal viscosity–concentration relationship for polymer solutions.
4.2.2 Viscosity of Suspensions
Many latex paints are suspensions in water or in an organic solvent. Their rheological properties differ
from those of polymer solutions in several ways. The concentration dependence is of a different form,
and in addition, there is a dependence on particle size. Also, at high concentrations, these suspensions
tend to have structure, which usually refers to an aggregated network. The immediate consequences of
the existence of a pseudonetwork are the phenomena of yield stress and thixotropy. We explore next the
relationship of these quantities to the characteristics of the particles making up the suspension.
4.2.2.1 Concentration Dependence of the Viscosity
In dilute suspensions, the concentration dependence is expressed by an extension of the Einstein equation:
(4.6)
where
η
s
is the solvent viscosity, and
φ
is the volume fraction of the suspension. Equation 4.6 is valid for
spherical particles without any interparticle interaction. Inclusion of long-range interaction (such as
volume exclusion) merely changes the coefficient of the
φ
2
term.
Of greater interest are the rheological phenomena that occur in suspensions of particles that have
short-range interactions, attractive or repulsive. In a comprehensive study, Matsumoto et al.
8
have
established the conditions for the existence of yield stresses in suspension. Their conclusions are as follows:
1. For particles with repulsive interactions, no yield stresses exist.
2. Suspensions of neutral particles, or particles with attractive forces, do exhibit yield stresses.
3. The magnitude of the yield stress increases with the concentration of the particles and with
increasing ratio of surface area to volume.
In this study, the existence of the yield stress was inferred from the presence of a plateau in the elastic
modulus G
′
, at very low frequencies; the magnitude of the yield stress was deduced from the height of
the plateau modulus. A detailed and critical survey of the literature is given by Meitz.
9
The other important rheological consequence of a pseudonetwork is thixotropy, defined elsewhere in
this volume. The phenomenon is attributed to a time-dependent but reversible breakdown of the network.
4.3 Properties of Dried Films
4.3.1 The Glass Transition Temperature
The
T
g
is defined in various ways, but in a broad sense, it signals the onset of small-scale motion in a
polymer. It is heavily influenced by the chemical structure, in particular, by the bulkiness (steric hin-
drance) of pendant groups. (See Van Kreleven
10
for an excellent discussion.)
The molecular weight dependence of the glass transition is fairly straightforward and is given by the
following:
(4.7)
where is the limiting value of
T
g
at high molecular weights.
η
η
η
φφ
rel
==+ +
s
125 141
2
TT
M
M
gg
n
=−
∞
T
g
∞
DK4036_C004.fm Page 4 Thursday, May 12, 2005 9:39 AM
© 2006 by Taylor & Francis Group, LLC