Tài liệu Power Electronic Handbook P17 ppt
Bạn đang xem bản rút gọn của tài liệu. Xem và tải ngay bản đầy đủ của tài liệu tại đây (1.74 MB, 63 trang )
© 2002 by CRC Press LLC
17
Power Quality and
Utility Interface Issues
17.1 Overview
Harmonics and IEEE 519 • Surge Voltages and
C62.41 • Other Standards Addressing Utility Interface Issues
17.2 Power Quality Considerations
Harmonics • What Are Harmonics? • Harmonic
Sequence • Where Do Harmonics Come From? • Effects of
Harmonics on the System Voltage • Notching • Effects of
Harmonics on Power System Components •
Conductors • Three-Phase Neutral Conductors •
Transformers • Effects of Harmonics on System Power
Factor • Power Factor Correction Capacitors • IEEE
Standard 519
17.3 Passive Harmonic Filters
Passive Filter Design • Appendix—IEEE Recommended
Practices and Requirements for Harmonic Control in
Electric Power Systems
17.4 Active Filters for Power Conditioning
Harmonic-Producing Loads • Theoretical Approach to
Active Filters for Power Conditioning • Classification of
Active Filters • Integrated Series Active Filters • Practical
Applications of Active Filters for Power Conditioning
17.5 Unity Power Factor Rectification
Diode Bridge and Phase-Controlled Rectifiers • Standards
for Limiting Harmonic Currents • Definitions of Some
Common Terms • Passive Solutions • Active
Solutions • Summary
17.1 Overview
Wayne Galli
In the traditional sense, when one thinks of power quality, visions of classical waveforms containing 3rd,
5th, and 7th, etc. harmonics appear. It is from this perspective that the IEEE in cooperation with utilities,
industry, and academia began to attack the early problems deemed “power quality” in the 1980s. However, in
the last 5 to 10 years, the term
power quality
has come to mean much more than simple power system
harmonics. Because of the prolific growth of industries that operate with sensitive electronic equipment
(e.g., the semiconductor industry), the term power quality has come to encompass a whole realm of
anomalies that occur on a power system. Without much effort, one can find a working group or a standards
committee at various IEEE meetings in which there is much lively debate on the issue of what power
Wayne Galli
Southwest Power Pool
Timothy L. Skvarenina
Purdue University
Badrul H. Chowdhury
University of Missouri–Rolla
Hirofumi Akagi
Tokyo Institute of Technology
Rajapandian Ayyanar
Arizona State University
Amit Kumar Jain
University of Minnesota
© 2002 by CRC Press LLC
quality entails and how to define various power quality events. The IEEE Emerald Book (IEEE Standard
1100-1999,
IEEE Recommended Practice for Power and Grounding Electronic Equipment
) defines power
quality as:
The concept of powering and grounding electronic equipment in a manner that is suitable to the
operation of that equipment and compatible with the premise wiring system and other connected
equipment.
The increased use of power electronic devices at all levels of energy consumption has forced the issue
of power quality out of abstract discussions of definitions down to the user level. For example, a voltage
sag of only a few cycles could cause the variable frequency drives or programmable logic controllers
(PLC) on a large rolling mill to “trip out” on low voltage, thereby causing lost production and costing
the company money. The question that is of concern to everyone is, “What initiated the voltage sag?” It
could have been a fault internal to the facility or one external to the facility (either within a neighboring
facility or on the utility system). In the latter two cases, the owner of the rolling mill will place blame
on the utility and, in some cases, seek recompense for lost product.
Another example is the semiconductor industry. This segment of industry has been increasingly active
in the investigation of power quality issues, for it is in this volatile industry that millions of dollars can
possibly be lost due to a simple voltage fluctuation that may only last two to four cycles. Issues of power
quality have become such a concern in this industry that Semiconductor Equipment and Materials
International (SEMI), the worldwide trade association for the semiconductor industry, has been working
to produce power quality standards explicitly related to the manufacturing of equipment used within
that industry.
Two excellent references on the definitions, causes, and potential corrections of power quality issues
are Refs. 1 and 2. The purpose of this section, however, is to address some of the main concerns regarding
the power quality related to interfacing with a utility. These issues are most directly addressed in IEEE
519-1992 [3] and IEEE/ANSI C62.41 [4].
Harmonics and IEEE 519
Harmonic generation is attributed to the application of nonlinear loads (i.e., loads that when supplied
a sinusoidal voltage do not draw a sinusoidal current). These nonlinear loads not only have the potential
to create problems within the facility that contains the nonlinear loads but also can (depending on the
stiffness of the utility system supplying energy to the facility) adversely affect neighboring facilities. IEEE
519-1992 [3] specifically addresses the issues of steady-state limits on harmonics as seen at the
point of
common coupling
(PCC). It should be noted that this standard is currently under revision and more
information on available drafts can be found at .
The whole of IEEE 519 can essentially be summarized in several of its own tables. Namely, Tables 10.3
through 10.5 in Ref. 3 summarize the allowable harmonic current distortion for systems of 120 V to 69 kV,
69.001 kV to 161 kV, and greater than 161 kV, respectively. The allowable current distortion (defined in
terms of the total harmonic distortion, THD) is a function of the stiffness of the system at the PCC,
where the stiffness of the system at the PCC is defined by the ratio of the maximum short-circuit current
at the PCC to the maximum demand load current (at fundamental frequency) at the PCC. Table 11.1
in Ref. 3 provides recommended harmonic voltage limits (again in terms of THD). Tables 10.3 and 11.1
are of primary interest to most facilities in the application of IEEE 519. The total harmonic distortion
(for either voltage or current) is defined as the ratio of the rms of the harmonic content to the rms value
of the fundamental quantity expressed in percent of the fundamental quantity. In general, IEEE 519 refers
to this as the distortion factor (DF) and calculates it as the ratio of the square root of the sum of the
squares of the rms amplitudes of all harmonics divided by the rms amplitude of the fundamental all
times 100%. The PCC is, essentially, the point at which the utility ceases ownership of the equipment
and the facility begins electrical maintenance (e.g., the secondary of a service entrance transformer for
a small industrial customer or the meter base for a residential customer).
© 2002 by CRC Press LLC
Surge Voltages and C62.41
Reference 4 is a
guide
(lowest level of standard) for characterizing the ability of equipment on low-voltage
systems (
<
1000 V) to withstand voltage surges. This guide provides some practical basis for selecting
appropriate test waveforms on equipment. The primary application is for residential, commercial, and
industrial systems that are subject to lightning strikes because of their close proximity (electrically speaking)
to unshielded overhead distribution lines. Certain network switching operations may also result in similar
voltage transients being experienced.
Other Standards Addressing Utility Interface Issues
Many power quality standards are at present in existence and are under constant revision. The following
standards either directly or indirectly address issues with the utility interface and can be applied accord-
ingly: IEEE 1159 for the monitoring of power quality events, IEEE 1159.3 for the exchange of measured
power quality data, IEEE P1433 for power quality definitions, IEEE P1531 for guidelines regarding
harmonic filter design, IEEE P1564 for the development of sag indices, IEEE 493 (the
Gold Book
) for
industrial and commercial power system reliability, IEEE 1346 for guidelines in evaluating component
compatibility with power systems (this guideline is an attempt to better quantify the CBEMA and ITIC
curves), C84.1 for voltage ratings of power systems and equipment, IEEE 446 (the
Orange Book
) for
emergency and standby power systems (this standard contains the so-called power acceptability curves),
IEEE 1100 (the
Emerald Book
), IEEE 1409 for development of guidelines for the application of power
electronic devices/technologies for power quality improvement on distribution systems, and IEEE P1547
for the power quality issues associated with distributed generation resources.
As previously mentioned, the IEEE is not the only organization to continue investigation into the
impacts of nonlinear loads on the utility system. Other organizations such as CIGRE, UL, NEMA, SEMI,
IEC, and others all play a role in these investigations.
References
1. IEEE Standards Board,
IEEE Recommended Practice for Powering and Grounding Electronic Equipment,
IEEE Std. 1100-1999.
2. R. C. Dugan, M. F. McGranaghan, and H. W. Beaty,
Electrical Power Systems Quality,
McGraw-Hill,
New York, 1996.
3. IEEE Standards Board,
IEEE Recommended Practices and Requirements for Harmonic Control in Elec-
trical Power Systems,
IEEE Std. 519-1992.
4. IEEE Standards Board,
IEEE Recommended Practice on Surge Voltages in Low-Voltage AC Power Circuits,
IEEE Std. C62.41-1991.
17.2 Power Quality Considerations
Timothy L. Skvarenina
Harmonics
In the past, utilities had the responsibility to provide a single-frequency voltage waveform, and for the
most part, customers’ loads had little effect on the voltage waveform. Now, however, power electronics
are used widely and create nonsinusoidal currents that contain many harmonic components. Harmonic
currents cause problems in the power system and for other loads connected to the same portion of the
power system. Because utility customers can now cause electrical problems for themselves and others,
the Institute of Electrical and Electronic Engineers (IEEE) developed IEEE Standard 519, which places
the responsibility of controlling harmonics on the user as well as the utility. This section describes harmonics,
their cause, and their effects on the system voltage and components.
© 2002 by CRC Press LLC
What Are Harmonics?
Ideally, the waveforms of all the voltages and currents in the power system would be single-frequency
(60 Hz in North America) sine waves. The actual voltages and currents in the power system, however, are
not purely sinusoidal, although in the steady state they do look the same from cycle to cycle; i.e.,
f
(
t
+
T
)
=
f
(
t
), where
T
is the period of the waveform and
t
is any value of time. Such repeating functions can be
viewed as a series of components, called harmonics, whose frequencies are integral multiples of the power
system frequency. The second harmonic for a 60-Hz system is 120 Hz, the third harmonic is 180 Hz, etc.
Typically, only odd harmonics are present in the power system.
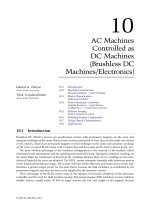
Figure 17.1 shows one cycle of a sinusoid (labeled as the fundamental) with a peak value of 100. The
fundamental is also know as the first harmonic, which would be the nominal frequency of the power
system. Two other waveforms are shown on the figure—the third harmonic with a peak of 50 and the
fifth harmonic with a peak of 20. Notice that the third harmonic completes three cycles during the one
cycle of the fundamental and thus has a frequency three times that of the fundamental. Similarly, the fifth
harmonic completes five cycles during one cycle of the fundamental and thus has a frequency five times
that of the fundamental. Each of the harmonics shown in Fig. 17.1 can be expressed as a function of time:
(17.1)
Equation 17.1 shows three harmonic components of voltage or current that could be added together
in an infinite number of ways by varying the phase angles of the three components. Thus, an infinite
number of waveforms could be produced from these three harmonic components. For example, suppose
V
3
is shifted in time by 60
°
and then added to
V
1
and
V
5
. In this case, all three waveforms have a positive
peak at 90
°
and a negative peak at 270
°
. One half cycle of the resultant waveform is shown in Fig. 17.2,
which is clearly beginning to look like a pulse. In this case, we have used the harmonic components to
synthesize a waveform. Generally, we would have a nonsinusoidal voltage or current waveform and would
like to know its harmonic content. The question, then, is how to find the harmonic components given
a waveform that repeats itself every cycle.
Fourier, the mathematician, showed that it is possible to represent any periodic waveform by a series
of harmonic components. Thus, any periodic current or voltage in the power system can be represented
by a Fourier series. Furthermore, he showed that the series can be found, assuming the waveform can
be expressed as a mathematical function. We will not go into the mathematics behind the solution of
Fourier series here; however, we can use the results. In particular, if a waveform
f
(
t
) is periodic, with
period
T
, then it can be approximated as
(17.2)
FIGURE 17.1
Fundamental, third, and fifth harmonics.
-50
50
100
-100
Fundamental
Third
Fifth
Degrees
Magnitude
0
0 90 180 270 360
V
1
100 wt(), V
3
sin 50 3wt(), V
5
sin 20 5wt()sin===
ft() a
0
a
1
wt q
1
+()a
2
2wt q
2
+()a
3
3wt q
3
+()
…
a
n
nwt q
n
+()sin++sin+sin+sin+=
© 2002 by CRC Press LLC
where
a
0
represents any DC (average) value of the waveform,
a
1
through
a
n
are the Fourier amplitude
coefficients, and
θ
1
through
θ
n
are the Fourier phase coefficients. The amplitude coefficients are always
zero or positive and the phase coefficients are all between 0 and 2
π
radians. As “
n
” gets larger, the
approximation becomes more accurate.
For example, consider an alternating square wave of amplitude 100. The Fourier series can be shown
to be
(17.3)
Since the alternating waveform has zero average value, the coefficient
a
0
is zero. Note also that only odd
harmonics are included in the series given by Eq. (17.3), since (2
n
−
1) will always be an odd number,
and all of the phase coefficients are zero. Expanding the first five terms of Eq. (17.3) yields:
(17.4)
Figure 17.3 shows one cycle for the waveform represented by the right-hand side of Eq. (17.3). Although
only the first five terms of the Fourier series were used in Fig. 17.3, the resultant waveform already
resembles a square wave. Harmonics have a number of effects on the power system as will be seen later,
but for now we would like to have some way to indicate how large the harmonic content of a waveform
is. One such figure of merit is the total harmonic distortion (THD).
Total harmonic distortion can be defined two ways. The first definition, in Eq. (17.5), shows the THD
as a percentage of the fundamental component of the waveform, designated as THD
F
. This is the IEEE
definition of THD and is used widely in the United States.
(17.5)
In Eq. (17.5),
V
1rms
is the rms of the fundamental component and
V
h
rms
is the amplitude of the harmonic
component of order “
h
” (i.e., the “
h
th” harmonic) . Although the symbol “
V
” is used in Eqs. (17.5) to
(17.10), the equations apply to either current or voltage. The rms of a waveform composed of harmonics
FIGURE 17.2
Pulse wave formed from the three harmonics in Eq. 17.1 with 60
°
shift for
V
3
.
Degrees
300 60 90 120 150 180
0
40
80
120
160
Magnitude
V
square
100
1
2n 1–
---------------
2n 1–()wt[]sin
n=1
∞
∑
=
V
square
100 wt()
1
3
--
3wt()
1
5
--
5wt()
1
7
--
7wt()
1
9
--
9wt()sin+sin+sin+sin+sin=
THD
F
V
hrms
2
h=2
∞
∑
V
1rms
-----------------------
100%×=
© 2002 by CRC Press LLC
is independent of the phase angles of the Fourier series, and can be calculated from the rms values of all
harmonics, including the fundamental:
(17.6)
Because the series in Eq. (17.6) has only one more term (the rms of the fundamental) than the series
in the numerator of Eq. (17.5), we can also find the total rms in terms of percent THD
F
.
(17.7)
In the opinion of some, Eq. (17.5) exaggerates the harmonic problem. Thus, another technique is also
used to calculate THD. The alternate method, designated as THD
R
, calculates THD as a percentage of
the total rms instead of the rms of the fundamental. From Eq. (17.7), it is clear that the total rms will
be larger than the rms of the fundamental, so such a calculation will yield a lower value for THD. This
definition is used by the Canadian Standards Association and the IEC:
(17.8)
The value for THD
R
can be obtained from THD
F
by multiplying by
V
1rms
and dividing by
V
rms
.
(17.9)
Substituting Eq. (17.7) into Eq. (17.9) yields another expression for THD
R
in terms of THD
F
:
(17.10)
THD
R
, as given by Eq. (17.8) and (17.10), will always be less than 100%. THD is very important
because the IEEE Standard 519 specifies maximum values of THD for the utility voltage and the
FIGURE 17.3 Approximation to a square wave using the first five terms of the Fourier series.
Degrees
0
90 270180
0
-100
100
Magnitude
360
V
rms
V
hrms
2
h=1
∞
∑
=
V
rms
V
1rms
1
%THD
F
100
-------------------
2
+=
THD
R
V
hrms
2
h=2
∞
∑
V
rms
-----------------------
100%×=
THD
R
THD
F
I
1rms
I
rms
----------
×=
THD
R
THD
F
1
%THD
F
100
--------------------
2
+
-----------------------------------------
=
© 2002 by CRC Press LLC
customer’s current. Having considered what harmonics are, we can now look at some of their properties.
The next section deals with the phase sequence of various harmonics.
Harmonic Sequence
In a three-phase system, the rotation of the phasors is assumed to have an A-B-C sequence as shown in
Fig. 17.4a. As the phasors rotate, phase A passes the x-axis, followed by phase B and then phase C. An
A-B-C sequence is called the positive sequence. However, phase A could be followed by phase C and then
phase B, as shown in Fig. 17.4b. A set of phasors whose sequence is reversed is called the negative sequence.
Finally, if the waveforms in all three phases were identical, their phasors would be in line with each other
as shown in Fig. 17.4c. Because there are no phase angles between the three phases, this set of phasors
is call the zero sequence.
When negative and zero sequence currents and voltages are present along with the positive sequence,
they can have serious effects on power equipment. Not all harmonics have the same sequence; in fact, the
sequence depends on the number of the harmonic, as shown in Fig. 17.5. Figure 17.5a, b, and c show
the fundamental component of a three-phase set of waveforms (voltage or current) as well as their second
harmonics. In each case, the phase-angle relationship has been chosen so both the fundamental and the
second harmonic cross through zero in the ascending direction at the same time.
FIGURE 17.4 Positive (a), negative (b), and zero (c) sequences.
FIGURE 17.5 First, second, and third harmonics.
V
AN
V
BN
V
CN
V = V = V
AN BN C N
(a) (b) (c)
V
AN
V
BN
V
CN
(a )
(d)
(b) (e )
(c)
(f)
A1
B1
C1
a2
b2
c2
a3
b3
c3
2nd ha rmon ic
fund a m e nta l
3rd harmonic
© 2002 by CRC Press LLC
To establish the sequence of the fundamental components, label the positive peak values of the three phases
A1, B1, and C1. Clearly, A1 occurs first, then B1, and finally C1. Thus, we can conclude that the fundamental
component has an A-B-C, or positive, sequence. In fact, it was chosen to have a positive sequence. Given
that the fundamental has a positive sequence, we can now look at other harmonics. In a similar manner, the
first peak of each of the second harmonics are labeled a2, b2, and c2. In this case, a2 occurs first, but it is
followed by c2 and then b2. The second harmonic thus has an A-C-B, or negative, sequence.
Now consider Fig. 17.5d, e, and f, which also show the same fundamental components, but instead
of the second harmonic, the third harmonic is shown. Both the fundamental and third harmonics were
chosen so they cross through zvoero together. When the peaks of the third harmonics are labeled as a3,
b3, and c3, it is evident that all three occur at the same time. Since the third harmonics are concurrent,
they have no phase order. Thus, they are said to have zero sequence. If the process in Fig. 17.5 was
continued, the fourth harmonic would have a positive sequence, the fifth a negative sequence, the sixth
a zero sequence, and so on.
All harmonics whose order is 3n, where n is any positive integer, are zero sequence and are called
triplen harmonics. Triplen harmonics cause serious problems in three-phase systems as discussed later
in this section. First, however, consider what causes harmonics in the power system.
Where Do Harmonics Come From?
Electrical loads that have a nonlinear relationship between the applied voltages and their currents cause
harmonic currents in the power system. Passive electric loads consisting of resistors, inductors, and
capacitors are linear loads. If the voltage applied to them consists of a single-frequency sine wave, then
the current through them will be a single-frequency sine wave as well. Power electronic equipment creates
harmonic currents because of the switching elements that are inherent in their operation. For example,
consider a simple switched-mode power supply used to provide DC power to devices such as desktop
computers, televisions, and other single-phase electronic devices.
Figure 17.6 shows an elementary power supply in which a capacitor is fed from the power system
through a full-wave, diode bridge rectifier. The instantaneous value of the AC source must be greater
than the voltage across the capacitor for the diodes to conduct. When first energized, the capacitor charges
to the peak of the AC waveform and, in the absence of a load, the capacitor remains charged and no
further current is drawn from the source.
If there is a load, then the capacitor acts as a source for the load. After the capacitor is fully charged, the
AC voltage waveform starts to decrease, and the diodes shut off. While the diode is off, the capacitor
discharges current to the DC load, which causes its voltage, V
dc
, to decrease. Thus, when the AC source
becomes larger than V
dc
during the next half-cycle, the capacitor draws a pulse of current to restore its charge.
FIGURE 17.6 Simple single-phase switch-mode power supply.
V
DC
I
S
V
S
C
© 2002 by CRC Press LLC
Figure 17.7 shows the current of such a load (actually the input current to a variable-speed motor drive).
Since the current has a repetitive waveform, it is composed of a series of harmonics. The harmonics can
be found using a variety of test equipment with the capability to process a fast Fourier transform (FFT).
This particular waveform has a large amount of harmonics, as shown by the harmonic spectrum (through
the 31st harmonic) in Fig. 17.8. Note that the first several harmonics after the fundamental are almost
as large as the fundamental. This waveform, as shown in Fig. 17.7, has a peak value of 4.25 A, but the
rms of the waveform is only 1.03 A. This leads to another quantity that is an indicator of harmonic
distortion. The crest factor (CF) is defined as the ratio of the peak value of the waveform divided by the
rms value of the waveform:
(17.11)
For the current shown in Fig. 17.7, the crest factor is 4.25 divided by 1.03, or 4.12. For a sinusoidal
current or voltage, the crest factor would be the square root of 2 (1.414). Waveforms whose crest factor
are substantially different from 1.414 will have harmonic content. Note that the crest factor can also be
lower than 1.414. A square wave, for example, would have a CF of 1.
As shown in Fig. 17.8, the third harmonic of a single-phase bridge rectifier is very large. Putting such
loads on the three phases of a three-phase, wye-connected system could cause problems because the third
harmonics add on the neutral conductor. The best way to handle these problems is to eliminate the
triplen harmonics.
Whereas single-phase rectifiers require a large amount of triplen current, three-phase bridge rectifiers
do not. Figure 17.9 shows the input current and harmonic content for a three-phase bridge rectifier
(again, the input current to a variable-frequency motor drive). In this case, the phase current contains two
pulses in each half-cycle, which results in the elimination of all the triplen harmonics. Examination of
FIGURE 17.7 Input current to single-phase, full-wave rectifier.
FIGURE 17.8 Harmonic spectrum of current for the circuit shown in Fig. 17.6.
5.0
0
-5.0
Amps
Time (msec)
4.17 8.34
12.51 16.67
Harmonic number
Amps - rms
1
35
7
9
11
13 15
17
19
21
23 25
27
29 31
0
1
2
3
4
5
CF
peak of waveform
rms of waveform
------------------------------------------
=
© 2002 by CRC Press LLC
the spectrum in Fig. 17.9 shows that the only harmonics that remain are those whose order numbers are
of the form:
(17.12)
where n is any positive integer, beginning with 1. Setting n = 1, indicates the 5th and 7th harmonics will
be present, n = 2 yields the 11th and 13th harmonics, and so on.
Harmonic currents have many impacts on the power system, both on the components of the system
as well as the voltage. The next section considers some of these effects.
Effects of Harmonics on the System Voltage
A simple circuit representing a single-phase power system is shown in Fig. 17.10. In North America, the
utility generates a 60-Hz sinusoidal voltage, indicated by the ideal source. However, the load current
flows through transmission lines, transformers, and distribution feeders, which all have impedance. The
impedance of the system is represented in Fig. 17.10 by Z
s
. Finally, the load for this system is considered
to be a nonlinear load in parallel with other loads.
Harmonic currents drawn from the power system by nonlinear loads create harmonic voltages (RI +
j
ω
h
LI) across the system impedance, and their effect can be significant for higher-order harmonics
because inductive reactance increases with frequency. The load voltage is the difference between the
source voltage and the voltage drop across the system impedance. Since the voltage drop across the system
impedance contains harmonic components, the load voltage may become distorted if the nonlinear loads
are a large fraction of the system capacity.
Referring back to Fig. 17.6, note the current pulse drawn by the rectifier occurs only when the AC
source voltage is near its peak. This means the voltage drop across the source impedance will be large when
FIGURE 17.9 Line current and harmonic content for three-phase bridge rectifier.
FIGURE 17.10 Simple single-phase power system.
Harmonic number
1
35
7
9
11
13 15
17
19
21
23 25
27
29 31
Amps - rms
0
0.4
Amps
0
2.5
-2.5
Time - msec
8.33
16.67
(a)
(b)
Other
parallel
loads
Nonlinear
load
Z
s
V
s
V
a
c
h 6n 1±=
© 2002 by CRC Press LLC
the source voltage is near its peak and essentially zero during the remainder of the half-cycle. Thus, the
voltage delivered to the load will be “flattened” by the subtraction of the system impedance voltage drop.
Unfortunately, some power electronic devices, such as the rectifier front-end of motor drives, are sensitive
to the peak value of the AC voltage waveform, and may shut down or operate incorrectly when the
incoming AC voltage is distorted. Voltage distortion affects the nonlinear load that created the harmonics
and any other load that is connected in parallel with it. The interface between the loads and the power
system is called the point of common coupling (PCC), and the PCC is where the harmonic content of
system voltage and current must be controlled to comply with IEEE Standard 519. Although three-phase
rectifiers do not cause triplen harmonic currents, they do cause another problem as a result of their
operation.
Notching
A three-phase bridge rectifier is shown in Fig. 17.11, the details of which are described in Chapter 4 of this
handbook. However, consider briefly how the diodes operate. Each diode in the top or bottom half conducts
while one or two diodes in the oppositie half conduct. For example, diode 1 is connected to phase A and
conducts during the period of time when diode 6 (phase B) and diode 2 (phase C) are conducting. Clearly,
diode 1 should not conduct when diode 4 is conducting as that would constitute a short circuit. The
inductor in series with the DC load tends to keep the current constant, so current must be passed from
one diode to another. This transfer of the load current from one diode to another is called commutation.
While diode 1 is conducting in the upper half of the bridge, the current in the lower half of the bridge
will commutate from diode 6 to diode 2. Since the three-phase source has inductance as well, this transfer
of current cannot occur instantaneously. Instead, the current in diode 2 must increase while the current
in diode 6 decreases.
While it is conducting, a diode is essentially a short circuit, so during the commutation interval, two
diodes in one side of the bridge are conducting. This results in two phases of the source being shorted
together. For example, while the load current commutates from diode 6 to diode 2, points B and C are
connected together, which means the voltage from B to ground and from C to ground is the same. The
effect of commutation is to create a notch in the voltage waveform. Figure 17.12 shows the voltage from
A to ground as calculated by a simulation of a three-phase bridge rectifier. The notching effect is evident,
six times per cycle.
Notching is a repetitive event and the voltage waveform shown in Fig. 17.12 could be represented by
a Fourier series. However, the order of the harmonics is extremely high, well above the range of many
monitors normally used for making power quality measurements. Thus, notching is a special case
somewhere between harmonics and transients. Devices connected in parallel with the bridge rectifier
could be affected by notching, especially if the rectifier load is large relative to the size of the system from
which it is fed.
FIGURE 17.11 Three-phase bridge rectifier.
A
35
462
V
DC
I
AS
B
C
1
L
© 2002 by CRC Press LLC
An isolation transformer can be used to supply the offending equipment and thus reduce the amount
of notching seen by other loads. Figure 17.13 shows a rectifier load and other loads fed from a common
bus with an isolation transformer between the rectifier load and the bus. The voltage on the secondary
of the transformer is notched; however, the voltage on the primary side is relatively unaffected because
the impedance of the isolation transformer tends to smooth out the notches. Thus, the other loads do
not see the notching or at least see much smaller notches in the voltage waveform.
Effects of Harmonics on Power System Components
Harmonic currents from nonlinear loads can seriously affect electric power distribution equipment.
Components that may be affected include transformers, conductors, circuit breakers, bus bars and
connecting lugs, and electrical panels. Harmonic problems can occur in both single-phase and three-
phase systems.
Conductors
Higher-order harmonic current components cause additional I
2
R heating in every conductor through
which they flow, because conductor resistance increases with frequency as a result of the skin effect. This
means that as the frequency of a current increases, its ability to “soak” into a conductor is reduced,
resulting in a higher current density at the edge of the conductor than at its center. A conductor can be
carrying rated current (rms amps) and still overheat if the current contains significant higher-order
harmonics. Because every conductor carrying the harmonic currents will have increased losses, there will
be more heat to be dissipated in the system and the overall efficiency of the system will be reduced.
FIGURE 17.12 Voltage notching of the AC source voltage due to commutation of diodes in a three-phase rectifier.
FIGURE 17.13 Use of an isolation transformer to keep notching from affecting other loads.
V
ag
200
0
-200
0
0.02
0.04
0.06 0.08 0.10
Load
Rectifier
Other
loads
Isolation
transformer
Bus
© 2002 by CRC Press LLC
Three-Phase Neutral Conductors
Triplen harmonics pose a problem for the neutral conductor in three-phase, wye-connected systems,
such as the one shown in Fig. 17.14. Therein, a feeder circuit provides three-phase power to a circuit
breaker panel board from which branch circuits provide power to outlets and lighting, including three
single-phase loads connected via a four-wire branch circuit. When identical linear loads are placed on
each of the three phases, the phase currents add to zero at point “n” and no current flows on the neutral
wire. Again assuming linear loads, then even if the load are not identical, the current in the neutral could
not be higher than the highest phase current.
If the loads in Fig. 17.14 are nonlinear, there will be harmonic currents in each phase. For balanced
loads, the fundamentals and all non-triplen harmonic currents add to zero at the neutral point. If triplen
harmonics are present in the phase currents, however, they will be in phase and add directly on the
branch circuit and feeder neutrals. Since the neutral conductors carry the sum of the triplens from the
three phases, the neutral current can actually exceed the current in the phase conductors. Since neutral
conductors are not protected by circuit breakers, this can damage to the conductors.
To find the current in the neutral, we must recognize that all positive and negative sequence harmonics
from the three phases will cancel out at the neutral point. The triplen harmonics, on the other hand,
will add together at the neutral:
(17.13)
From Eq. (17.13), it is evident that the neutral current is three times the rms of all the triplens on one
phase of the system.
Transformers
Current flow in the windings and flux in the ferromagnetic core cause real power losses in a transformer.
Because of their higher frequencies, harmonic currents cause additional losses in every conductor through
which they flow, including the conductors of the transformer coils. Harmonic currents in the windings
create harmonic flux components in the core of the transformer, which cause additional hysteresis and
eddy current losses in the steel. Hysteresis loss is proportional to the frequency of the magnetic flux, and
eddy currents are proportional to frequency squared. Thus, harmonic currents can cause significant incre-
ases in the core loss of the transformer. These additional losses may result in transformer overheating
and electrical insulation failure.
To provide for the effects of nonlinear loads, manufacturers build specially designed transformers,
called “K-factor rated,” that are capable of supplying rated output current to loads with a specific level
FIGURE 17.14 Three-phase power system with balanced, single-phase nonlinear loads.
Nonlinear
Load
I
a
I
b
I
c
I
n
n
Three-phase
Power Panel
208Y/120 V
{
4 wire
feeder
circuit to
panel
Nonlinear
Load
Nonlinear
Load
I
Nrms
3 I
3rms
2
I
6rms
2
I
9rms
2
…
+++()
1/2
×=
© 2002 by CRC Press LLC
of harmonic content. K-factor-rated transformers have larger conductors in the windings and thinner,
low-loss steel laminations in the core to reduce the losses. A transformer with a K-factor of K-1 is rated
only for single-frequency current; thus, if the load is nonlinear, the transformer cannot provide rated
current without overheating. Transformers rated K-4, K-9, K-13, and higher are available to provide
power to nonlinear loads. K-factors of K-4 or K-9 indicate the transformer can supply rated current to
loads that would increase the eddy current loss of a K-1 transformer by a factor of 4 or 9, respectively.
Transformers rated K-9 or K-13 would likely be required for office areas containing many desktop
computers, copy machines, fax machines, and electronic lighting ballasts. A large variable-speed motor
drive could require a transformer rated K-30 or higher. The K-factor of a load can be calculated, if the
harmonic components are known, as follows:
(17.14)
where h is the harmonic order number, I
h,rms
is the rms of the harmonic current whose frequency is “h”
times the fundamental frequency, and I
tot,rms
is the rms of the total current.
Effects of Harmonics on System Power Factor
Earlier, Eq. (17.6) showed that the addition of harmonic currents to the fundamental component increases
the total rms current. Because they affect the rms value of the current, harmonics will affect the power
factor of the circuit. Consider the voltage and current waveforms shown in Fig. 17.15 in which current
lags the voltage by an angle
θ
. The apparent power of the circuit would be found by multiplying the rms
voltage magnitude by the rms current magnitude. Power factor, F
p
, is then defined as the ratio of the real
power to the apparent power:
(17.15)
For linear loads, the phase shift (time displacement) between voltage and current results in different
values for real power and apparent power. Since the current can only lag or lead the voltage by 0 to 90°,
the power factor will always be positive and less than or equal to 1.
Instead of a sinusoidal current, suppose the current and voltage shown by Fig. 17.16. The current is
the quasi-square wave, consisting of the Fourier series shown in Eq. (17.4). The voltage is a sine wave,
FIGURE 17.15 Voltage and current for a lagging load.
Kh
2
I
h,rms
I
tot,rms
-------------
2
∑
=
F
p
P
V
rms
I
rms
------------------
q()cos==
Voltage and current
Degrees (time)
θ
V(t)
I(t)
0 90 180 270 360
1
0
-1
© 2002 by CRC Press LLC
which is in phase with the fundamental harmonic component of the current. The power can be found
as a function of time by multiplying the voltage times the current at each time step.
Because the voltage consists of a single component, the power is a series of terms consisting of the
voltage times each harmonic component of current. The first term of the series is of the form sin
2
ω
t
since the voltage is in phase with the fundamental current component. Obviously, this term is always
positive; therefore, it indicates real power (energy) being delivered to the load.
The remaining terms contain the product of the fundamental frequency voltage and one of the higher-
order harmonic current components. Multiplying two sinusoidal waveforms of different frequencies
creates a sinusoidal waveform, which has a zero average value. Thus, none of higher-order harmonic currents
produces real power if the voltage is a single frequency. Substituting Eq. (17.7) for the total rms current
into Eq. (17.15) yields a new expression for the power factor:
(17.16)
where the current %THD
F
is used in the denominator of Eq. (17.16). Rewriting Eq. (17.16):
(17.17)
In Eqs. (17.16) and (17.17), the subscript “tot” indicates the total power factor, which is sometimes called
the true power factor. The total power factor in Eq. (17.17) is the product of two components, the first
of which is called the displacement power factor:
(17.18)
The second component of the total power factor is the distortion power factor, which results from the
harmonic components in the current:
(17.19)
FIGURE 17.16 Sinusoidal voltage and quasi-square wave current.
V(t)
I(t)
Relative magnitude
Degrees (time)
0 180 36090 270
1
0
-1
0.5
-0.5
F
p tot
P
V
1rms
I
rms
--------------------
P
V
1rms
I
1
rms
1
%THD
F
100
-------------------
2
+
---------------------------------------------------------------
==
F
p tot
P
V
1rms
I
1
rms
----------------------
1
1
%THD
F
100
-------------------
2
+
-----------------------------------------
×=
F
pdisp
P
V
1rms
I
1
rms
----------------------
=
F
p disp
1
1
%THD
F
100
-------------------
2
+
-----------------------------------------
=
© 2002 by CRC Press LLC
In the event that the voltage also has harmonic components, then the distortion power factor would
be the product of two terms similar to the right side of Eq. (17.19), one for the voltage and one for the
current. However, voltage distortion is normally very low compared with the current distortion.
Power electronic devices can cause unusual results with respect to power factor. The circuit shown in
Fig. 17.17 consists of an incandescent lamp fed by a simple wall-mounted dimmer. Incandescent lamps
operate at essentially unity power. In this case, the lamp voltage was set at 85 V rms by adjusting the
dimmer switch. The voltage was observed at the source and at the lamp and the circuit current was
measured, all with a harmonics analyzer.
The results are shown in Fig. 17.18, where the top waveform is the source voltage, with a 60-Hz
component of 118 V and a 5th harmonic (300-Hz) component of 1.6 V. The second trace shows the
lamp voltage, i.e, the dimmer output. At this voltage setting, the dimmer was conducting for approxi-
mately one half (90°) of each half-cycle, as shown. The bottom waveform shows the lamp current. Because
the incandescent lamp is essentially a resistive load, the current waveform looks identical to the lamp
voltage, except for the scale. The bar chart in Fig. 17.18 shows the harmonic spectrum of the current,
which, except for the scale, was identical to the voltage spectrum.
FIGURE 17.17 Simple incandescent lamp dimmer circuit.
FIGURE 17.18 Source voltage, lamp voltage, lamp current, and current harmonic spectrum for the system shown
in Fig. 17.17.
120 V,
60 Hz
Incandescent
Lamp
Dimmer
Switch
Current
Time - msec
0.0
5.0
-5.0
.
8.33
16.67
Dimmer Voltage
0
200
-200
.
8.33
16.67
Source Voltage
0
200
-200
.
8.33
16.67
Harmonic number
0.0
0.5
1.0
1.5
1 3 5 7 9 11 13 15 17 19 21 23 25 27 29 31
Current Harmonics
VoltsAmps Volts
© 2002 by CRC Press LLC
Since the lamp voltage and current have the same shape and are in phase, the harmonic components of
current and voltage are in phase. With no phase angle between each of the voltage and current components,
the power factor of the lamp is unity, and that was found to be the case with the harmonic analyzer.
Because the dimmer creates harmonic voltages to the lamp, each harmonic of voltage and its respective
current delivers some power to the lamp at unity power factor.
Looking at the source results in a much different picture. The source voltage consists almost solely
of a single frequency, whereas the current contains all of the harmonics shown in Fig. 17.18. Since the
product of two sine waves of different frequencies is another sine wave, only the fundamental harmonic
of current can deliver real power to the circuit. The harmonics analyzer showed that the fundamental
component of the current lagged the source voltage by 28°. Taking the cosine of 28° results in a measured
displacement power factor of 0.88 at the source.
THD
F
for the current was found to be 60.7%, and the distortion power factor was calculated to be
0.855 from Eq. (17.19). The product of the distortion power factor and the displacement power factor
yields the total power factor, 0.75 in this case. Thus, the incandescent lamp, a resistive load, appears to
the power system as a 0.75 power factor lagging load. Low power factor results in higher losses in the
system due to higher I
2
R losses. In fact, both I and R increase in this case because the rms current is
higher due to the harmonics and because skin effect causes higher resistance in the conductors. While a
single lamp on a dimmer switch does not seriously affect the power system, very large nonlinear loads,
such as a DC motor drive, could require the installation of harmonic filters to reduce the distortion
power factor. Passive harmonic filters are briefly described here and in more detail in Section 17.3.
Power Factor Correction Capacitors
Many industrial loads are inductive, so capacitors are often used to improve the power factor. Although
capacitors do not cause harmonics, they can resonate with the inductance of the power system. When
resonant frequencies occur near harmonic frequencies, capacitors can amplify the harmonic currents
created by nonlinear loads. Figure 17.19 shows a power circuit including power factor correction capac-
itors. The parallel combination of the system inductance and the power factor correction capacitors has
a resonant frequency, f
r
. The resonant frequency is given by
(17.20)
where L is the system inductance (X
s
divided by 2
π
), and C is the capacitance.
Normally, we do not deal with inductance and capacitance, however. It is much more convenient to
express the resonant frequency in other terms. In particular, we normally size power factor capacitors in
kVAR. Figure 17.19 also shows a switch that can be closed to create a short circuit. If the switch is closed
to short out the loads, the source voltage will be dropped across the system impedance, which in this
FIGURE 17.19 Circuit demonstrating how resonance can form with power factor correction.
f
r
1
LC
-----------
=
Loads
X
s
V
Nonlinear
Power
factor
correction
capacitor
Short
Circuit
s
Switch
© 2002 by CRC Press LLC
case is considered to be inductive. Thus, the short-circuit kVA can be calculated as
(17.21)
The utility normally provides the available short-circuit capacity upon request. Neglecting the voltage
drop across X
s
during normal operation, the total kVAR of the capacitance would be
(17.22)
Since X
s
= 2
π
fL and X
cap
= 1/(2
π
fC), it can be shown from Eqs. (17.20) through (17.22) that
(17.23)
where h
r
is the multiple of the system frequency at which the resonance occurs.
For example, if h
r
is five, the resonant frequency is 300 Hz for a 60-Hz power system. Unfortunately,
it is not uncommon for the value calculated by Eq. (17.23) to be near the 5th harmonic, which, as we
have seen in Fig. 17.9, is the dominant harmonic for some three-phase bridge rectifiers. When the
capacitors cause a resonance near one of the harmonics, the original harmonic current can be amplified
by as much as a factor of 16, which can in turn cause excessive voltage drop and voltage distortion,
damage to the capacitors, and lower power factor.
When harmonics cause serious voltage distortion, tuned filters can be used to reduce the amount of
harmonic current drawn from the source. Figure 17.20 shows a circuit with two filters, each designed to
reduce the effects of one particular harmonic. The inductance added in series with the capacitor should
be chosen to create a series resonance frequency that is slightly below the frequency of the harmonic that
is to be reduced. For example, if it was desired to reduce the 5th and 7th harmonics, then the filters
would be designed to have resonance frequencies about 4.7 and 6.7 times the normal system frequency.
This allows for tolerances in the actual values of the devices and causes the majority of the 5th and 7th
harmonic currents to be diverted through the filters. A small portion of the harmonic current is still
supplied by the source.
IEEE Standard 519
Recognizing the problems caused by nonlinear loads, the IEEE Standards board approved a revised and
renamed Standard 519 in the fall of 1992. The 1981 version of the standard was titled, “Guide for
Harmonic Control and Reactive Compensation of Static Power Converters.” The 1981 version recom-
mended specific limits for voltage THD from the utility, but did not recognize the possibility of customer
load currents causing voltage distortion. The 1992 version was titled, “IEEE Recommended Practices and
FIGURE 17.20 Use of harmonic filters.
Loads
Nonlinear
Power
factor
correction
capacitor/
tuned
filters
1
2
X
s
V
s
kVA
sc
V
2
X
s
-----
=
kVAR
cap
V
2
X
cap
---------
=
h
r
kVA
sc
kVAR
cap
-------------------≅
© 2002 by CRC Press LLC
Requirements for Harmonic Control in Electrical Power Systems.” The new version places the responsi-
bility for ensuring power quality on both the utility and the customer.
As indicated by the title, IEEE Standard 519 is a “recommended practice,” which means it is not a law
or rule for all utility–customer interfaces, but it may be used as a design guideline for new installations.
Utilities may also include the requirements from Standard 519 in service agreements with their customers,
which could result in financial penalties for customers that do not comply. The standard makes the
customer responsible for limiting the harmonic currents injected into the power system and the utility
responsible for avoiding unacceptable voltage distortion.
IEEE Standard 519 defines harmonic current limits (shown in Table 17.1) for individual customers at
the point of common coupling (PCC). Because voltage distortion is caused by the amount of harmonic
currents in the system, larger customers are capable of causing more voltage distortion than smaller ones.
Recognizing this, the standard allows a higher current THD for smaller customers’ loads. The short-
circuit ratio (SCR) is used to differentiate customer size.
When the load of Fig. 17.19 was shorted, the only impedance limiting the current was the system
impedance. That current is called the available short-circuit current, and is generally high since the system
impedance is much lower than the load impedance. SCR is defined as the “average maximum demand
(load) current” for the facility divided by the available short-circuit current. The maximum load current
drawn by a large customer would be a higher fraction of the available short-circuit current, so the large
customer’s SCR would be lower. The lower the SCR, the more stringent are the IEEE 519 limitations on
harmonic currents.
IEEE Standard 519 also provides limits for specific ranges of frequencies, as shown in Table 17.1.
Higher-order harmonics are constrained to have lower amplitudes for two reasons. First, higher-order
harmonics cause greater voltage distortion than lower-order harmonics, even if they have the same
amplitude, because the system inductive reactance is proportional to frequency. Second, interference with
telecommunication equipment is more severe for higher-frequency harmonics. Note that Table 17.1
applies only to odd harmonics; even harmonics are limited to 25% of the values for the ranges they
would occupy in Table 17.1.
The utility is required by Standard 519 to maintain acceptable levels of voltage distortion. Below 69 kV,
individual harmonic components in the voltage should not exceed 3% of the fundamental, and the voltage
THD must be less than 5%. Higher voltages have even lower limits, but those apply primarily to utility
interconnections.
References
Bingham, R. P., Planning and performing a power quality survey, Power Qual. Assurance, 9(3), May/June
1998.
Dugan, R. C., M. F. McGranaghan, and H. W. Beaty, Electrical Power Systems Quality, McGraw-Hill,
New York, 1996.
Grady, W. M., Harmonics and how they relate to power quality, in Proceedings of the EPRI Power Quality
and Opportunities Conference (PQA ’93), San Diego, CA, November 1993.
Guth, B., Pay me now or pay me later—power monitors and conditioners provide valuable insurance
when it comes time to install modern and expensive electrical systems and equipment, Consulting-
Specifying Eng., Vol. 3, September 1997.
TABLE 17.1 Harmonics Allowed by IEEE Standard 519
SCR h < 11 11–15 17–21 23–33 h > 33 % THD
<20 4.0 2.0 1.5 0.6 0.3 5.0
20–50 7.0 3.5 2.5 1.0 0.5 8.0
50–100 10.0 4.5 4.0 1.5 0.7 12.0
100–1000 12.0 5.5 5.0 2.0 1.0 15.0
>1000 15.0 7.0 6.0 2.5 1.4 20.0
© 2002 by CRC Press LLC
Handbook of Power Signatures, 1993, Basic Measuring Instruments, Santa Clara, CA.
IEEE Standard 519-1992, IEEE Recommended Practices and Requirements for Harmonic Control in
Electrical Power Systems.
IEEE Standard 1100-1992, IEEE Recommended Practice for Powering and Grounding of Sensitive Elec-
tronic Equipment.
IEEE Standard 1159-1995, IEEE Recommended Practice for Monitoring Electric Power Quality.
Waller, M., Managing the Computer Power Environment—A Guide to Clean Power for Electronic Systems,
1992, Prompt Publications, Indianapolis, IN.
17.3 Passive Harmonic Filters
Badrul H. Chowdhury
Currently in the United States, only 15 to 20% of the utility distribution loading consists of nonlinear
loads. Loads, such as AC and DC adjustable speed drives (ASD), power rectifiers and inverters, arc furnaces,
and discharge lighting (metal halide, fluorescent, etc.), and even saturated transformers, can be considered
nonlinear devices. It is projected over the next 10 years that such nonlinear loads will comprise approx-
imately 70 to 85% of the loading on utility distribution systems in the United States. These loads may
generate enough harmonics to cause distorted current and voltage waveshapes.
The deleterious effects of harmonics are many. A significant impact is equipment overheating because
of the presence of harmonics in addition to the fundamental. Harmonics can also create resonance
conditions with power factor correction capacitors, resulting in higher than normal currents and voltages.
This can lead to improper operation of protective devices, such as relays and fuses.
Harmonic frequency currents can cause additional rotating fields in AC motors. Depending on the
frequency, the motor will rotate in the opposite direction (countertorque). In particular, the 5th harmonic,
which is the most prevalent harmonic in three-phase power systems, is a negative sequence harmonic
causing the motor to have a backward rotation, thus shortening the service life.
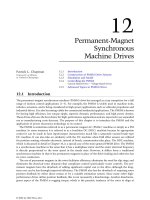
A typical current wave, as drawn by a three-phase AC motor drive, may look like the waveshape shown
in Fig. 17.21. A Fourier analysis of the current would reveal the nature of the harmonics present. Three-
phase ASDs generate primarily the 5th and 7th current harmonics and a lesser amount of 11th, 13th, and
higher orders. The triplen harmonics (3rd, 9th, 15th, i.e., odd multiples of three) are conspicuously missing,
as is usually the case in six-pulse converters, giving them an added advantage over single-phase converters.
However, the triplen harmonics are additive in the neutral and can cause dangerous overheating.
In general, the characteristic harmonics generated by a converter is given by
(17.24)
FIGURE 17.21 Typical current waveform of a three-phase adjustable-speed drive.
hpn1
p 6, 12, 18, …=
n 1, 2, …=
±=
© 2002 by CRC Press LLC
where h is the order of harmonics, n is any integer, and p is the number of pulses generated in each cycle
(six for a three-phase converter).
To understand the impact of harmonics and to design remedies, one must quantify the amount of
harmonics present. This is done by combining all of the harmonic frequency components (voltage or
current) with the fundamental component (voltage or current) to form the total harmonic distortion,
or THD. A commonly accepted definition of THD is as follows:
(17.25)
where I
1
is the fundamental component of the current, I
2
is the second harmonic, I
3
the third harmonic,
and so on. A similar equation can be written for voltage distortion.
Any THD values over 5% are significant enough for concern. Harmonic current distortion greater
than 5% will contribute to the additional heating of a power transformer, so it must be derated for
harmonics. It is not uncommon for THD levels in industrial plants to reach 25%. Normally, THD levels
in office settings will be lower than in industrial plants, but office equipment is much more susceptible
to variations in power quality. Odd-number harmonics (3rd, 5th, 7th, etc.) are of the greatest concern
in the electrical distribution system. Even-number harmonics are usually mitigated because the harmonics
swing equally in both the positive and negative direction. Pesky harmonics can be mitigated by the use
of passive and active filters. Passive filters, consisting of tuned series L-C circuits, are the most popular.
However, they require careful application, and may produce unwanted side effects, particularly in the
presence of power factor correction capacitors.
The active filter concept uses power electronics to produce harmonic components that cancel the
harmonic components from the nonlinear loads so that the current supplied from the source is sinusoidal.
These filters are costly and relatively new.
Passive harmonic filters are constructed from passive elements (resistors, inductors, and capacitors)
and thus the name. These filters are highly suited for use in three-phase, four-wire electrical power
distribution systems. They should be applied as close as possible to the offending loads, preferably at the
farthest three- to single-phase point of distribution. This will ensure maximum protection for the
upstream system. Harmonics can be substantially reduced to as low as 30% by use of passive filters.
Passive filters can be categorized as parallel filters and series filters. A parallel filter is characterized as
a series resonant and trap-type exhibiting a low impedance at its tuned frequency. Deployed close to the
source of distortion, this filter keeps the harmonic currents out of the supply system. It also provides
some smoothing of the load voltage. This is the most common type of filter.
The series filter is characterized as a parallel resonant and blocking type with high impedance at its
tuned frequency. It is not very common because the load voltage can be distorted.
Series Passive Filter
This configuration is popular for single-phase applications for the purpose of minimizing the 3rd
harmonic. Other specific tuned frequencies can also be filtered. Figure 17.22 shows the basic diagram of
a series passive filter.
The advantages of a series filter are that it:
• Provides high impedance to tuned frequency;
• Does not introduce any system resonance;
• Does not import harmonics from other sources;
• Improves displacement power factor and true power factor.
THD
I
I
2
2
I
3
2
I
4
2
…
+++
I
1
-----------------------------------------
100%×
I
h
2
h =2
∞
∑
I
1
---------------
100%×==
© 2002 by CRC Press LLC
Some disadvantages are that it:
• Must handle the rated full load current;
• Is only minimally effective other than tuned harmonic frequencies;
• Can supply nonlinear loads only.
Shunt Passive Filter
The shunt passive filter is also capable of filtering specific tuned harmonic frequencies such as, 5th, 7th,
11th, etc. Figure 17.23 shows a commonly used diagram of a shunt filter. The advantages of a parallel
filter are that it:
• Provides low impedance to tuned frequency;
• Supplies specific harmonic component to load rather than from AC source;
• Is only required to carry harmonic current and not the full load current;
• Improves displacement power factor and true power factor.
Some disadvantages are that:
• It only filters a single (tuned) harmonic frequency;
• It can create system resonance;
• It can import harmonics form other nonlinear loads;
• Multiple filters are required to satisfy typical desired harmonic limits.
Series Passive AC Input Reactor
The basic configuration is shown in Fig. 17.24. This type filters all harmonic frequencies, by varying
amounts. The advantages of a series reactor are:
• Low cost;
• Higher true power factor;
• Small size;
FIGURE 17.22 A series passive filter.
FIGURE 17.23 A shunt passive filter.
C
Input
Source
L
Output
Load
C
L
Input
Source
Output
Load
© 2002 by CRC Press LLC
• Filter does not create system resonance;
• It protects against power line disturbances.
Some disadvantages are that it:
• Must handle the rated full load current;
• Can only improve harmonic current distortion to 30 to 40% at best;
• Only slightly reduces displacement power factor.
Low-Pass (Broadband) Filter
The basic configuration is shown in Fig. 17.25. It is capable of eliminating all harmonic frequencies above
the resonant frequency. The specific advantages of a low-pass filter are that it:
• Minimizes all harmonic frequencies;
• Supplies all harmonic frequencies as opposed to the AC source supplying those frequencies;
• Does not introduce any system resonance;
• Does not import harmonics from other sources;
• Improves true power factor.
Some of the disadvantages are that it:
• Must handle the rated full load current;
• Can supply nonlinear loads only.
Passive Filter Design
The filter design process involves a number of steps that will ensure lowest possible cost and proper
performance under the THD limits. Figure 17.26 shows a flowchart of the entire process.
Characterizing Harmonic-Producing Loads
This is the first step in the process that will produce a summary of the level of harmonics being generated
by nonlinear loads, such as AC adjustable speed drives, power rectifiers, arc furnaces, etc. Harmonic
measurements must be used to characterize the level of harmonic generation for an existing nonlinear
load.
FIGURE 17.24 A series passive AC input reactor.
FIGURE 17.25 Low-pass filter.
L
Input
Source
Output
Load
© 2002 by CRC Press LLC
Characterizing Power System Voltage and Current Distortion
In this step, a power system model is developed for analysis. The model is developed from one-line
diagrams, manufacturer’s data for various electrical equipment, the utility system characteristics, such
as fault MVA, representative impedance, nominal voltage level, and the loading information. Figure 17.27
shows a sample representation of a utility system and an industrial plant supplied by a step-down
transformer. The equivalent utility system can be represented as a simple impedance consisting of a
resistance and an inductive reactance.
Determining System Frequency Response Characteristics
Switching transients created from regular utility operations as well as harmonics emanating from non-
linear loads can both be magnified by power factor correction capacitors if resonant conditions exist.
Therefore, it is necessary to perform simulations or frequency scans to determine the frequency response
characteristics, looking from the low voltage bus. Simulations can be easily carried out by representing
the system as a Thevenin’s equivalent circuit. Such a circuit is shown in Fig. 17.28.
In the figure, L
eq
and R
eq
represent the combined inductance and resistance of the utility system and the
step-down transformer.
(17.26)
FIGURE 17.26 Flowchart for harmonic filter design.
Repeat if
outside limits
DONE
Determine system frequency response
characteristics
Characterize power system voltage and
current distortion
Characterize harmonic producing
loads
Design minimum size filters tuned to
individual harmonic frequencies
Calculate harmonic currents at
PCC
Check against IEEE-519
recommended limits
Z
in
R
eq
jwL
eq
+()−j/wC()
R
eq
jwL
eq
j/wC–+
----------------------------------------------------
=
© 2002 by CRC Press LLC
Parallel resonance occurs when the imaginary part of the denominator is equal to zero. That is,
(17.27)
Solving for
ω
0
:
(17.28)
In hertz:
(17.29)
Frequency scan output consists of magnitude and phase angle for the driving point impedance. The
effect of important system parameters, such as a capacitor, is evaluated and the potential for problem
resonance conditions is determined. Figure 17.29 shows a typical output of a frequency scan simulation
for studying the impact of power factor correction capacitors. Figure 17.30 depicts the proximity of the
resonance points to some of the important harmonic characteristics, such as the 5th, the 7th, the 11th,
and the 13th harmonics for varying levels of capacitive compensation.
FIGURE 17.27 A typical representation of an industrial plant being supplied by a utility system.
FIGURE 17.28 System equivalent circuit with reactive compensation at the load.
Step-down
transformer
Other
plant loads
Nonlinear
loads
Cap
bank
Utility Equivalent
System
PCC
Industrial plant
Plant Main Bus
L
eq
C
R
eq
Z
in
w
0
L
eq
1/w
0
C– 0=
w
0
1
L
eq
C[]
1/2
---------------------
=
f
0
1
2p L
eq
C[]
1/2
----------------------------
=