Tài liệu Project Planning and Control Part 5 ppt
Bạn đang xem bản rút gọn của tài liệu. Xem và tải ngay bản đầy đủ của tài liệu tại đây (694.24 KB, 46 trang )
21
Subdivision of blocks
One major point which requires stressing covers
the composition of a string of activities. It has
already been mentioned that the site should be
divided into blocks which are compatible with
the design networks. However, each block could
in itself be a very large area and a complex
operational unit. It is necessary, therefore, to
subdivide each block into logical units. There are
various ways of doing this. The subdivision could
be by:
1 Similar items of equipment;
2 Trades and disciplines;
3 Geographical proximity;
4 Operational systems;
5 Stages of completion.
Each subdivision has its own merits and justifies
further examination.
1 Similar items of equipment
Here the network shows a series of strings which
collect together similar items of equipment, such
as pumps, tanks, vessels, boilers, and roads. This
is shown in Figure 21.1.
Set pump
Erect
tank bott.
Harden
Erect
roof
Insulate
Hardening
Construct
pad
Cast
pipes
Align
motor
Erect
shell
Erect
exchanger
Cast
founds.
Construct
base
Cast
founds.
Excavate
Excavate
Excavate
Pump A
Tank A
Exchanger A
Pump B
Tank B
Exchanger B
Pump C
Tank C
Exchanger C
Project Planning and Control
Advantages:
(a) Equipment items are quickly found;
(b) Interface with design network is easily established.
2 Trades and disciplines
This network groups the work according to type. It is shown in Figure
21.2.
Advantages:
(a) Suitable when it is desirable to clear a trade off the site as soon as
completed;
(b) Eases resource loading of individual trades.
3 Geographical proximity
It may be considered useful to group together activities which are
geographically close to each other without further segregation into types or
trades. This is shown in Figure 21.3.
166
Figure 21.1 Similar items of equipment
Align
Align
Test
Test
Concrete
Lay
pipe
Connect
piping
Set
up
Set
up
Erect
exchanger
Erect
Lay
kerbs
Insulate
Insulate
Connect
piping
Concrete
Concrete
Build
pier
Construct
base
Construct
base
Construct sleepers
Excavate
founds
Excavate
founds
Excavate
founds
Excavate
founds
Grade
area
Level
ground
Pumps A
Pumps B
Exchanger
Vessel
Roads
Piping
Subdivision of blocks
Advantages:
(a) Makes a specific area self-contained and eases control;
(b) Coincides frequently with natural subdivision on site for construction
management.
4 Operational systems
Here the network consists of all the activities associated with a particular
system such as the boiler plant, the crude oil loading and the quarry crushing
and screening. A typical system network is shown in Figure 21.4.
167
Figure 21.2 Trades and disciplines
Figure 21.3 Geographical proximity
Project Planning and Control
Advantages:
(a) Easy to establish and monitor the essential interrelationships of a
particular system;
(b) Particularly useful when commissioning is carried out by system since a
complete ‘package’ can be programmed very easily;
(c) Ideal where stage completion is required.
5 Stages of completion
If particular parts of the site have to be completed earlier than others (i.e. if
the work has to be handed over to the client in well-defined stages), it is
essential that each stage is programmed separately. There will, of course, be
interfaces and links with preceding and succeeding stages, but within these
boundaries the network should be self-contained.
Advantages:
(a) Attention is drawn to activities requiring early completion;
(b) Predictions for completion of each stage are made more quickly;
(c) Resources can be deployed more efficiently;
(d) Temporary shut-off and blanking-off operations can be highlighted.
In most cases a site network is in fact a combination of a number of the above
subdivisions. For example, if the boiler plant and water treatment plant are
168
Figure 21.4 Operational system
Design
Design and drawing
Drums1
Headers2
Boiler
tubes
3
Base
frame
4
Valve
& S.V.
5
Gauges
6
Fans &
motor
7
Ducts8
Site
insulate
9
Procurement
Manufacture
Assemply and desp. to site
Design
Design
Design
Design
Drawing
Drawing
Drawing
Drawing
Select
Select
Design
Drgs
Requ'n
plate
Requ'n
Requ'n
Requ'n
Requ'n
Requ'n
Requ'n
Requ'n
plate
Manuf. plate
Tender
Tender
Delivery
Tender
Tender
Tender
Deliver
Deliv
Deliv
Inspect
Inspect
Manufacture
Roll
Fabric
Fin
Fabric
Fabric
Weld
Drill
Bend
Erect
base
Test
Delivery to site
Delivery to site
Paint
Drill
Erect
towers
Delivery to site
Deliver
Erect
Erect
Fit
tubes
Refract
Press
test
Desp
Erect
Erect
Insulate
Figure 21.5 Simplified boiler network
Project Planning and Control
170
required first to service an existing operational unit, it would be prudent to
draw a network which is based on (4) (operational systems) but incorporating
also (5) (stages of completion). In practice, (3) (geographical proximity)
would almost certainly be equally relevant since the water treatment plant and
boiler plant would be adjacent.
It must be emphasized that the networks shown in Figures 21.1 to 21.4 are
representative only and do not show the necessary inter-relationships or
degree of detail normally shown on a practical construction network. The
oversimplication on these diagrams may in fact contradict some of the
essential requirements discussed in other sections of this book, but it is hoped
that the main point, i.e. the differences between the various types of
construction network formats, has been highlighted.
Banding
If we study Figure 21.1 we note that it is very easy to find a particular activity
on the network. For example, if we wanted to know how long it would take
to excavate the foundations of exchanger B, we would look down the column
EXCAVATE
until we found the line
EXCHANGER B
, and the intersection of this
column and line shows the required excavation activity. This simple
identification process was made possible because the diagram in Figure 21.1
was drawn using very crude subdivisions or bands to separate the various
operations.
For certain types of work this splitting of the network into sections can be
of immense assistance in finding required activities. By listing the various
types of equipment or materials vertically on the drawing paper and writing
the operations to be performed horizontally, one produces a grid of activities
which almost defines the activity. In some instances the line of operations may
be replaced by a line of departments involved. For example, the electrical
department involvement in the design of a piece of equipment can be found
by reading across the equipment line until one comes to the electrical
department column.
The principle is shown clearly in Figure 21.5, and it can be seen that the
idea can be applied to numerous types of networks. A few examples of
banding networks are given below, but these are for guidance only since the
actual selection of bands depends on the type of work to be performed and the
degree of similarity of operation between the different equipment items.
Subdivision of blocks
Vertical listing Horizontal listing
(Horizontal line) (Vertical column)
Equipment Operations
Equipment Departments
Material Operations
Design stages Departments
Construction stages Subcontracts
Decision stages Departments
Approvals Authorities (clients)
Operations Department responsibilities
Operations Broad time periods
It may, of course, be advantageous to reverse the vertical and horizontal
bands; when considering, for example, the fifth item on the list, the
subcontracts could be listed vertically and the construction stages horizontally.
This would most likely be the case when the subcontractors perform similar
operations since the actual work stages would then follow logically across the
page in the form of normally timed activities. It may indeed be beneficial to
draw a small trial network of a few (say, 20–30) activities to establish the best
banding configuration.
It can be seen that banding can be combined with the coordinate method of
numbering by simply allocating a group of letters of the horizontal
coordinates to a particular band.
Banding is particularly beneficial on master networks which cover, by
definition, a number of distinct operations or areas, such as design,
manufacture, construction and commissioning. Figure 21.5 is an example of
such a network.
171
22
Project management and
planning
Responsibilities of the project
managers
It is not easy to define the responsibilities of a
project manager, mainly because the scope cov-
ered by such a position varies not only from
industry to industry but also from one company
to another. Three areas of responsibility, however,
are nearly always part of the project manager’s
brief:
1 He must build the job to specification and to
satisfy the operational requirements.
2 He must complete the project on time.
3 He must build the job within previously
established budgetary constraints.
The last two are, of course, connected: gen-
erally, it can be stated that if the job is on
schedule, either the cost has not exceeded the
budget or good grounds exist for claiming any
extra costs from the client. It is far more difficult
to obtain extra cash if the programme has been
exceeded and the client has also suffered loss due
to the delay.
Project management and planning
Time, therefore, is vitally important, and the control of time, whether at the
design stage or the construction stage, should be a matter of top priority with
the project manager. It is surprising, therefore, that so few project managers
are fully conversant with the mechanics of network analysis and its
advantages over other systems. Even if it had no other function but to act as
a polarizing communication document, it would justify its use in preference to
other methods.
Information from network
A correctly drawn network, regularly updated, can be used to give vital
information and has the following beneficial effects on the project.
1 It enables the interaction of the various activities to be shown graphically
and clearly.
2 It enables spare time or float to be found where it exists so that advantage
can be taken to reduce resources if necessary.
3 It can pinpoint potential bottlenecks and trouble spots.
4 It enables conflicting priorities to be resolved in the most economical
manner.
5 It gives an up-to-date picture of progress.
6 It acts as a communication document between all disciplines and parties.
7 It shows all parties the intent of the method of construction.
8 It acts as a focus for discussion at project meetings.
9 It can be expanded into subnets showing greater detail or contracted to
show the chief overall milestones.
10 If updated in coloured pencil, it can act as a spur between rival gangs of
workers.
11 It is very rapid and cheap to operate and is a base for EVA.
12 It is quickly modified if circumstances warrant it.
13 It can be used when formulating claims, as evidence of disruption due to
late decisions or delayed drawings and equipment.
14 Networks of past jobs can be used to draft proposal networks for future
jobs.
15 Networks stimulate discussion provided everyone concerned is familiar
with them.
16 It can assist in formulating a cash-flow chart to minimize additional
funding.
To get the maximum benefit from networks, a project manager should be
able to read them as a musician reads music. He should feel the slow
173
Project Planning and Control
movements and the crescendos of activities and combine these into a
harmonious flow until the grand finale is reached.
To facilitate the use of networks at discussions, the sheets should be
reduced photographically to A3 (approximately 42 cm × 30 cm). In this way,
a network can be folded once and kept in a standard A4 file, which tends to
increase its usage. Small networks can, of course, be drawn on A3 or A4 size
sheets in the first place, thus saving the cost of subsequent reduction in
size.
It is often stated that networks are not easily understood by the man in the
field, the area manager or the site foreman. This argument is usually supported
by statements that the field men were brought up on bar charts and can,
therefore, understand them fully, or that they are confused by all the computer
printouts, which take too long to digest. Both statements are true. A bar chart
is easy to understand and can easily be updated by hatching or colouring in the
bars. It is also true that computer output sheets are overwhelming by their
sheer bulk and complexity, and the man on the site just cannot afford the time
leafing through reams of paper. Even if the output is restricted to a discipline
report, only applicable to the person in question, confusion is often caused by
the mass of data on earliest and latest starting and finishing times and on the
various types of float. As is so often the case, network analysis and
computerization are regarded as being synonymous, and the drawbacks of the
latter are then invoked (often quite unwittingly) to discredit the former.
The writer’s experience, however, contradicts the argument that site people
cannot or will not use networks. On the contrary, once the foreman
understands and appreciates what a network can do, he will prefer it to a bar
chart. This is illustrated by the following example, which describes an actual
situation on a contract.
Site-preparation contract
The job described was a civil engineering contract comprising the construc-
tion of oversite base slabs, roads, footpaths and foul and stormwater sewers
for a large municipal housing scheme consisting of approximately 250 units.
The main contractor, who confined his site activities to the actual house
building, was anxious to start work as soon as possible to get as much done
before the winter months. It was necessary, therefore, to provide him with
good roads and a fully drained site.
Contract award was June and the main contractor was programmed to start
building operations at the end of November the same year. To enable this quite
174
Project management and planning
short civil-engineering stage to be completed on time, it was decided to split
the site into four main areas which could be started at about the same time.
The size and location of these areas was dictated by such considerations as
access points, site clearance (including a considerable area of woodland),
natural drainage and house-building sequence.
Once this principle was established by management, the general site
foreman was called in to assist in the preparation of the network, although it
was known that he had never even heard of, let alone worked to, a critical path
programme.
After explaining the basic principles of network techniques, the foreman
was asked where he would start work, what machines he would use, which
methods of excavation and construction he intended to follow, etc. As he
explained his methods, the steps were recorded on the back of an old drawing
print by the familiar method of lines and node points (arrow diagram).
Gradually a network was evolved which grew before his eyes and his previous
fears and scepticism began to melt away.
When the network of one area was complete, the foreman was asked for the
anticipated duration of each activity. Each answer was religiously entered on
the network without query, but when the forward pass was made, the overall
period exceeded the contract period by several weeks. The foreman looked
worried, but he was now involved. He asked to be allowed to review some of
his durations and reassess some of the construction methods. Without being
pressurized, the man, who had never used network analysis before, began the
process that makes network analysis so valuable, i.e. he reviewed and refined
the plan until it complied with the contractual requirements. The exercize was
repeated with the three other areas, and the following day the whole operation
was explained to the four chargehands who were to be responsible for those
areas.
Four separate networks were then drawn, together with four corresponding
bar charts. These were pinned on the wall of the site hut with the instruction
that one of the programmes, either networks or bar chart, be updated daily.
Great stress was laid on the need to update regularly, since it is the monitoring
of the programme that is so often neglected once the plan has been drawn. The
decision on which of the programmes was used for recording progress was left
to the foreman, and it is interesting to note that the network proved to be the
format he preferred.
Since each chargehand could compare the progress in his area with that of
the others, a competitive spirit developed quite spontaneously to the delight of
175
Project Planning and Control
management. The result was that the job was completed four weeks ahead of
schedule without additional cost. These extra weeks in October were naturally
extremely valuable to the main contractor, who could get more units
weatherproof before the cold period of January to March. The network was
also used to predict cash flow, which proved to be remarkably accurate. (The
principles of this are explained in Chapter 26.)
It can be seen, therefore, that in this instance a manual network enabled the
project manager to control both the programme (time) and the cost of the job
with minimum paperwork. This was primarily because the men who actually
carried out the work in the field were involved and were convinced of the
usefulness of the network programme.
Confidence in plan
It is vitally important that no one, but no one, associated with a project must
lose faith in the programme or the overall plan. It is one of the prime duties
of a project manager to ensure that this faith exists. Where small cracks do
appear in this vital bridge of understanding between the planning depart-
ment and the operational departments, the project manager must do
everything in his power to close them before they become chasms of
suspicion and despondency. It may be necessary to re-examine the plan, or
change the planner, or hold a meeting explaining the situation to all parties,
but a plan in which the participants have no faith is not worth the paper
it is drawn on.
Having convinced all parties that the network is a useful control tool, the
project manager must now ensure that it is kept up to date and the new
information transmitted to all the interested parties as quickly as possible. This
requires exerting a constant pressure on the planning department, or planning
engineer, to keep to the ‘issue deadlines’, and equally leaning on the
operational departments to return the feedback documents regularly. To do
this, the project manager must use a combination of education, indoctrination,
charm and rank pulling, but the feedback must be returned as regularly as the
issue of the company’s pay cheque.
The returned document might only say ‘no change’, but if this vital link is
neglected, the network ceases to be a live document. The problem of feedback
for the network is automatically solved when using the SMAC cost control
system (explained in Chapter 27), since the manhour returns are directly
176
Project management and planning
related to activities, thus giving a very accurate percentage completion of each
activity.
It would be an interesting and revealing experience to carry out a survey
among project managers of large projects to obtain their unbiased opinion on
the effectiveness of networks. Most of the managers with whom this problem
was discussed felt that there was some merit in network techniques, but,
equally, most of them complained that too much paper was being generated by
the planning department.
Network and method statements
More and more clients and consultants require contractors to produce method
statements as part of their construction documentation. Indeed, a method
statement for certain complex operations may be a requirement of ISO 9000
Part I. A method statement is basically an explanation of the sequence of
operations augmented by a description of the resources (i.e. cranes and other
tackle) required for the job. It must be immediately apparent that a network
can be of great benefit, not only in explaining the sequence of operations to
the client but also for concentrating the writer’s mind when the sequence is
committed to paper. In the same way as the designer produces a freehand
sketch of his ideas, so a construction engineer will be able to draw a freehand
network to crystallize his thoughts.
The degree of detail will vary with the complexity of the operation and the
requirements of the client or consultant, but it will always be a clear graphical
representation of the sequences, which can replace pages of narrative. Any
number of activities can be ‘extracted’ from the network for further
explanation or in-depth discussion in the accompanying written statement.
The network, which can be produced manually or by computer, will mainly
follow conventional lines and can, of course, be in arrow diagram or
precedence format. For certain operations, however, such as structural
steelwork erection, it may be advantageous to draw the network in the form
of a table, where the operations (erect column, erect beam, plumb and level,
etc.) are in horizontal rows. In this way, a highly organized, easy-to-read
network can be produced. Examples of such a procedure are shown in Figures
22.1 and 22.2. There are doubtless other situations where this system can be
adopted, but the prime objective must always be clarity and ease of
understanding. Complex networks only confuse clients, and reflect a lack of
appreciation of the advantages of method statements.
177
Project Planning and Control
Integrated systems
The trend is to produce and operate integrated project management systems.
By using the various regular inputs generated by the different operating
departments, these systems can, on demand, give the project manager an up-
to-date status report of the job in terms of time, cost and resources. This
facility is particularly valuable once the project has reached the construction
stage. The high cost of mainframe machines and the unreliability of regular
feedback – even with the use of terminals – has held back the full utilization
of computing facilities in the field, especially in remote sites. The PCs, with
their low cost, mobility and ease of operation, have changed all this so that
effective project control information can be generated on the spot.
The following list shows the type of management functions which can be
successfully carried out either in the office, workshop or on a site by a single
computer installation:
cost accounting
material control
plant movement
178
Figure 22.1 Structural framing plan
Project management and planning
179
Figure 22.2 Network of method statement
machine loading
manhour and time sheet analysis
progress monitoring
network analysis and scheduling
risk analysis
technical design calculations, etc.
Project Planning and Control
Additional equipment is available to provide presentation in graphic form
such as bar charts, histograms, S-curves and other plots. If required, these can
be in a number of colours to aid in identification.
The basis of all these systems is, however, still a good planning method
based on well-defined and realistic networks and budgets. If this base is
deficient, all comparisons and controls will be fallacious. The procedures
described in Chapters 11 to 15 therefore still apply. In fact the more
sophisticated the analysis and data processing the more accurate and
meaningful the base information has to be. This is because the errors tend to
be multiplied by further manipulation and the wider dissemination of the
output will, if incorrect, give more people the wrong data on which to base
management decisions.
180
23
Network applications
outside the construction
industry
Most of the examples of network analysis in this
book are taken from the construction industry,
mainly because network techniques are partic-
ularly suitable for planning and progressing the
type of operations found in either the design
office or on a site. However, many operations
outside the construction industry that comprise a
series of sequential and parallel activities can
benefit from network analysis – indeed, the
Polaris project is an example of such an
application.
The following examples are included, there-
fore, to show how other industries can make use
of network analysis, but as can be seen from
Chapter 18, even the humble task of getting up in
the morning can be networked. When network
analysis first became known, one men’s maga-
zine even published a critical path network of a
seduction!
Project Planning and Control
1 Bringing a new product onto the market
The operations involved in launching a new product require careful planning
and coordination. This example shows how network techniques were used to
plan the development, manufacture and marketing of a new type of water
meter for use in countries where these are installed on every premises.
The list of operations are first grouped into five main functions:
A Management;
B Design and development;
C Production;
D Purchasing and supply;
E Sales and marketing.
Each main function is then divided into activities which have to be carried out
in defined sequences and by specific times. The management function would
therefore include the following activities:
A–1 Definition of product – size, range, finish, production rate,
etc.
2 Costing – selling price, manufacturing costs.
3 Approvals for expenditure – plant materials, tools and jigs, stor-
age, advertising, training, etc.
4 Periodic reviews
5 Instruction to proceed with stages
The design and development function would consist of:
B–1 Product design brief
2 Specification and parts list
3 Prototype drawings
4 Prototype manufacture
5 Testing and reports
6 Preliminary costing
Once the decision has been made to proceed with the meter, the production
department will carry out the following activities:
C–1 Production planning
2 Jig tool manufacture
3 Plant and machinery requisition
182
Network applications outside the construction industry
4 Production schedules
5 Materials requisitions
6 Assembly-line installation
7 Automatic testing
8 Packing bay
9 Inspection procedures
10 Labour recruitment and training
11 Spares schedules
The purchasing and supply function involves the procurement of all the
necessary raw materials and bought-out items and includes the following
activities:
D–1 Material enquiries
2 Bought-out items enquiries
3 Tender documents
4 Evaluation of bids
5 Long delivery orders
6 Short delivery orders
7 Carton and packaging
8 Instruction leaflets, etc.
9 Outside inspection
The sales and marketing function will obviously interlink with the
management function and consists of the following activities:
E–1 Sales advice and feedback
2 Sales literature – photographs, copying, printing, films,
displays, packaging.
3 Recruitment of sales staff
4 Sales campaign and public relations
5 Technical literature – scope and production.
6 Market research
Obviously, the above breakdowns are only indicative and the network shown
in Figure 23.1 gives only the main items to be programmed. The actual
programme for such a product would be far more detailed and would probably
contain about 120 activities.
The final presentation could then be in bar chart form covering a time span
of approximately 18 months from conception to main production run.
183
Define
product
Assy. line
drgs
Supplier
list
Package
design
Photos
Write
sales lit
Field
campaign
Leaflet
design
Test rig
drg.
Jig
design
Design
brief
Prelim
cost
Tender
docs
Tender
docs
Package
tender
lit.
Evacuate
response
Tender
period
Test rig
manuf.
Jig
tender
Tool
tender
Recruit
labour
Tech
review
Spec
Prototype
design
Approve
stage 1
Tender
period
Tender
period
Tender
period
Mailing
lists
Review
Tender
period
Test rig
assy.
Delivery
Delivery
Train
Jig
assy.
Delivery
Evaluate
Evaluate
lit.
Delivery
Evaluate
Parts
list
Drgs
Prototype
manuf
Assy. line
layout
Bought
items
Re-cost
Assy. line
assembly
Short
delivery
Delivery
Recruit
staff
Evaluate
response
Long
delivery
Assembly
Equipment
list
Approve
stage 2
Pilot
run
Tests
Mock-up
Final
cost
Test
Production
run
Report
Report
1
a
A
Management
b
B
Design and
development
c
C
Production
d
= Purchase
order
e
D
Purchasing
and supply
f
E
Sales and
Marketing
g
h
j
k
l
m
n
p
q
2
3
4
5
6
7
8
9
Approve
stages
Pack
Test
Pack
Figure 23.1 New product
Network applications outside the construction industry
2 Moving a factory
One of the main considerations in moving the equipment and machinery of a
manufacturing unit from one site to another is to carry out the operation with
the minimum loss of production. Obviously, at some stage manufacturing
must be halted unless certain key equipment is duplicated, but if the final
move is carried out during the annual works’ holiday period the loss of output
is minimized.
Consideration must therefore be given to the following points:
1 Equipment or machines which can be temporarily dispensed with;
2 Essential equipment and machines;
3 Dismantling problems of each machine;
4 Re-erection;
5 Service connections;
6 Transport problems – weight, size, fragility;
7 Orders in pipeline;
8 Movement of stocks;
9 Holiday periods;
10 Readiness of new premises;
11 Manpower availability;
12 Overall cost;
13 Announcement of move to customers and suppliers;
14 Communication equipment (telephone, e-mail, fax);
15 Staff accommodation during move;
16 Trial runs;
17 Staff training.
By collecting these activities into main functions, a network can be produced
which will facilitate the organization and integration of the main require-
ments. The main functions would therefore be:
A Existing premises and transport;
B New premises – commissioning;
C Services and communications;
D Production and sales;
E Manpower, staffing.
The network for the complete operation is shown in Figure 23.2. It will be
noticed that, as with the previous example, horizontal banding (as described
in Chapter 21) is of considerable help in keeping the network disciplined.
185
Dismantle
mach. H-M
Take over
new factory
Install
water
Install
power
Install
telephone
Commission
H-M
Advertise
for staff
Production A-G
old prem.
Final
housing
circulars
Training
Normal production
A-G
Install
H-M
Move part
raw material
Clear
with m.o.t
Dismantle
mach. A-G
Prepare
founds H-M
Pipe up
90%
Distribution
Internal
ext.
Temp production
H-M
Interviews Delay
Commission
A-G
Move exist.
staff
Advise
suppl. e cust
Normal production
H-M
Power
H-M
Piping
10%
Move
mach. H-M
Move parts
for H-M
Prepare
founds A-G
Move
mach. A-G
Move finished
stock
Power
A-G
Install
mach. A-G
A
Work in old
premises
B
Work in new
premises
C
Services
D
Production
E
Manpower
Main machines A–G
Second machines H–M
Project Planning and Control
186
Figure 23.2 Moving a factory
By transferring the network onto a bar chart it will be possible to arrange
for certain activities to be carried out at weekends or holidays. This may
require a rearrangement of the logic which, though not giving the most
economical answer in a physical sense, is still the best overall financial
solution when production and marketing considerations are taken into
account.
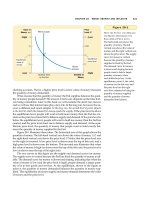
3 Centrifugal pump manufacture
The following network shows the stages required for manufacturing
centrifugal pumps for the process industry. The company providing
these pumps has no foundry, so the unmachined castings have to be bought
in.
Network applications outside the construction industry
Assuming that the drawings for the pump are complete and the assembly
line set up, a large order for a certain range of pumps requires the following
main operations:
1 Order castings – bodies, impellers;
2 Order raw materials for shafts, seal plates, etc.;
3 Order seals, bearings, keys, bolts;
4 Machine castings, impellers;
5 Assemble;
6 Test;
7 Paint and stamp;
8 Crate and dispatch;
9 Issue maintenance instructions and spares list.
Figure 23.3 shows the network of the various operations complete with
coordinate node numbers, durations and earliest start times. The critical path
is shown by a double line and total float can be seen by inspection. For
example, the float of all the activities on line C is 120–48 = 72 days. Similarly,
the float of all activities on line D is 120–48 = 72 days.
Figure 23.4 is the network redrawn in bar-chart form, on which the floats
have been indicated by dotted lines. It is apparent that the preparation of
documents such as maintenance manuals, spares lists and quotes can be
delayed without ill effect for a considerable time, thus releasing these
technical resources for more urgent work such as tendering for new
enquiries.
4 Planning a mail order campaign
When a mail order house decides to promote a specific product a properly
coordinated sequence of steps have to be followed to ensure that the campaign
will have the maximum impact and success. The following example shows the
activities required for promoting a new set of records and involves both the
test campaign and the main sales drive.
The two stages are shown separately on the network (Figure 23.5) since
they obviously occur at different times, but in practice intermediate results
could affect management decisions on packaging and text on the advertising
leaflet. At the end of the test shot management will have to decide on the
percentage of records to be ordered to meet the initial demand.
187
110
5
90
48
48
48
121
125
126.5
30
4
30
18
18
18
120
120
54
98
48
124.5
124.5
126
28
3
28
17
17
17
119
98
54
124
124
39
25
7
A
2
7
B
3
C
3
D
3
E
117
F
97
G
53
H
123
J
39
K
18.5
L
20
M
0
1
0
0
0
0
122
18
18
18
Manufacture
Do
Delivery
Delivery
Inspection
Assembly
Paint
Invoice
Evaluate
Do
Do
Do
Do
Drill
body
Balance
Stamp
Test cert
Tender
period
Do
Do
Do
Do
Machine
body
Machine
impeller
Machine
shaft
Vol and
press test
Advice
note
Spares
quote
Tender doc.
pump body
Tender doc.
impeller
Tender doc.
bearings
Tender doc.
seals
Tender doc.
shaft steel
Assemble
on test rig
Maintenance
manual
Prepare
documents
Spares
list
80
60
30
30
30
1
0.5
0.5
2
2
1
1
1
1
0.5
3
21
21
14
14
2
1
1
1
0.5
5
1
1
0.5
2
I
Procurement
and outside
inspection
II
Machining
and
assembly
III
Test and
despatch
IV
Documents
117
7
97
126
112
6
92
53
122
125.5
Delivery
Do
Despatch
Inspection
Do
Delivery
Inspection
Crate
5
5
0.5
39
2
2
5
1
0.5
7
7
3
3
3
Figure 23.3 Pump manufacture (duration in days)
A
B
C
D
E
1
1
1
1
1
1
1
1
1
2
2
2
2
2
2
2
2
2
2
2
2
2
2
2
2
2
2
3
3
3
3
3
2
3
3
3
3
3
3
3
3
3
3
3
4
4
4
4
4
7
5
3
3
3
4
4
4
4
4
4
4
4
5
5
5
5
5
5
4
4
4
4
5
5
5
56
6
6
6
6
76
3
2
A
B
C
D
E
C
D
E
F
G
K
K
L
M
M
L
L
G
J
H
B
B
A
5
56
67
A
020
Critical path
Float
40
A1
A2
A3
A4
A5
A6
B1
B2
B3
B4
B5
B6
C1
C2
C3
C4
D1
D2
D3
D4
E1
E2
E3
E4
E5
F2
F3
G2
G3
G4
G5
H2
J1
J2
J3
J4
J5
J6
K1
K3
L1
L2
L4
M1
M2
Beg.
A2
A3
A4
A5
A6
A7
B2
B3
B4
B5
B6
B7
C2
C3
C4
C5
D2
D3
D4
D5
E2
E3
E4
E5
E6
F3
F4
G3
G4
G5
G6
H3
J2
J3
J4
J5
J6
J7
K2
K4
L2
L3
L5
M2
M3
End
7
21
2
80
2
5
7
2
2
60
2
5
3
14
1
30
3
14
1
30
3
12
1
30
5
2
1
1
1
1
1
1
1
1
.5
.5
.5
.5
21
.5
.5
.5
.5
2
5
D
60 80
Days
100 120
Network applications outside the construction industry
In practice, the test shot will consist of three or more types of advertising
leaflet and record packaging, and the result of each type will have to be
assessed before the final main campaign leaflets are printed.
Depending on the rate of return of orders, two or more record ordering and
dispatch stages will have to be allowed for. These are shown on the network
as B1 and B2.
189
Figure 23.4 Pump manufacture – critical path analysis