Tài liệu Chapter 7_Project management process improvement ppt
Bạn đang xem bản rút gọn của tài liệu. Xem và tải ngay bản đầy đủ của tài liệu tại đây (188.16 KB, 23 trang )
7
Case Study: B. Stoveburden Trucking
Company
Improvement initiatives may be little more than educated guesses at the ideas
and activities that have the potential of improving the maturity level of a process
or knowledge area. Remember, they may have come as a result of a brainstorm-
ing session. Even though they are the task force’s educated guesses, they are
expected to result in some level of improvement. That expectation may even be
stated quantitatively. As a result, we have to continuously monitor the actual
improvement and take the necessary steps to continue to deliver improvements
until that expectation is met or it is clear that it cannot be met following the cur-
rent approach. In this chapter we will take a much closer look at the perform-
ance of those improvement initiatives and develop action plans to reach specific
maturity level goals.
We will illustrate a continuous improvement program, by way of a case
study, which is drawn from an actual client engagement (obviously, the names
have been changed to protect the client’s identity). Not all of the analyses that
were conducted produced usable results, so only the more informative analyses
will be shown here.
In this chapter we will follow the improvement initiatives from beginning
to end. The case study is particularly well suited to this book because it utilizes
all of the tools and analyses introduced in the earlier chapters. My purpose in
presenting this case study is to demonstrate the power and applicability of the
tools. You will also gain a better understanding of how to plan and execute an
effective improvement program. I find the case study particularly instructive
because it speaks of a situation that I have experienced in a number of client
141
companies. Typical of the client in this case study, as well as several other clients,
is that they have established a project management methodology that was the
result of a major corporate initiative. Unfortunately, it has not been embraced
by the project management community. Many project managers held fast to
their old ways because they did not see how the new approach was any better
than what they had been using for many years. They were comfortable using
their old ways and were not willing to risk taking the new ways. “If it ain’t
broke, why should I fix it?” was the position that many of them took. In other
cases they did not understand the new approach or its documentation and so
reverted to their old ways. This is not what the company had in mind, and so
they were led to take a more aggressive and thoughtful approach to getting the
new methodology integrated into the organization. Does this sound familiar to
you? If so, you should find some guidance and sound advice in this chapter. If
not, this chapter will prepare you for the day when you do.
7.1 Case Study Background
The B. Stoveburden Trucking Company was formed shortly after WWII by
Benny Stoveburden and has run continuously and successfully as a long haul
trucker since its beginnings. Its current president is Bea, who is Benny’s grand-
daughter. Benny passed management control of the company to Bea in 2000.
Bea had no experience in the trucking business but she did bring some skills that
Benny knew would come in handy. Her previous experience included a signifi-
cant stint as a project manager for a large retail organization in the Midwest. She
had personally introduced project management to her employer and has first-
hand experience at growing a project management culture from the very begin
-
nings. She knows the value of collaboration in defining, documenting, and
implementing a project management methodology and of the bottom line
impact that project management can have on an organization. As a result of that
experience she championed a similar effort at B. Stoveburden. She appointed a
task force of project managers, other managers, and a few senior level managers,
and in less than 3 years she had put a project management methodology in place
within the IT department (ITD). As part of that effort a PMO had been estab
-
lished as a support for the ITD. The results were less than Bea expected. Usage of
the methodology was spotty and the failure rate of projects was unchanged. Bea
knew that a more aggressive effort would be needed if the business was to be
favorably impacted. She commissioned another task force to investigate the situa
-
tion. Its membership consisted of project managers. The goal of the project was
to reduce quarterly ITD project failure rates from 60% to 30% within 3 years.
The failure rate was calculated as follows: of all the IT projects that were begun in
a particular quarter, how many failed because:
142 Project Management Process Improvement
•
They were canceled;
•
They were over budget;
•
They were completed late;
•
They did not meet the client’s specifications;
•
They were not able to deliver the expected business value.
The percentage was used as the project failure rate for the quarter in which
those projects began. As the improvement program put documentation and
practice changes in place, the value of this metric would change. The changing
values will reflect movement towards or away from the goal failure rate. That
movement would direct future initiatives. The current value was 60%. The goal
value was to reduce it to 30% within 3 years. If the improvement program was
successful, the team would see a continual downward trend as the project failure
rate converged towards 30%.
7.1.1 Project Overview Statement
Because this program was so important to the organization, senior management
thought that it should be spearheaded by a senior manager. Laurie Driver, the
director of the PMO, was chosen as project manager. Laurie was responsible for
proposing and selling senior management on the idea of a PMO. She had a lot
to gain by the success of this project and she knew it would firmly establish the
PMO as a business results organization. She was totally committed to the suc-
cess of the initiative and had earned the respect of the other senior managers for
her work in establishing the project management process they now used.
Laurie began the initiative by assembling a small task force of project man
-
agers to help draft the POS. Figure 7.1 is the POS they drafted and had
approved by Sal Vation, the CIO.
This POS is short and quite simple. My advice is not to write any more
than you need for approval to conduct the project. The more you write, the
more reasons you give someone to reject your proposed idea. In this case the
impetus for the project came from senior management, not from Laurie. She
was simply responding to their request. That means that Laurie did not have to
do too much selling to get project approval. The current problem was simply
stated and all senior managers would recognize it as a problem. It was no secret
that the project failure rate was out of control. The goal was also simply stated:
remove the reasons for project failure and bring the failure rate under control.
The objective statement could have been more detailed but Laurie felt that that
would require some conclusions on her part, and rather than risk the objections
of senior management, she chose the low road. The success criterion was given
Case Study: B. Stoveburden Trucking Company 143
to Laurie by senior management and so there wouldn’t be any disagreement
here. The assumptions, risks, and obstacles statement seemed plausible.
144 Project Management Process Improvement
PROJECT
OVERVIEW
STATEMENT
Date
Approved by
Date
Prepared by
Assumptions, Risks, Obstacles
Success Criteria
Objectives
Goal
Problem/Opportunity
Project ManagerProject No.Project Name
1-16-2004
Sal Vation
1-14-2004
Laurie Driver
1. The project failure rate is inversely related to the PD and PP maturity levels.
2. The PMO can effectively enforce project management standards of practice.
3. Senior managers will continuously maintain a high level of support for this project
until it is complete.
The project failure rate will be reduced from 60% to 30% as measured on a quarterly
basis within 3 years of the start of this project
1. Identify and categorize the reasons why projects fail.
2. Based on their impact on project success, prioritize the reasons why projects fail.
3. Implement a series of initiatives to reduce the project failure rate.
Design and launch a long-term program to identify and remove the causes
of project failures.
The current project failure rate is near 60%, which is unacceptable.
Laurie Driver
PMO.04.02
Project Failure Rate Reduction
Figure 7.1 POS for the project failure rate reduction project.
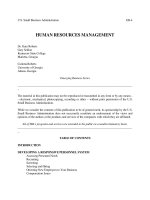
7.1.2 Fishbone Diagram to Identify the Reasons Why Projects Fail
Before any of the project managers could begin offering their reasons for their
projects’ failures, Laurie decided to get to the bottom of this situation. She con
-
structed a fishbone diagram from the data of the nine most recent project fail
-
ures in an attempt to isolate the reason(s) for the failures. If the reasons for the
failures could be isolated, she felt that she could initiate a corrective action pro
-
gram to prevent their recurrence. Figure 7.2 is the fishbone diagram the task
force supplemented the data collected by interviewing the project managers and
teams from the nine failed projects.
As you can see from the figure, Laurie structured her investigation around
the five phases of a project. She and her task force of project managers, none of
whom had managed any of the nine failed projects, collected the perceived rea
-
sons for project failure from each of the nine project teams and integrated that
with information gleaned from the project notebooks and the final reports of
the nine failed projects. The reasons that they thought their projects failed are
listed in the figure. Some of the project managers gave multiple reasons. It is
interesting and maybe not surprising that none of the failures are attributed to
any actions on the part of the project team. In any case, the data gave Laurie and
the team several clues that pointed to four specific knowledge areas where they
might focus their attention. They are briefly discussed below.
7.1.2.1 Scope Management
The comments from the project managers clearly point to scope management as
an area of concern. Several statements confirm that conclusion:
Case Study: B. Stoveburden Trucking Company 145
Faulty acceptance criteria
Weak HR
process
Weak change mgt
Partial process
documentation
Weak
HR process
Unclear process
documentation
Process does not
meet needs
Poor client involvement
Planning
Closing
MonitoringLaunching
Initiation
Project
failures
over 60%
Figure 7.2 Fishbone diagram of reasons for project failures.
•
Unclear process documentation;
•
Process does not meet needs;
•
Weak change management, faulty acceptance criteria;
•
Faulty acceptance criteria;
•
Poor client involvement.
Keep in mind that there is probably some bias in the project manag
-
ers’ comments. They will tend to defend themselves and point the finger of
blame on something other than their performance. Nevertheless, scope man
-
agement is an area that the task force should investigate further. The data sug
-
gests that both the scope management PD and PP maturity levels were suspect.
Several improvement initiatives in scope management should probably be
commissioned.
7.1.2.2 Human Resources Management
In both the launching and monitoring phases the project managers cited weak
HR processes. In their comments they pointed out that HR did not have a
sound staffing process or plan in place to help with initial project staffing and
with the replacement of team positions that became vacant. Some of the vacan-
cies were the direct result of HR having to move team members from project to
project to accommodate higher priority project staffing needs. These factors
contributed to several delays in completing task assignments according to the
schedule because of the unfilled positions. The teams tried to adapt to the
shortages by juggling team assignments but the level of work was overwhelming
and schedule slippage was inevitable. More study will be needed to determine
what, if anything, can be done to stabilize the staffing situation. It may be that
the suspected staff shortage was real and HR was doing its best to accommodate
the difficult situation. The reasons given by the project managers may not be
accurate.
7.1.2.3 Time and Cost Management
In both the planning and the monitoring phases the project managers expressed
concern over the paucity of planning and reporting documentation. What did
exist was seen as confusing or too labor intensive to be useful to them and so
they often tried to manufacture their own approaches. That clearly was not in
keeping with good project management practice and needed to be further inves
-
tigated by the task force. The project managers may have been right on with
their criticism of the documentation. That could be easily confirmed. Assuming
that documentation was the problem, the project teams would not be appropri
-
ately equipped with tools, templates, and process steps to handle the planning,
146 Project Management Process Improvement
scheduling, and control of the project. Except for heroic efforts, the project was
a high risk for failure.
7.2 PD and PP Maturity Levels for Selected Knowledge Areas
The highest level of interest for process improvement is at the knowledge area
level. Individual programs are undertaken for the purpose of improving the
maturity level of a single knowledge area from among the nine knowledge areas
that define a project management methodology. Several programs can be done
concurrently but the risk is high because too much change might be put upon
project teams than can be reasonably absorbed. If you exceed the capacity of
project teams to accommodate change, the result may be counterproductive.
Project failure rates might increase rather than decrease.
A program will consist of several projects as discussed in the previous sec
-
tion. The combined maturity levels of the processes that make up a knowledge
area define the maturity level of the knowledge area.
The task force felt the need for more specific data on exactly the size and
complexity of the problem they faced and so they asked each of the project man-
agers to complete the scope management, HR management, time management,
and cost management portions of the maturity survey for their projects. These
were the more significant findings from their interviews of the project managers.
Recognizing that there can be some bias in the project managers’ opinions, the
task force wanted to separate the process problems from the practice problems.
The survey would give them the PD and PP data they needed. Figure 7.3 is the
result.
Now the task force could isolate their problem even further. There was a
major gap between the scope management process definition (PD maturity
Case Study: B. Stoveburden Trucking Company 147
HR
Cost
Time
Scope
1
2
3
4
5
PD
base
lin
e
Figure 7.3 Selected knowledge area PD and PP maturity level data.
level) and its practice (PP maturity level). The process definition was at an
acceptable level of maturity but the project managers claimed they could not
understand it. The data seems to support their opinions. Some teams were using
some scope management processes but at a level significantly below the estab
-
lished and documented processes. The reason for that behavior needed further
investigation as well.
Finally, there were deficiencies in the project management process defini
-
tions for time, cost, and HR management. The project teams were performing
consistently up to the level documented in these processes, but that level was not
sufficient for good project performance. The consistent performance is clearly
evident from the small interquartile range for the time, cost, and HR knowledge
areas. Both the PD and PP anomalies had to be corrected.
7.3 Process Level
Now that we have isolated the four knowledge areas that need improvement we
have to drill down into each knowledge area to the process level to further refine
the focus of our improvement initiatives. At this level of detail we should be able
to get at the true causes for project failure. All improvement initiatives are con-
ducted at this level and summarized to the knowledge area level to assure their
overall impact. Individual projects are undertaken for the purpose of improving
the maturity level of a single process from among the processes that define the
knowledge area of interest. This section will target the processes that define the
four knowledge areas that surfaced in the prior section: scope management, HR
management, time management, and cost management. We will discuss what
actually happened in each knowledge area one at a time. In actual practice many
of the process improvement initiatives took place concurrently.
7.3.1 Scope Management Processes
Scope management consists of five processes: initiation, scope planning, scope
definition, scope verification, and scope change control. The survey data from
these five processes is shown in Figure 7.4.
The first observation is that all five processes have large interquartile
ranges. That indicates very different levels of process compliance and perform
-
ance across the teams relative to the PD value of the process. That is due to
either different interpretations of the process documentation or the outright
avoidance of their use. It is highly likely that some teams decided on the
approach they would take to execute a process with little regard for the
process documentation. That behavior is not acceptable even if the process
148 Project Management Process Improvement
documentation is weak, incorrect, or incomplete. If that is the case, the process
documentation must be fixed.
There is another explanation for the data. The process documentation
may be just fine but the implementation program was lacking. Integrating a new
or changed process into an organization is a cultural change. Old habits have to
be discarded and replaced with the new. The affected people must see the value
in choosing to use the new instead of hanging on to the old. That will not hap-
pen just because the new process documentation is published and made avail-
able to teams. It will happen because the PMO puts a very carefully designed
marketing communications program in place and supports it with training at
convenient times and places and in a variety of learning formats. Consulting
help from the PMO is another critical ingredient. They need to proactively sup
-
port teams in the use of the changed processes.
The PD maturity levels of the scope management processes do not indi
-
cate a problem with documentation. However, the distribution of PP maturity
values does indicate a problem. Note that the interquartile range values are large
and extend down from a value close to the PD maturity levels for all but the
scope change control process. Also note that the mean maturity values are close
to the lower end of the interquartile range. That suggests a definite skew in the
distribution of the data points. They tend to collect near the lower end of the
range. That suggests that a few teams correctly understood and used the process
while most did not understand or use the processes. The observations of the
project managers seem to be confirmed. That is, the scope management knowl
-
edge area is not clearly documented. While that may not be the only reason for
Case Study: B. Stoveburden Trucking Company 149
1
2
3
4
5
Scope change control
Scope verification
Scope definition
Scope planning
Initiation
PD baseline
Figure 7.4 Scope management processes PD and PP maturity level data.
the less than stellar performance of these failed projects, it is a valid partial expla
-
nation. If the processes were executed as documented, one would see a much
smaller interquartile range. The absence of that property indicates a problem
with the documentation.
Scope change control presents a different picture. The fact that only one or
two teams followed the documented process suggests that something may be
wrong with the process. Laurie was troubled by that result and requested a force
field analysis. The results are shown in Figure 7.5.
While the process is documented it appears to be incomplete, burden
-
some, and not in line with the needs of the project teams. These would seem to
be easily overcome by an improvement initiative around the documentation,
which should solve the problem. Training is offered but not at a time conven
-
ient to teams. Perhaps something other than instructor-led training needs to be
offered.
Three initiatives were suggested:
1. Revise the current change management process to be more intuitive.
2. Investigate and remove the causes of the overburden assertion.
3. Implement a more proactive PMO consultant support role to project
teams regarding change management and during project reviews.
150 Project Management Process Improvement
Overburdened
by process
Does not
meet needs
No access
to training
Lack of
templates
Scope change
control PP maturity
level values are
below PD values
Effect
Consulting
available
Project
reviews
Scheduled
training
Process
documented
C
auses
Figure 7.5 Force field analysis of the scope change control process.
The first two initiatives were undertaken and are reported below. The
third suggestion did not seem to require an initiative. The PMO was urged to
offer support as suggested. Let us take a look at what happened with the first two
initiatives.
7.3.1.1 Change Management Process
Because of the results of the force field analysis shown in Figure 7.5, Laurie
asked the task force to conduct a root cause analysis of the errors that got into
the client change request process. Figure 7.6 is the result. The conclusions are
obvious. The change control board (CCB) is dysfunctional. It does not meet its
obligation to equitably screen change requests, and it has become a political
entity staffed by managers who apparently lack the skill to do their CCB job
effectively. It has allowed too many change requests, many of which are not cor
-
rectly or clearly defined, to reach the project team. This causes needless work by
the project team and perhaps that is the reason they feel overburdened. This
leads to the conclusion that perhaps the CCB should be disbanded or replaced
by some other structure. The other conclusion is that the client does not respect
the process but uses it with abandon. They must be made to recognize that a
Case Study: B. Stoveburden Trucking Company 151
Change
requests
are free
for the
client
There are
too many
request to
review
s
To keep the
CCB
unbiassed and
resprentative
Board
membership
is limited to
LOB middle
managers
The CCB
members
are not
technically
savvy
The CCB
deals in
political
favors
The CCB
has been
hesistant to
take a hard
line
Why do errors in the
client change request
get past the CCB
Why? Why?
Why?
Why?
Figure 7.6 Root cause analysis of the errors in the client change request form.
change request takes away team member’s time from real project work while
they investigate the consequences and value of the impending change. If there is
too much of that, it may compromise the project schedule and can certainly be a
waste of scarce resources.
One solution is to do away with the CCB and have the client request go
directly to the project manager. The project manager should meet with the cli
-
ent to make sure that the request is clearly and completely documented. The
project manager may reject the request out of hand and communicate the action
and the reason to the client. Alternatively, the project manager may assign one
of the team members the task of conducting a project impact study and the
appropriate action taken as a result. The current change control process is shown
in Figure 7.7.
In this process the CCB is the link between the client and the project man
-
ager. If there are errors in the client request, it would seem that the CCB would
pick them up and get them corrected before submitting the request to the proj
-
ect team for an impact study. This apparently is not happening and erroneous
requests are finding there way to the project team. That requires the team to get
152 Project Management Process Improvement
control boardChange
Board
notifies
PM
Forward
recommendations
to client
Result?
Conduct
impact
study
Project team
Client
notifies
board
Yes
Yes
Forward
request for
impact
study
Review
change
request
Reject
Reject
Client
chooses
action
Notify
client
Notify
client
Change
request
Client
Figure 7.7 Current change management process chart.
clarification from the client. Since the process does not make room for these
clarifications, the communications links get muddied and it causes the project
team to waste time. Clearly, the review procedures used by the CCB need to be
revamped and tightened. When a request for an impact study reaches the project
team, the change request must be complete and correct.
The revised scope change management process is shown in Figure 7.8.
The client needs to be made aware of the impact of a change request on
the project resources. Frivolous requests require the use of a team member to
conduct an investigation and communicate the alternatives. If this is not suffi
-
cient to reduce the number of requests, then the client can be charged for sub
-
mitting change requests. There are several ways to do this that do not destroy a
good and harmonious client relationship. A credit may be established as part of
the project plan. The credit allows for a specific number of change requests
without any payment assessed. After that has been used up, charges will begin
for any future requests. Instead of charging the client for a request, a scope bank
can be established. At the beginning of the project a credit is established in the
scope bank that allows the client a number of prepaid requests. After the credit
Case Study: B. Stoveburden Trucking Company 153
Forward
recommendations
to client
Result?
Conduct
impact
study
Project team
Yes
Yes
Review
change
request
with the
client
Reject
Reject
Project
plan
revised
managerProject
Client
chooses
action
Notify
client
Notify
client
Change
request
Client
Forward
request to a
team member
for
impact
study?
Figure 7.8 A revised change management process chart.
has been used, any further change requests will result in a reprioritization of
existing features and functions and a dropping of the low-end priorities to
accommodate the new request. Both approaches can be effective. The task force
successfully recommended a scope bank with a credit equivalent to 5% of the
total task duration.
7.3.1.2 Overburdening Assertion
To test the teams’ assertions that they are overburdened by the scope change
control process, Laurie reviewed the last 50 situations where there was a change
request that required some added attention by the project team. The data is
shown in Figure 7.9.
The task force was concerned about the results of the Pareto analysis and
decided that the first course of action would be a detailed study of the entire
scope change control process. They hoped that that would expose some weak
-
nesses in the current process and suggest ways to remedy all four of the identi
-
fied causes.
154 Project Management Process Improvement
Problem: The project team is overburdened by the scope change control process
Causes
Cause #4Cause #3Cause #2Cause #1
20
40
60
80
100
10
20
30
40
50
Percentage
Frequency
Cause #1: Client did not complete change request form correctly and project team
must interview them to correct errors.
Cause #2: Client refused to complete the change request form and project team
must interview them to get needed information.
Cause #3: There was confusion as to the correct signing authority, resulting in
needless transmittal and return of request form.
Cause #4: Change request form did not meet all client needs, resulting in confusion
and errors b
y
all
p
arties.
Figure 7.9 Pareto analysis of change requests requiring team attention.
The data shows that the most frequent reason for added attention by the
project team was due to the client filing erroneous change request forms; 60% of
the added work was due to that reason. A brainstorming session was held to
identify possible courses of action. Three ideas surfaced:
1. A more detailed analysis of the specific errors might help in a redesign
of the change request form.
2. Client training in the appropriate use of the change request form
might also be part of the solution.
3. Do away with the form altogether and substitute an interview process
at least for the more significant change requests.
The task force decided that the change request data would be collected
during an interview session with the project manager. That would guarantee a
correctly completed change request form that could now be confidently for-
warded to a team member for analysis. There was no need to change the form or
implement client training.
7.3.2 HR Management Processes
HR management consists of three processes: organizational planning, staff
acquisition, and team development. The survey data from these three processes
is shown in Figure 7.10.
For all intents and purposes it looks like the HR process is not prepared to
support project teams. The PP values fall above the very low PD values for all
three processes. While the teams may have struggled to establish some of their
Case Study: B. Stoveburden Trucking Company 155
Team
development
Staff
acquisition
Organizational
planning
PD
base
lin
e
1
2
3
4
5
Figure 7.10 HR management processes PD and PP maturity level data.
own HR processes, they were relatively unsuccessful. The first improvement ini
-
tiative in the HR knowledge area should be to focus on the process definition
and documentation to move the PD values near 3.0 for all three processes. Once
the necessary changes are in place, the teams should begin to show marked
improvement in their PP maturity levels. If not, then a second wave of improve
-
ment initiatives should focus on the HR management PP maturity levels.
The delays in filling vacancies on the project teams were disconcerting and
needed immediate attention. Because of the staffing problems identified by the
project managers, Laurie requested a root cause analysis to investigate why HR
could not fill team vacancies in a timely fashion. Figure 7.11 is the result of that
analysis.
Two initiatives are suggested by the results:
1. Review the availability report to improve its accuracy.
2. Design and implement a portfolio management process.
7.3.2.1 Availability Report
This initiative uncovered a rather contradictory situation. The project managers
were very slow to report availabilities to HR, hence the reason for the delay in
156 Project Management Process Improvement
Not told
when to
expect a
replacement
Not
authorized
to look
outside
Portfolio
management
not defined
Prioritization
process is
not defined
Poor
reporting
between
HR and the
PMO
HR does
not know
who is
available
Project
priorities
change
frequently
There is a
project
staff
shortage
Why?Why?
Why?
HR has
weak
processes
HR cannot fill project
vacancies in a timely
manner
Figure 7.11 Root cause analysis of project staffing vacancies.
reporting availabilities to the project managers. In other words, the project man
-
agers were the cause of their own problem, which they incorrectly laid at the feet
of the HR department. Apparently, it was not a priority of the project managers
to report those availabilities. In order to raise the visibility of the availability
report, it was assigned to the PMO. They came up with a data entry and report
-
ing system that made the data available in a timely manner. The PMO now had
direct contact with both the contributing project manager and the receiving
project manager and that was the impetus needed to get the new system up and
running without overburdening the project managers.
7.3.2.2 Portfolio Management Process
The best the task force could discover was that portfolio management was just a
step above the “squeaky wheel” stage. There was no repeatable process in place,
and in the face of staff shortages one was needed to help decide where the scarce
resources should be deployed. Designing and implementing a portfolio manage-
ment process required a major effort. Another task force was assembled to
undertake that initiative. The four-person task force was led by the VP of HR.
Laurie and two senior project managers made up the other three members of the
task force.
The first task they undertook was to develop a fishbone diagram of the rea-
sons for staff reallocation. Figure 7.12 is the result of that effort. They reasoned
Case Study: B. Stoveburden Trucking Company 157
Problem: Team members are being reallocated to other
projects and vacancies are not filled in a timely manner.
Causes
Cause #4 Cause #5Cause #3Cause #2Cause #1
20
40
60
80
100
10
20
30
40
50
Percentage
Frequency
Cause #1: Insufficient staff resources to cover approved changes.
Cause #2: We have trouble recruiting and hiring skilled IT staff.
Cause #3: Too much executive pressure to staff their pet projects.
Cause #4: Staff resignations are increasing.
Cause #5: The absentee rate is increasing.
Figure 7.12 Pareto analysis of the reasons for staff reallocation.
that if they could identify why staff had to be reallocated, then that would help
them design of a portfolio management process where the scarce resource was
people not money.
They followed the five phases of the project life cycle.
7.3.3 Time Management
Time management consists of five processes: activity definition, activity sequenc
-
ing, activity duration estimating, schedule development, and schedule control.
The survey data from these five processes is shown in Figure 7.13.
The gap between the PD values and the PP values for the first four
processes indicates that the teams are not using the documentation to its fullest.
The activity definition process shows the largest PD to PP gap. Because the
other processes are dependent on activity definition, there will be problems if
activity definition is not done correctly. Correct and complete activity definition
is what generates an accurate WBS. All time and cost estimates and scheduling is
dependent upon a correct WBS. Without that the project is certain to fail.
The one spurious observation of a PP maturity value at 4.00 was investi-
gated. An industry best practice was uncovered that Laurie felt should be incor-
porated into the activity definition documentation. The manager of that project
was a recent hire and brought a practical “how to” process that he had followed
to construct the WBS, which all but assured the team that the WBS would be
complete. He offered to document the process and make it available to the
PMO for incorporation and general distribution to other project managers. The
same project manager offered his approach to activity sequencing that involved
use of a whiteboard, sticky notes, and marking pens rather than a software tool.
158 Project Management Process Improvement
Activity
duration
estimating
Schedule
development
Schedule
control
Activity
sequencing
Activity
definition
PD
base
lin
e
1
2
3
4
5
Figure 7.13 Time management processes PD and PP maturity level data.
He also agreed to document that process and contribute it to the PMO for gen
-
eral distribution and incorporation in the activity sequencing process
documentation.
There could be several explanations for that behavior and so Laurie
requested that a root cause analysis be conducted in an effort to get to the bot
-
tom of the problem. Figure 7.14 is the result.
The analysis shed a little more light on the problems associated with the
gap between the PD and PP maturity values for the time management knowl
-
edge area.
The root cause analysis confirmed the task force’s decision to proceed with
one initiative. A small working group was appointed to review the activity defi
-
nition process and recommend additions and clarifications.
7.3.4 Cost Management
Cost management consists of five processes: initiation, scope planning, scope
definition, scope verification, and scope change control. The survey data from
these five processes is shown in Figure 7.15.
The cost estimating process is interesting. First, the PD value is lower than
the PP values of most of the failed projects. Obviously, the teams are using their
Case Study: B. Stoveburden Trucking Company 159
Why?
Why?
Why?
No staff
resources
available
for delivery
Teams won’t risk
making a mistake
by using the
confusing process
documentation
No advice
on how to
choose an
approach to
WBS
construction
Too many
alternatives
with no
clear
explanation
of which one
to use
Training is
not
available
Teams
have their
own
approach
Documentation
is confusing and
not complete
Teams do not use the
time management
processes
Figure 7.14 Root cause analysis of the documented time management knowledge area.
own process or have augmented the documented cost estimating process with
features and tasks they believe are needed to complete the process. A root cause
analysis shed more light on the situation. Figure 7.16 is the result of that
analysis.
160 Project Management Process Improvement
1
2
3
4
5
Cost
control
Cost
budgeting
Cost
estimating
Resource
planning
PD
base
lin
e
Figure 7.15 Cost management processes PD and PP maturity level data.
Not
recommended
by cost
estimating
process
Not part of
cost
estimating
process
Late
information
feeds to
PMO from
HR systems
Responsibility
was never
assigned
Not part of
the PMO
function
PMO does not
subscribe to
commercial
cost standards
and factors
databases
No cost
estimating
templates
Billing
rates are
not kept
current
No standard
cost tables
are available
Why?
Why?
Why? Why? Why?
Teams are not using the
cost estimating process
Figure 7.16 Root cause analysis of the cost estimating process.
Three initiatives are suggested by the data:
1. Establish comprehensive cost tables.
2. Establish cost estimating templates.
3. Improve the flow of billing rate information from HR to the PMO.
7.3.4.1 Establish Comprehensive Cost Tables
The PMO was directed to create standard cost tables and a system to collect and
distribute the data to teams for planning and budgeting development. The use
of commercial databases integrated with the homegrown system was encour
-
aged. The PMO also became responsible for maintaining the currency of the
data and responding to requests from the project managers for assistance in the
proper use of the data and in the inclusion of additional data elements to facili
-
tate the project budgeting process.
7.3.4.2 Establish Cost Estimating Templates
A long overdue application was suggested by the PMO for the creation of a
spreadsheet application that would lead a project manager through the entire
process of estimating time and cost. The system would include all the standard
costing data in the tables generated from the above initiative. For the first time
the organization had a repeatable and reliable method for building time and cost
estimates. Under Laurie’s direction the IT department designed and pro-
grammed the application. It was up and running in less than 3 months. No
training was needed as the system prompted the project manager through the
entire process. The teams enthusiastically endorsed the application. It was used
exclusively by project managers beginning the day it was put into production
status.
7.3.4.3 Improve the Flow of Billing Information
As it turns out all three of these initiatives led the task force to the conclusion
that the solution was an integrated application that encompassed cost tables,
estimating templates, and billing information. IT was given the task of design
-
ing such a system. The project was completed nine months later. It has turned
out to be a high maintenance application, and while it provides the required
information, its future is not certain.
7.4 Results of the Improvement Programs
After 3 years and an aggressive sequence of improvement initiatives, the PD and
PP values for the four knowledge areas were as shown in Figure 7.17. To assist
Case Study: B. Stoveburden Trucking Company 161
in the comparison between the before and the after, Figure 7.18 appears as a
repeat of Figure 7.3.
The first thing to note is that the PD values for time management, cost
management, and HR management have been significantly improved. They are
not yet at the targeted maturity levels of 3.0, but they are nearly there. The PP
values have kept pace with the PD increases. Note that all process PP averages
closely match the PD values except for HR management. This suggests that the
implementation and integration of change has been fairly consistent with the
PD changes. Senior management was satisfied with these improvements enough
to commission a second improvement program under Laurie’s leadership and
with the support of the same task force. This time the focus would be on two
separate programs. The first would be on further improvements in the PP values
162 Project Management Process Improvement
1
2
3
4
5
PD
base
lin
e
HR
Cost
Time
Scope
Figure 7.17 Do not overburden project managers and teams with too many process
changes at one time.
1
2
3
4
5
PD
base
lin
e
HR
Cost
Time
Scope
Figure 7.18 PD and PP maturity levels 3 years ago.
for scope management, time management, and cost management. The second
would be on the PD and PP values for HR management.
The original goal of the improvement program was to reduce project fail
-
ures from 60% to 30% in the 3-year period. The actual failure rate moved from
60% 3 years ago to its present level of 42%. Senior management was pleased
with that improvement. Although it did not meet their expectations, they were
encouraged by the improvement and felt that the second improvement program
would result in a 30% or better project failure rate.
7.5 Points to Remember
The following is a list of important points to remember from this chapter:
•
Improvement initiatives are exploratory and may be not much better
than educated guesses.
•
Process changes are also cultural changes.
•
Don’t overburden project managers and teams with too many process
changes at one time.
Case Study: B. Stoveburden Trucking Company 163