Tài liệu Báo cáo "Proper orthogonal decomposition and recent advanced topics in wind engineering" pptx
Bạn đang xem bản rút gọn của tài liệu. Xem và tải ngay bản đầy đủ của tài liệu tại đây (1.03 MB, 18 trang )
VNU Journal of Science, Mathematics - Physics 25 (2009) 21-38
21
Proper orthogonal decomposition and recent advanced topics
in wind engineering
Le Thai Hoa
*
College of Technology, Vietnam National University, Hanoi
144 Xuan Thuy, Cau Giay, Hanoi, Vietnam
Received 30 July 2008; received in revised form 28 December 2008
Abstract. Proper Orthogonal Decomposition and its Proper Transformations has been applied
widely in many engineering topics including the wind engineering recently due to its advantage of
optimum approximation of multi-variate random fields using the modal decomposition and limited
number of dominantly orthogonal eigenvectors. This paper will present fundamentals of the Proper
Orthogonal Decomposition and its Proper Transformations in both the time domain and the
frequency domain based on both covariances matrix and cross spectral matrix branches. Moreover,
the most recent topics and applications of the Proper Orthogonal Decomposition and its Proper
Transformation in the wind engineering will be emphasized and discussed in this paper as follows:
(1) Analysis and synthesis, identification of the multi-variate dynamic pressure fields; (2) Digital
simulation of the multi-variate random turbulent wind fields and (3) Stochastic response prediction
of structures due to the turbulent wind flows. All applications of the Proper Orthogonal
Decomposition and its Proper Transformations will be investigated under numerical examples,
especially will be formulated in both time domain and the frequency domain.
Keywords: Proper Orthogonal Decomposition, Proper Transformation, wind engineering, unsteady
pressure fields, turbulence simulation, stochastic response.
1. Introduction
Proper Orthogonal Decomposition (POD), also known as Karhunen-Loeve Decomposition [1,2],
has been applied in many engineering fields such as the random fields, the stochastic methods, the
image processing, the data compression, the system identification and control and so on [3-5]. In the
wind engineering, the POD has been used in the most recent topics as follows: i) Stochastic
decomposition and order-reduced modeling of multi-variate random fields (turbulent wind, pressures
and forces) [6-10]; ii) Representation and simulation of multi-variate random turbulent wind fields
[11-14] and iii) Stochastic response prediction of structures in the turbulent wind fields [15-18]. The
POD has been applied to optimally approximate the multi-variate random fields through use of low-
order orthogonal vectors from modal decomposition of either zero-time-lag covariance matrix or cross
spectral density one of this multi-variate random field. According to type of basic matrix in the modal
______
*
Tel.: 84-4-3754.9667
E-mail:
L.T. Hoa / VNU Journal of Science, Mathematics - Physics 25 (2009) 21-38
22
decomposition, the POD has been branched by either the Covariance Proper Transformation or the
Spectral Proper Transformation. Main advantage of the POD is that the multi-variate random fields
can be decomposed and described in such simplified way as a combination of a few low-order
dominant eigenvectors (modes) and omitting higher-order ones that is convenient for order-reduced
representation of the random fields, random force modeling and stochastic response prediction.
Up to now, the covariance matrix-branched POD and its transformation have been applied
favorably for analysis and synthesis of the random field, especially of dynamic surface pressure field
around low-rise and tall buildings as well as bridge girders [6-10] due to its straightforward in
computation and interpretation. Because low-order modes contribute dominantly to total energy of the
random fields and their energy proportions reduce very fast with respect to an increase of mode order,
thus it is reasonable to thing that these low-order modes can represent and interpret to any physical
cause occurring on physical models. Some authors used the POD to analyze random pressure field and
to find out relation between pressure field-based covariance modes and physical causes, however,
discussed that in many cases that consistent linkage between dominant covariance modes and physical
causes may be fictitious [6,7,10]. Many effects such as number of pressure positions, pressure position
arrangement, and presence of mean pressure values and so on can influence sensitively to resulting
covariance modes [10]. Spectral matrix-based application to decompose the random field is rare due to
its complexities in computation and interpretation, but it is promising due to its complete decoupling
solution at every frequency, consequently decoupling in the time domain including zero-time-lag
condition. De Grenet and Ricciardelli [19] discussed in using the Spectral Proper Transformation to
study the fluctuating pressure fields around squared cylinder and boxed girder.
Representation and simulation of the multi-variate random turbulent fields surrounding structures
is required for evaluating the induced forces and the random response of structures due to the turbulent
winds in the time domain. Spectral representation methods basing on the cross spectral density matrix
have been applied almost so far due to availability of the auto power spectral densities of turbulent
components. These simulation methods, moreover, depend on decomposition techniques of this cross
spectral density matrix through either the Cholesky’s decomposition [20,21] or the modal
decomposition [11-14]. In the former, the cross spectral density matrix is decomposed by product of
two lower and upper triangular matrices, whereas the modal decomposition uses spectral eigenvectors
(spectral modes) and spectral eigenvalues obtained from the spectral matrix-branched POD in the
later. Main advantage of using the Spectral Proper Transformation in simulating the multi-variate
random turbulent wind field is that only little number of the low-order dominant spectral modes and
associated spectral eigenvalues is accuracy enough for whole simulating process. Moreover, the low-
order spectral modes and spectral eigenvalues also contain their physical significance of the multi-
variate random turbulent wind field.
Random response prediction of structures due to the turbulent wind forces usually burdens a lot of
computational difficulties due to projection of the full-scale induced forces on generalized structural
coordinates. As a principle, the multi-degree-of-freedom motion equations of structures are decoupled
into the generalized coordinates and the structural modes due to the structural modal transformation.
Conventional methods of the gust response prediction of structures has used concept of the Joint
Acceptance Function to decompose the full-scale turbulent-induced forces, then to be associated with
the generalized structural coordinates. New approach of the random response prediction of structures
due to the turbulent wind flows has been proposed recently with concept of the Double Modal
Transformations, in which the structural modes are associated with turbulent-induced loading modes
that are decomposed by the Proper Transformations in order to determine the random response of
structures. The Spectral Proper Transformation has been applied for the response prediction in the
frequency domain of simple frame [15], buildings [16], bridges [17], especially, its application of the
L.T. Hoa / VNU Journal of Science, Mathematics - Physics 25 (2009) 21-38
23
Covariance Proper Transformation for the random response of bridges has discussed by Le and
Nguyen [14,18].
This paper aims to present fundamentals of the POD, its Proper Transformations in both the
covariance and spectral matrix branches with emphasis on recent advanced topics in the wind
engineering: (1) Analyzing, identifying and reconstructing the random surface pressure fields around
some typical rectangular cylinders, moreover, important role of the first mode including relationship
with physical phenomena; (2) Simulating the multi-variate spatially-correlated random turbulent field
with effect of the spectral modes; (3) Predicting the stochastic response of structures in the frequency
domain and in the time domain. These applications will be presented with examples and discussions.
2. Proper orthogonal decomposition and its proper transformations
2.1. Proper orthogonal decomposition
The Proper Orthogonal Decomposition is considered as optimum approximation of the multi-
variate random field in which a set of orthogonal basic vectors is found out in order to expand the
random process into a sum of products of these time-independent basic orthogonal vectors and time-
dependant uncorrelated random processes. Let consider the multi-variate correlated random process at
N-node field containing correlated N-subprocesses
{
}
T
N
tttt )(), ,(),()(
21
υυυυ
=
is approximated as:
∑
=
=Θ=
N
i
ii
T
txtxt
1
)()()(
θυ
(1)
where
)(tx
: time-dependant uncorrelated random process (also called as principal coordinates)
{
}
T
N
txtxtxtx )(), ,(),()(
21
=
;
Θ
: time-independent orthogonal modal matrix
[
]
T
N
θθθ
, ,,
21
=Θ
.
Mathematical expression of optimality is to find out the orthogonal modal matrix in order to
maximize the projection of the multi-variate correlated random process onto this modal matrix,
normalized due to the mean square basis [1,2]:
2
2
|))((|
Θ
Θ⊗t
Max
υ
(2)
where
(
)
⊗
,
.
,
.
,
.
denote to inner product, expectation, absolute and Euclidean squared norm
operators, respectively.
Optimum approximation of the random process in Eq.(1) using the shape function matrix defined
in Eq.(2) is known as the Karhunen-Loeve decomposition. It is proved that the shape function matrix
in this optimality can be found out as eigenvector solution of eigen problem from basic matrix that are
either zero-time-lag covariance matrix or cross spectral density matrix formed by the multi-variate
correlated random process. It is also notable that eigenvalues gained from this eigen solution usually
reduce fast, accordingly, only very few number of low-order eigenvectors associated with low-order
high eigenvalues can obtain the optimum approximation and simplified description of the random
fields.
2.2. Matrix representation of multi-variate random fields
Zero-time-lag covariance matrix and cross power spectrum density matrix are commonly used to
L.T. Hoa / VNU Journal of Science, Mathematics - Physics 25 (2009) 21-38
24
characterize for the multi-variate correlated random process in the time domain and in the frequency
one, which are determined as follows:
==
)0()0()0(
)0()0()0(
)0()0()0(
)]0([
21
22212
12111
NNNN
N
N
lk
RRR
RRR
RRR
RR
υυυυυυ
υυυυυυ
υυυυυυ
υυυ
L
MLMM
L
L
;
==
)()()(
)()()(
)()()(
)]([
21
22212
12111
nSnSnS
nSnSnS
nSnSnS
nSS
NNNN
N
N
lk
υυυυυυ
υυυυυυ
υυυυυυ
υυυ
L
MLMM
L
L
(3)
where
υυ
SR ,
: zero-time-lag covariance and cross spectral matrices, respectively;
)(),0( nSR
lklk
υυυυ
:
elements of the covariance matrix and the cross power spectral one between
)(t
k
υ
and
)(t
l
υ
at nodes k,
l, are determined as follows:
)]()([)0( ttER
T
lk
lk
υυ
υυ
=
;
),()()()(
kl
nCOHnSnSnS
lkllkklk
∆=
υυυυυυυυ
(4)
where E[],T denote to the expectation and transpose operators; n: frequency variable;
)(),( nSnS
llkk
υυυυ
:
auto power spectral densities of
)(t
k
υ
and
)(t
l
υ
;
),(
kl
nCOH
lk
∆
υυ
: coherence function between two
separated nodes k, l accounting for spatial correlation of the random sub-processes in the frequency
domain which can be determined by either empirical model or physical measurement.
It is noted that the zero-time-lag covariance matrix is symmetric, real and positive definite,
whereas the cross spectral one is symmetric, real (because the quadrature spectrum has been
neglected) and Hermittian semi-positive definite at each frequency.
2.3. Covariance proper transformation
The covariance matrix-based orthogonal vectors are found as the eigenvector solution of the eigen
problem of the zero-time-lag covariance matrix
)0(
υ
R
of the N-variate correlated random process
)(t
υ
:
υυυυ
ΘΓ=ΘR
(5)
where
Θ
Γ
,
υ
: covariance matrix-based eigenvalue and eigenvector matrices
), ,(
21 N
diag
υυυυ
γ
γ
γ
=
Γ
,
], ,[
21 N
υυυυ
θ
θ
θ
=
Θ
, respectively. Due to symmetric, real, positive-definite covariance matrix, thus the
covariance eigenvalues are real and positive, and the covariance eigenvectors (also called as
covariance modes) are also real, satisfy the orthogonal conditions:
υυυυυυ
Γ=ΘΘ=ΘΘ
TT
RI;
(6)
Then, the multi-variate correlated random process and its covariance matrix can be reconstructed
approximately using j-order truncated number of low-order eigenvalues, eigenvectors as follows:
)()()(
~
1
txtxt
jj
N
j
υυυυ
θυ
∑
=
≈Θ=
;
T
N
j
T
jjj
R
υυυυυυυ
θγθ
∑
=
≈ΘΓΘ=
~
1
(7)
where
T
N
xtxtxtx },), (),({)(
21
υυυυ
=
: low-order covariance principal coordinates as uncorrelated
random subprocesses;
N
~
: number of truncated covariance modes (
NN <<
~
). Expressions in Eq.(7) is
also known as the Covariance Proper Transformation.
Covariance principal coordinates can be determined from observed data as follows:
∑
=
−
=Θ=Θ=
N
j
j
j
ttttx
1
1
)()()()(
υυυυ
θυυυ
(8)
If the random field contains the zero-mean subprocesses, furthermore, the covariance principal
coordinates also are zero-mean uncorrelated random subprocesses, satisfy some characteristics:
L.T. Hoa / VNU Journal of Science, Mathematics - Physics 25 (2009) 21-38
25
[
]
[
]
kl
T
klkk
txtxEtxE
δγ
υυυυ
== )()(;0)(
(9)
Where
kl
δ
: Kronecker delta.
2.4. Spectral proper transformation
The spectral matrix-based orthogonal vectors are found as eigenvector solution of the eigen
problem from the cross spectral density matrix
)(nS
υ
of the N-variate correlated random process
)(t
υ
:
)()()()( nnnnS
υυυυ
ΨΛ=Ψ
(10)
where
)(),( nn
υυ
Ψ
Λ
: spectral eigenvalue and eigenvector matrices
))(), (),(()(
21
nnndiagn
N
υυυυ
λ
λ
λ
=
Λ
,
)](), (),([)(
21
nnnn
N
υυυυ
ψ
ψ
ψ
=
Ψ
, respectively. It is noted that the spectral eigenvalues are real and
positive, whereas the spectral eigenvectors (spectral modes) are generally complex, however, if the
cross spectral matrix is real then spectral modes are also real ones. The spectral eigenvalues and the
spectral modes satisfy such orthogonal conditions as follows:
)()()()(;)()(
**
nnnSnInn
TT
υυυυυυ
Λ=ΨΨ=ΨΨ
(11)
Accordingly, the Fourier transform and the cross spectral density matrix of random process
)(t
υ
can be represented approximately due to terms of the spectral eigenvalues and eigenvectors as follows:
)(
ˆ
)()(
ˆ
)()(
ˆ
ˆ
1
nynnynn
jj
N
j
υυυυ
ψυ
∑
=
≈Ψ=
;
)()()()()()()(
*
ˆ
1
*
nnnnnnnS
T
N
j
T
jjj
υυυυυυυ
ψλψ
∑
=
≈ΨΛΨ=
(12)
where
)(
ˆ
n
υ
: Fourier transform of the random process
)(t
υ
;
)(
ˆ
ny
υ
: spectral principal coordinates as
Fourier transform of uncorrelated random subprocesses
T
N
ytytyty },), (),({)(
21
υυυυ
=
;
N
ˆ
: number of
truncated spectral modes (
NN <<
ˆ
); * denotes to complex conjugate operator. Frequency-domain
optimum approximation in Eq.(13) is also known as the Spectral Proper Transformation.
The spectral principal coordinates have some characteristics as follows:
[
]
kl
T
nnynyE
klk
δλ
υυυ
)()(
ˆ
)(
ˆ
=
(13)
3. Analysis and synthesis, identification of multi-variate dynamic pressure fields
In this application, multi-variate dynamic pressure field around some rectangular sections have
been analyzed in the time domain and the frequency one using both the Covariance and Spectral
Proper Transformations. Next, synthesis and identification of these originally pressure fields using few
low-order covariance and spectral modes as well as linkage between these low-order modes and
physical phenomena on the rectangular sections have been discussed. The dynamic pressure data have
been directly measured in the wind tunnel.
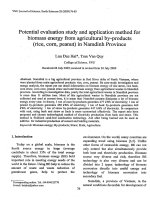
3.1. Wind tunnel measurements of dynamic pressure
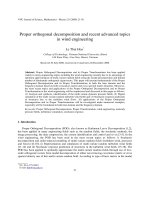
Pressure measurements have been carried out on three typical rectangular models with side ratios
B/D=1, B/D=1 with splitter plate and B/D=5 in the wind tunnel. Pressure taps are arranged in
chordwise directions labeled from position 1 to position 10 (model B/D=1) and from position 1 to
position 19 (model B/D=5) (see Figure 1). Artificial turbulent flows are generated by grid device at
mean wind velocities 3m/s, 6m/s and 9m/s corresponding to intensities of turbulence as I
u
=11.46%,
L.T. Hoa / VNU Journal of Science, Mathematics - Physics 25 (2009) 21-38
26
I
w
=11.23%; I
u
=10.54%, I
w
=9.28% and I
u
=9.52%, I
w
=6.65%, respectively. Dynamic surface pressures
are simultaneously measured by the multi-channel pressure measurement system (ZOC23, Ohte
Giken, Inc.), then discretized by A/D converter (Thinknet DF3422, Pavec Co., Ltd.) with sampling
frequency at 1000Hz in 100 seconds. Normalized mean pressures and normalized root-mean-square
fluctuating pressures can be determined from measured unsteady pressures as follows:
(
)
2
)(
)(
,
5.0 UpC
i
i
meanp
ρ
=
;
(
)
2)()(
,
5.0 UC
i
p
i
rmsp
ρσ
=
(14)
where i: index of pressure positions;
2
5.0 U
ρ
: dynamic pressure;
p
,
p
σ
: mean value, standard
deviation of unsteady pressure, respectively.
Fig 1. Experimental models and pressure tap layouts.
It is previously clarified about bluff-body flow pattern around these sections that in the model
B/D=1 it is favorable condition for the Karman vortices occur frequently at the wake of model; these
Karman vortices are suppressed thanks to presence of splitter plate, whereas the bluff-body flow
exhibits complex presence of separation bubble, reattachment, vortex shedding in the B/D=5 model.
3.2. Covariance proper transformation-based analysis
Eigenvalues and eigenvectors have been determined due to the eigen solution from the covariance
matrix of the dynamic pressure fields. Energy contribution of the first covariance modes contribute
respectively 76.92%, 65.29%, 43.77% to total energy of the system corresponding to models B/D=1
with the splitter plate, B/D=1 without the splitter plate and model B/D=5. Then, the covariance
principal coordinates are computed using measured pressure data.
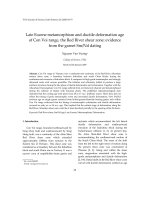
Fig. 2. First four principal coordinates (I
u
=11.46%, I
w
=11.23%).
po1
…
po1
Wind
po1
…
po1
Wind
Splitter Plate (S.P)
B/D=1
B/D=1 with S.P
B/D=5
Wind
po1
…
po1
0 5 10
-20
-10
0
10
20
Time (s)
Coordinate 1
0 5 10
-20
-10
0
10
20
Time (s)
Coordinate 2
0 5 10
-20
-10
0
10
20
Time (s)
Coordinate 3
0 5 10
-20
-10
0
10
20
Time (s)
Coordinate 4
0 5 10
-10
-5
0
5
10
Time (s)
Coordinate 1
0 5 10
-10
-5
0
5
10
Time (s)
Coordinate 2
0 5 10
-10
-5
0
5
10
Time (s)
Coordinate 3
0 5 10
-10
-5
0
5
10
Time (s)
Coordinate 4
0 5 10
-10
-5
0
5
10
Time (s)
Coordinate 1
0 5 10
-10
-5
0
5
10
Time (s)
Coordinate 2
0 5 10
-10
-5
0
5
10
Time (s)
Coordinate 3
0 5 10
-10
-5
0
5
10
Time (s)
Coordinate 4
B/D=1 B/D=1 with S.P B/D=5
L.T. Hoa / VNU Journal of Science, Mathematics - Physics 25 (2009) 21-38
27
Figure 2 shows first four uncorrelated principal coordinates of the three models associated with the
covariance modes, whereas Figure 3 indicates power spectral densities of their corresponding principal
coordinates. It is noteworthy that first coordinates not only dominate in the power spectrum but
contain frequency characteristics of the random pressure field, whereas the other coordinates do not
contain these frequencies.
Fig. 3. Power spectra of first four principal coordinates (I
u
=11.46%, I
w
=11.23%).
Thus, it is discussed that the first covariance modes and associated principal coordinate play very
important role in the identification and order-reduced reconstruction of the random pressure field due
to their dominant energy contribution and frequency containing of physical phenomena.
3.3. Spectral proper transformation-based analysis
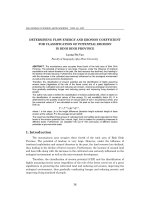
Spectral eigenvalues and eigenvectors have been obtained from the cross spectral matrix of the
observed fluctuating pressure field. Figure 4 shows first five spectral eigenvalues on frequency band
0÷50Hz at the flow case 1. As seen that all first spectral eigenvalues from three models exhibit much
dominantly than the other, especially theses first eigenvalues also contain characteristic frequency
peaks of the pressure fields, whereas the other does not hold theses peaks. The first three spectral
modes (eigenvectors) of the fluctuating pressure fields of the three models in the flow case 1 are
shown in Figure 5.
Fig. 4. First five spectral eigenvalues of experimental models (I
u
=11.46%, I
w
=11.23%).
10
-1
10
0
10
1
10
2
10
-5
10
-4
10
-3
10
-2
10
-1
10
0
10
1
Frequency (Hz)
Spectral eigenvalues
λ
1
λ
2
λ
3
λ
4
λ
5
10
-1
10
0
10
1
10
2
10
-5
10
-4
10
-3
10
-2
10
-1
10
0
10
1
Frequency (Hz)
Spectral eigenvalues
λ
1
λ
2
λ
3
λ
4
λ
5
10
-1
10
0
10
1
10
2
10
-4
10
-3
10
-2
10
-1
10
0
10
1
Frequency (Hz)
Spectral eigenvalues
λ
1
λ
2
λ
3
λ
4
λ
5
B/D=1 B/D=1 with S.P B/D=5
10
-1
10
0
10
1
10
2
10
-6
10
-5
10
-4
10
-3
10
-2
10
-1
10
0
10
1
Frequency (Hz)
P S D
coordinate 1
coordinate 2
coordinate 3
coordinate 4
10
-1
10
0
10
1
10
2
10
-6
10
-5
10
-4
10
-3
10
-2
10
-1
10
0
10
1
Frequency (Hz)
P SD
Principal coordinates
coordinate 1
coordinate 2
coordinate 3
coordinate 4
10
-1
10
0
10
1
10
2
10
-6
10
-5
10
-4
10
-3
10
-2
10
-1
10
0
10
1
Frequency (Hz)
P S D
coordinate 1
coordinate 2
coordinate 3
coordinate 4
4.15Hz 1.22Hz
1.22H
z
2.44H
z
L.T. Hoa / VNU Journal of Science, Mathematics - Physics 25 (2009) 21-38
28
Fig. 5. First three spectral modes of experimental models (I
u
=11.46%, I
w
=11.23%).
Energy contributions of the spectral modes are estimated with cut-off frequency 50Hz. Similar to
the covariance modes, the first spectral modes contain dominantly the system energy, for example, the
first mode contribute 86.04%, 81.30%, 74.77%, respectively on total energy (I
u
=11.46%, I
w
=11.23%).
In comparison with the covariance modes, it clearly observed that the first spectral modes are better
solution than the first covariance one due to higher energy contribution.
It is argued that the first spectral mode and associated spectral eigenvalue play very important role
in the identification and order-reduced reconstruction of the observed pressure fields due to their
dominance in the energy contribution and containing of characteristic frequencies of the physical
phenomena.
4. Digital simulation of multi-variate random turbulent wind field
4.1. Spectral representation method
Digital simulation of the multi-variate random turbulent wind fields using the Spectral
Representation Method is widely used so far and will be presented here, in which the cross spectral
matrix is decomposed by the Proper Spectral Transformation. Accordingly, the N-variate random
turbulent process
{
}
T
N
tttt )(), ,(),()(
21
υυυυ
=
can be represented [11-14]:
∫
∞
∞−
= )()2exp()( ndBntit
υ
πυ
(15)
where
{
}
)(), ,(),()(
21
nBnBnBnB
N
υυυυ
=
: mean-zero uncorrelated orthogonal increment process
satisfying as
[
]
0)( =ndBE
i
υ
,
*
)()( ndBndB
ii
υυ
=
,
[
]
dnnSndBndBE
mkij
T
km
ji
)()()(
*
υυυ
δδ
=
;
)(nS
υ
: cross
spectral matrix.
Using the Spectral Proper Transformation to decompose and approximate the cross spectral
matrix
)()()()()()()()(
*
ˆ
1
*
1
nnnnnnnSnS
T
N
j
T
N
j
Y
jjjj
υυυυυυυ
ψλψ
∑∑
==
≈ΨΛΨ==
, the multi-variate random
turbulent process can be decomposed and approximated by
N
ˆ
summation of N-variate independent
orthogonal processes:
B/D=5 B/D=1 B/D=1 with S.P
L.T. Hoa / VNU Journal of Science, Mathematics - Physics 25 (2009) 21-38
29
∑ ∑
∫
= =
∞
∞−
==
N
j
N
j
dnntinntYt
jjj
ˆ
1
ˆ
1
)2exp()()()()(
πλψυ
υυυ
(16)
Subprocesses of the N-variate random turbulent process
)(t
υ
can be simulated in the discrete
frequency domain as:
llll
N
l
N
j
i
ntninnt
jj
∆=
∑∑
==
)2exp()()(2)(
1
ˆ
1
πλψυ
υυ
(17)
where i: index of simulated subprocess; j: index of spectral modes; l: index of frequency points;
l
n
:
frequency value at moving point l;
:N
number of frequency intervals;
l
n
: frequency interval at point l.
If the frequency domain is discretized constantly at every frequency interval
n
∆
, then the Eq.(17)
can be expanded:
∑∑
==
++∆=
N
l
lllll
N
j
i
ntnnnnt
jjj
1
ˆ
1
))(2cos()()(2)(
φθπλψυ
υυυ
(18)
where
l
n
∆
: frequency interval at point l;
n
∆
: constantly frequency interval
Nnn
up
/=∆
and
nln
l
∆
−
=
)1(
,
up
n
: upper cut-off frequency;
)(
l
n
j
υ
θ
: phase angle of complex eigenvector
))(exp(|)(|)(
lll
ninn
jjj
υυυ
θ
ψ
ψ
=
, determined as
(
)
))(Re(/))(Im(tan)(
1
lll
nnn
jjj
υυυ
ψψθ
−
=
;
l
φ
: phase
angle considered as random variable uniformly distributed over [0,2π].
In many cases, the spectral eigenvectors are real due to auto spectral densities are real and positive,
Eq.(18) can be simplified as follows:
∑∑
==
+∆=
N
l
llll
N
j
i
tnnnnt
jj
1
ˆ
1
)2cos()()(2)(
φπλψυ
υυ
(19)
The phase angles can be randomly generated using the Monte Carlo technique.
4.2. Numerical example and discussions
The spectral proper transformation has been applied to simulate the two multi-variate correlated
random turbulent processes at 30 discrete nodes along a bridge deck:
{
}
T
tutututu )(), ,(),()(
3021
=
&
{
}
T
twtwtwtw )(), ,(),()(
3021
=
. Sampling rate of simulated turbulent time series is 1000Hz for total time
interval 100 seconds. The cross spectral density matrices of u-, w-turbulences have been formulated
based on auto spectral densities and spanwise coherence function. Targeted auto power spectral
densities of u-, w-components are used the Kaimail’s and Panofsky’s models as well as the coherence
function between two separated nodes along bridge deck used by exponentially empirical model [22]:
( )
3/5
2
*
501
200
)(
fn
fu
nS
uu
+
=
,
( )
3/5
2
*
101
36.3
)(
fn
uf
nS
ww
+
=
(20a)
+
−
−=∆
)(5.0
||
exp),(
lk
lk
kl
UU
yync
nCOH
lk
υ
υυ
(20b)
where f: non-dimensional coordinates; u
*
: friction velocity;
lk
UU ,
: mean velocities at two separated
nodes k, l; c
υ
: decay factor,
5.6,10
=
=
wu
cc
[16];
||
lkkl
yy
−
=
∆
: distance between two nodes; y
k
, y
l
:
longitudinal coordinates.
L.T. Hoa / VNU Journal of Science, Mathematics - Physics 25 (2009) 21-38
30
Cross spectral matrices
)(nS
u
,
)(nS
w
of two random turbulent processes u(t), w(t) at the 30 structural
deck nodes have been formulated. Spectral matrix-based analysis has been carried out to find out pairs
of the spectral eigenvectors (also called spectral turbulent modes) and associated spectral eigenvalues.
Figure 6 shows the first five spectral eigenvalues
)()(
51
nn
λλ
÷
on frequency band 0.01÷10Hz. It is
observed that the first spectral eigenvalue
)(
1
n
λ
exhibits much higher than the others on the very low
frequency band 0.01÷0.2Hz with the u-turbulence, 0.01÷0.5Hz with the w-turbulence, however, all
spectral eigenvalues not to differ beyond these frequency thresholds. This implies that only first pair of
the spectral eigenvalue and the spectral eigenvector seems to be enough for representing and
simulating the whole turbulent fields at the very low frequency bands, however, many more pairs are
required at higher frequency bands.
Fig. 6. First five spectral eigenvalues: a. u-turbulence, b. w-turbulence.
Fig. 7. First three spectral turbulent modes: a. u-turbulence, b. w-turbulence.
10
-2
10
-1
10
0
10
1
0
500
1000
1500
2000
2500
3000
Frequency n(Hz)
Eigenvalue of S
u
(n)
λ
1
λ
2
λ
3
λ
4
λ
5
10
-2
10
-1
10
0
10
1
0
10
20
30
40
50
60
70
80
Frequency n(Hz)
Eigenvalue of S
w
(n)
λ
1
λ
2
λ
3
λ
4
λ
5
a. u
-
turbulence
b. w
-
turbulence
mode 1 mode 2 mode 3
mode 1
mode 2 mode 3
a. u- turbulence
b. w- turbulence
L.T. Hoa / VNU Journal of Science, Mathematics - Physics 25 (2009) 21-38
31
The first three spectral turbulent modes
wunnn ,);(),(),(
321
=
υψψψ
υυυ
on the same spectral band
0÷10Hz is expressed in Figure 7. It can be seen from Figure 7 that the turbulent modes of u-,w-
components look like as symmetrically and asymmetrically sinusoidal waves, in which number of
wave halves increases incrementally with the order of eigenvectors.
Fig. 8. Simulated time series in nodes 5&15: a. U=20m/s , b. U=30m/s.
Figure 8 shows simulated time series of two turbulent subprocesses at representative nodes 5
& 15 during 100-second interval at mean wind velocities 20m/s and 30m/s, respectively. Simulating
time series of the random turbulent wind fields acting on discrete deck nodes are going to be used as
input data to predict the random response of structure in the time domain in next application.
5. Random response prediction of structures in turbulence wind field
5.1. Structural modal transformation and turbulent-induced forces
Multi-degree-of-freedom motion equation of structures immersed in the atmospheric turbulent
flow subjected to the turbulent-induced forces is expressed:
)()()()( tFtKUtUCtUM
b
=++
&&&
(21)
where M, C, K: globally mass, damping and stiffness matrices, respectively; UUU
&&&
,, : deflection
vector and its derivative vectors; F
b
(t): turbulent-induced forces.
Transforming into generalized coordinates normalized by the mass matrix using
M
truncated low-
order structural modes (
M
M
<<
, M: number of dynamic degree-of-freedom of structure), it satisfies:
∑
=
≈Φ=
M
i
ii
tttU
1
)()()(
ξφξ
;
I
M
T
=
Φ
Φ
;
Ξ=ΦΦ C
T
;
Ω
=
Φ
Φ
K
T
(22)
where
ξ
: generalized coordinate vector
{
}
T
M
tttt )(,), (),()(
21
ξξξξ
=
;
Φ
: modal matrix
[
]
M
φ
φ
φ
,, ,
21
=
Φ
; I: unit matrix;
Ξ
: diagonal damping matrix;
Ω
: diagonal stiffness matrix
containing squared natural frequencies
), ,,(
22
2
2
1 M
diag
ωωω
=Ω
.
10 20 30 40 50 60 70 80 90 100
-10
-5
0
5
10
Amplitude (m/s)
Node 5: u(t)
10 20 30 40 50 60 70 80 90 100
-10
-5
0
5
10
Amplitude (m/s)
Node 15: u(t)
10 20 30 40 50 60 70 80 90 100
-10
-5
0
5
10
Time (sec.)
Amplitude (m/s)
Node 5: w(t)
10 20 30 40 50 60 70 80 90 100
-10
-5
0
5
10
Time (sec.)
Amplitude (m/s)
Node 15: w(t)
U=20m/s; std=2.94; I
u
=14.7%
U=20m/s; std=2.98; I
u
=14.91%
U=20m/s; std=1.64; I
w
=8.21% U=20m/s; std=1.59; I
w
=7.95%
10 20 30 40 50 60 70 80 90 100
-20
-10
0
10
20
Amplitude (m/s)
Node 5: u(t)
10 20 30 40 50 60 70 80 90 100
-20
-10
0
10
20
Amplitude (m/s)
Node 15: u(t)
10 20 30 40 50 60 70 80 90 100
-10
-5
0
5
10
Time (sec.)
Amplitude (m/s)
Node 5: w(t)
10 20 30 40 50 60 70 80 90 100
-10
-5
0
5
10
Time (sec.)
Amplitude (m/s)
Node 15: w(t)
U=30m/s; std=4.31; I
u
=21.57%
U=30m/s; std=4.15; I
u
=20.75%
U=30m/s; std=2.39; I
w
=11.97% U=30m /s; std=2.39; I
w
=11.93%
a
. U=20m/s
b. U=30m/s
L.T. Hoa / VNU Journal of Science, Mathematics - Physics 25 (2009) 21-38
32
Thus, single-degree-of-freedom motion equation in the i-th generalized coordinate excited by
generalized turbulent-induced forces can be obtained:
)()()(2)(
2
tFttt
b
T
iiiiiii
φξωξωζξ
=++
&&&
(23)
where
ii
ζω
,
: circular frequency and damping ratio, respectively.
Turbulent-induced forces lumped at discrete structural nodes are generated by laterally and
vertically turbulent fluctuations u(t), w(t) which are considered as N-variate correlated random
processes (N: number of structural nodes) as follows, see Figure 9:
T
N
tutututu )}(,), (),({)(
21
=
;
T
N
twtwtwtw )}(,), (),({)(
21
=
(24)
Fig. 9. Turbulent loading processes. Fig. 10. Turbulent-induced forces on section.
The uniform turbulent-induced forces are modeled due to quasi-steady theory corrected by
frequency-dependant admittance functions as follows [22], see Figure 10:
]
)(
)()(
)(2
)([
2
1
)(
'2
U
tw
nCC
U
tu
nCBUtL
LwDLLuLb
χχρ
++=
(25a)
]
)(
)()(
)(2
)([
2
1
)(
'2
U
tw
nCC
U
tu
nCBUtD
DwLDDuDb
χχρ
−+=
(25b)
]
)(
)(
)(2
)([
2
1
)(
'22
U
tw
nC
U
tu
nCBUtM
MwMMuMb
χχρ
+=
(25c)
where
MDL
CCC ,,
: aerodynamic coefficients at balanced angle of attack;
'''
,,
MDL
CCC
: first-order
derivatives with respect to angle of attack;
ρ
,B: air density and deck width;
),;,,( wuMDLF
F
=
=
υ
χ
υ
: aerodynamic transfer functions between turbulences and forces. Thus, the
full-scaled global forces are obtained [14,18]:
[ ]
)()(
2
1
)( twCtuCUBtF
FwwFuub
χχρ
+=
(26a)
=−
<<−
=−
==
=
=
=
−
−+
Niyy
Niyy
iyy
LLdiagL
LBC
LC
LC
C
LBC
LC
LC
UBC
tM
tD
tL
tF
NN
iiii
M
D
L
w
M
D
L
u
bi
bi
bi
b
|,|5.0
1|,|5.0
1|,|5.0
);(;;
2
2
2
2
1
;
)(
)(
)(
)(
1
11
12
'
'
'
ρ
(26b)
where
wu
CC ,
: full-scale force coefficient matrices; i: index of structural nodes
L
b
(t)
D
b
(t)
M
b
(t)
α
t
U
h(t)
p(t)
B
u(t)
w(t)
y
x
z
j
j+1
1
N
2
N
-
1
u
j
(t)
u
j+1
(t)
w
j
(t)
w
j+1
(t)
L
j
U
L.T. Hoa / VNU Journal of Science, Mathematics - Physics 25 (2009) 21-38
33
5.2. Spectral proper transformation-based formulation
Power spectra of the generalized responses can be obtained thanks to the second-order Fourier
transform of Eq.(23) with the full-scale global forces Eqs.(26a),(26b) and optimum approximation
from the Spectral Proper Transformation:
[
]
TTT
wwww
TTT
uuuu
nHnnnCnHnHnnnCnHUBnS
*2*2*2*22
)()()()()()()()()()()
2
1
()( ΦΚΨΛΨΦ+ΦΚΨΛΨΦ=
ρ
ξ
(27)
[
]
TT
www
TT
uuu
nHnAnKnnAnHnHnAnKnnAnHUBnS )()()()()()()()()()()()()
2
1
()(
*2*22
Λ+Λ=
ρ
ξ
(28)
where
∑ ∑∑ ∑
= == =
====
N
j
N
j
ww
T
iww
N
j
N
j
uu
T
iuu
nCnAnAnCnAnA
jijjij
ˆ
1
ˆ
1
ˆ
1
ˆ
1
)()()(;)()()(
ψφψφ
:cross modal factor
matrices accounting for interaction between spectral modes and structural ones;
)(nH
: frequency
response function (FRF) matrix
|))(||, )(||,)((|)(
21
nHnHnHdiagnH
M
=
in which
|)(| nH
i
denotes
to FRF at natural frequency n
i
;
2
)(nK
: squared aerodynamic admittance function.
Next, power spectra and root mean square (RMS) of the global responses can be estimated as
follows:
T
U
nSnS ΦΦ= )()(
ξ
;
∫
∞
=
0
2
)( dnnS
UU
σ
(29)
where
2
),(
UU
nS
σ
: spectra and root mean square of global responses, respectively.
Finally, global responses with respect to vertical, longitudinal and rotational directions can be
combined from single-modal responses due to the principle of the squared root of the sum of the
squares:
aphrn
r
M
i
irr
,,;)(
1
2
,
==
∑
=
σσ
(30)
where r denotes to displacement components: vertical (h), longitudinal (p), rotational (a);
r
M
: number
of component modes in the response combination.
5.3. Covariance proper transformation-based formulation
The two N-variate correlated random turbulent processes u(t), w(t) can be decomposed
orthogonally using the optimum approximation from the Covariance Proper Transformation:
)()()(
~
1
txtxtu
uj
N
j
ujuu
∑
=
≈Θ=
θ
;
)()()(
~
1
txtxtw
wj
N
j
wjww
∑
=
≈Θ=
θ
(31)
Putting Eq.(31) into Eq.(23) with the full-scale turbulent-induced forces in Eqs.(26a),(26b), the
single-degree-of-freedom motion equation can be obtained in the time domain:
+=++
∑∑
==
N
j
www
T
i
N
j
uuu
T
iiiiiii
txCtxCUBttt
jjjj
~
1
~
1
2
)()(
2
1
)()(2)(
θφθφρξωξωζξ
&&&
(32)
+=++
∑∑
==
N
j
ww
N
j
uuiiiiii
txAtxAUBttt
jijjij
~
1
~
1
2
)()(
2
1
)()(2)(
ρξωξωζξ
&&&
(33)
L.T. Hoa / VNU Journal of Science, Mathematics - Physics 25 (2009) 21-38
34
where
∑ ∑∑ ∑
= == =
====
N
j
N
j
ww
T
iww
N
j
N
j
uu
T
iuu
jijjij
CAACAA
~
1
~
1
~
1
~
1
;
θφθφ
: cross modal factor matrices accounting
for interaction between covariance modes and structural ones;
)(),( txtx
wu
: covariance principal
coordinates determined by Eq.(8), in such form
as
T
uuuu
txtxtxtx
N
)}(), ,(),({)(
21
=
,
T
wwww
txtxtxtx
N
)}(), ,(),({)(
21
=
.
Generalized response can be solved using any direct integration methods such as the fourth-order
Runge-Kutta method, the Newton-β method. Finally, the globally structural responses are obtained.
5.4. Numerical example and discussions
In this application, the gust response of structures is estimated using both proper transformations
with numerical example of cable-stayed bridge. Effect of the first covariance mode and the first
spectral mode on the global response of structures is discussed.
A bridge has been taken for numerical example. 3D frame model is built thanks to the Finite
Element Method (FEM) with total 30 nodes on bridge deck. First ten structural modes are analyzed.
Damping ratio of each structural mode is assumed to be 0.005. Aerodynamic static coefficients of
cross section at balanced angle (
0
0
0=
α
) and their first derivatives are experimentally determined as:
158.0=
L
C
,
041.0=
D
C
,
174.0=
M
C
,
73.3
'
=
L
C
,
0
'
≈
D
C
,
06.2
'
=
M
C
. Squared aerodynamic admittance
functions are used the Liepmann’s function as approximation of Sears’ function.
Fig. 11. Normalized structural modes: a. vertical modal displacement, b. rotational modal displacement.
Figure 11 shows the fist ten normalized structural modes associated with vertical and rotational
displacements. It is observed that natural frequencies of the first ten modes vary at very low frequency
band between 0.61÷1.85Hz.
In this first application, the random response of structure is predicted in the frequency domain the
using the Spectral Proper Transformation. Spectral eigenvalues and spectral turbulent modes of the
random turbulent fields have been computed and shown in Figures 6, Figure 7. As seen that shapes of
the spectral turbulent modes of u-,w-turbulences, are unchanged during the natural frequency band.
Figure 12 shows effects of number of the spectral turbulent modes (first mode, 5 modes, 10 modes and
1 5 9 13 17 21 25 29
-0.2
0
0.2
1 5 9 13 17 21 25 29
-0.2
0
0.2
1 5 9 13 17 21 25 29
-2E-5
0
2E-5
1 5 9 13 17 21 25 29
-2E-4
0
2E-4
1 5 9 13 17 21 25 29
-0.2
0
0.2
1 5 9 13 17 21 25 29
1 5 9 13 17 21 25 29
-2E-4
0
2E-4
1 5 9 13 17 21 25 29
-0.1
0
0.1
1 5 9 13 17 21 25 29
-5E-4
0
5E-4
Structural nodes
1 5 9 13 17 21 25 29
-5E-4
0
5E-4
Structural nodes
mode 1
mode 2
mode 3
mode 4
mode 5
mode 6
mode 7
mode 8
mode 10
mode 9
1 5 9 13 17 21 25 29
-1
0
1
1 5 9 13 17 21 25 29
-1E-5
0
1E-5
1 5 9 13 17 21 25 29
-0.02
0
0.02
1 5 9 13 17 21 25 29
-0.02
0
0.02
1 5 9 13 17 21 25 29
-2E-5
0
2E-5
1 5 9 13 17 21 25 29
-2E-5
0
2E-5
1 5 9 13 17 21 25 29
-0.02
0
0.02
1 5 9 13 17 21 25 29
-5E-5
0
5E-5
1 5 9 13 17 21 25 29
-0.02
0
0.02
Structural nodes
1 5 9 13 17 21 25 29
-0.02
0
0.02
Structural nodes
mode 1
mode 2
mode 3
mode 4
mode 5
mode 5
mode 7
mode 8
mode 9 mode 10
f
1
=0.61H
z
f
2
=0.80H
z
f
4
=1.19H
z
f
3
=0.85H
z
f
5
=1.29H
z
f
6
=1.45H
z
f
7
=1.58H
z
f
8
=1.63H
z
f
9
=1.68H
z
f
10
=1.85H
z
f
1
=0.61H
z
f
3
=0.85H
z
f
5
=1.29H
z
f
7
=1.58H
z
f
9
=1.68H
z
f
2
=0.80H
z
f
4
=1.19H
z
f
6
=1.45H
z
f
8
=1.63H
z
f
10
=1.85H
z
a. Vertical modal displacement
b. Rotational modal displacement
L.T. Hoa / VNU Journal of Science, Mathematics - Physics 25 (2009) 21-38
35
totally 30 modes) on power spectral densities of generalized responses of vertical and rotational
displacements at mid-span node 15 at mean velocity U=20m/s.
Figure 13 shows effect of number of the spectral turbulent modes on the power spectral densities
of the global responses at node 15 (representative node 15 is illustrated here for a sake of brevity). As
can be seen from Figure 16, there is no much different among investigated cases of cumulatively
spectral turbulent modes in power spectral contribution on targeted responses. Concretely, there are no
differences at resonant responses, but minor differences at background responses can be observed. It
also indicates that the first spectral turbulent mode significantly and dominantly contributes on the
power spectra of the global responses. Power spectra of resonant responses, moreover, can be
observed at the structural modal frequencies due to influence of frequency response functions at these
modal frequencies.
Fig. 12. Effect of number of spectral turbulent modes on power spectra of generalized responses in node 15.
Fig. 13. Effect of number of spectral turbulent modes on power spectra of global responses in node 15.
In the second application, the response analysis is carried out in the time domain using the
Covariance Proper Transformation. The time series of the turbulent wind fields u(t), w(t) have been
simulated firstly using procedure mentioned in the previous part, then these simulated fields have been
used to formulate the zero-time-lag covariance matrix. The covariance eigenvectors (or covariance
0 0.2 0.4 0.6 0.8 1 1.2 1.4 1.6 1.8 2 2.2 2.4
10
-4
10
-3
10
-2
10
-1
10
0
10
1
10
2
Frequency n(Hz)
S
H
(n) (m
2
.s)
Vertical displacement
30 modes (target)
10 modes
5 modes
First mode
0 0.2 0.4 0.6 0.8 1 1.2 1.4 1.6 1.8 2 2.2 2.4
10
-5
10
-4
10
-3
10
-2
10
-1
10
0
Frequency n(Hz)
S
A
(n) (deg
2
.s)
Rotational displacement
30 modes (target)
10 modes
5 modes
First mode
mode 1
mode 2
mode 5
mode 8
mode 3
mode 4
mode 7
mode 9
mode 10
0 0.2 0.4 0.6 0.8 1 1.2 1.4 1.6 1.8 2 2.2 2.4
10
-6
10
-4
10
-2
10
0
10
2
10
4
Frequency n(Hz)
S
h
(n) (m
2
.s)
Vertical displacement
0 0.2 0.4 0.6 0.8 1 1.2 1.4 1.6 1.8 2 2.2 2.4
10
-6
10
-4
10
-2
10
0
10
2
10
4
Frequency n(Hz)
S
a
(n)
Rotational displacement
T
arget
10 modes
5 modes
First mode
T
arget
10 modes
5 modes
First mode
mode 1
mode 2
mode 5
mode 6
mode 3
mode 4
mode
10
L.T. Hoa / VNU Journal of Science, Mathematics - Physics 25 (2009) 21-38
36
turbulent modes) and associated eigenvalues have been found out from the eigen solution of this
covariance matrix. Turbulent fields and full-scale turbulent-induced forces are approximated optimally
using the Covariance Proper Transformation to formulate the generalized response equation in the
time domain.
Fig. 14. Time histories of global forces and global response at velocity U=20m/s: a. nodes 5, b. node 15.
Fig. 15. Global responses on deck nodes versus number of turbulent modes at U=20m/s:
a. spectral matrix-branched response, b. covariance matrix-branched response.
The Newton-β method has been used to solve Eq.(33) to compute generalized responses, before
the global responses of structures can be obtained. Figure 14 shows resulted time series of global lift
and global moment as well as those of globally vertical and rotational displacements in two
representative nodes 5, 15 at also mean velocity U=20m/s during 100-second interval. Maximum and
minimum amplitudes of responses can be determined directly from these resulted time series of
responses. Figure 15 shows amplitudes of maximum vertical and rotational displacements at all bridge
deck nodes at mean velocity U=20m/s in comparison between the Spectral Proper Transformation-
based response (frequency-domain analysis) and the Covariance Proper Transformation-based one
0 10 20 30 40 50 60 70 80 90100
-10
-7.5
-5
-2.5
0
2.5
5
7.5
10
Lift (tf)
Node 5
0 10 20 30 40 50 60 70 80 90100
-2
-1.5
-1
-0.5
0
0.5
1
1.5
2
Moment (tf.m)
Node 5
0 10 20 30 40 50 60 70 80 90100
-12.5
-10
-7.5
-5
-2.5
0
2.5
5
7.5
10
Lift (tf)
Node 15
Time (sec.)
0 10 20 30 40 50 60 70 80 90100
-2.5
-2
-1.5
-1
-0.5
0
0.5
1
1.5
2
Moment (tf.m)
Node 15
Time (sec.)
0 10 20 30 40 50 60 70 80 90 100
-0.05
-0.025
0
0.025
0.05
Vertical disp. (m)
Node 5
0 10 20 30 40 50 60 70 80 90 100
-4
-2
0
2
4
x 10
-3
Rotational disp. (deg.)
Node 5
0 10 20 30 40 50 60 70 80 90 100
-0.1
-0.05
0
0.05
0.1
Time (sec.)
Vertical disp. (m)
Node 15
0 10 20 30 40 50 60 70 80 90 100
-0.01
-0.005
0
0.005
0.01
Time (sec.)
Rotational disp. (deg.)
Node 15
a. Node 5
b. Node 15
5 10 15 20 25 30
0
0.02
0.04
0.06
0.08
0.1
Max amplitude(m)
Deck nodes
5 10 15 20 25 30
0
0.002
0.004
0.006
0.008
0.01
Max amplitude(deg.)
Deck nodes
30 modes
20 modes
10 modes
5 modes
30 modes
20 modes
10 modes
5 modes
Vertical
Rotational
b. Covariance matrix-branched response
5 10 15 20 25 30
0
0.05
0.1
D eck nodes
M ax am plitude (m )
30 m odes
10 m odes
5 m odes
First m ode
5 10 15 20 25 30
0
0.005
0.01
D eck nodes
M ax am plitude (deg.)
30 m odes
10 m odes
5 m odes
First m ode
a. Spectral matrix-branched response
Vertical
Rotational
L.T. Hoa / VNU Journal of Science, Mathematics - Physics 25 (2009) 21-38
37
(time-domain analysis) as well as to investigate effect of number of the turbulent modes on the global
responses. As can be seen in Figure 15, the first turbulent mode contributes significantly on the global
responses of structure in both the spectral matrix-based and covariance matrix-based responses,
moreover, the first spectral turbulent mode in the frequency-domain analysis plays more important
role than the first covariance turbulent one in the time-domain analysis because of its higher
contribution on the global responses of structure.
6. Conclusion
Three recent advanced topics and applications of the POD and its Proper Transformations in
the wind engineering have been presented here relating to (1) The analysis, synthesis and
identification of the dynamic pressure field; (2) The digital simulation of the multi-variate random
turbulent wind field; (3) The random response prediction of structures under the turbulent wind fields.
Especially, all presented topics have been formulated and developed using both Covariance Proper
Transformation in the time domain and the Spectral Proper Transformation in the frequency domain.
Numerical examples have been presented for demonstrations and discussions. The turbulent wind
fields, the pressure fields can be decomposed by concept of orthogonal modes either in the time
domain or in the spectral one. Important role of the first covariance mode and the first spectral mode
has been verified. It is observed that the first mode usually contains certain frequency peaks of hidden
physical phenomena, moreover, it contributes dominantly on the field energy. Furthermore, new and
comprehensive approach on the stochastic response prediction of structures in the frequency domain
and in time domain has been discussed. Correlated turbulent wind fields have been represented and
simplified due to either orthogonally covariance or spectral turbulent modes in which only limited
number of low-order turbulent modes dominantly contributes on the random response of structures. It
is also discussed that the first spectral turbulent mode plays very significant role and seems to be
accuracy enough in predicting the random response of structures in the frequency domain, but more
covariance turbulent modes should be required for accuracy of the random response prediction in the
time domain. It is highlighted that the first spectral mode, in other words, is better than the first
covariance one to analyze the random response prediction of structures.
Acknowledgments. Author would express the grateful thanks to Prof.Masaru Matsumoto and
Prof.Hiromichi Shirato of Laboratory of Structural and Wind Engineering, Graduate School of
Engineering, Kyoto University for their numeric supports on this research.
References
[1] J.L. Lumley, Stochastic Tools in Turbulence, Academic Press, 1970.
[2] P. Holmes, J.L. Lumley, G. Berkooz, Turbulence, coherent structures, dynamic systems and symmetry, Cambridge
University Press, 1996.
[3] Y.S. Li, A. Kareem, Stochastic decomposition and application to probabilistic dynamics, J. Engrg. Mech., ASCE 121, 1
(1995) 162.
[4] Y.C. Liang, P. Lee, W.Z. Lim, K. Lee, C.G. Wu, Proper orthogonal decomposition and its applications – Part I: Theory,
J. Sound Vib. 252, 3 (2002) 527.
L.T. Hoa / VNU Journal of Science, Mathematics - Physics 25 (2009) 21-38
38
[5] G. Berkooz, P. Holmes, L.J. Lumley, The proper orthogonal decomposition in the analysis of turbulent flows, Annual
Reviews on Fluid Mechanics 25 (1993) 539.
[6] J.D. Holmes, Analysis and synthesis of pressure fluctuations on bluff bodies using eigenvectors, J. Wind Eng. Ind.
Aerodyn., 33 (1990) 219.
[7] J.D. Holmes, R. Sankaran, K.C.S. Kwok, M.J. Syme, Eigenvector modes of fluctuating pressures on low-rise building
models, J. Wind Eng. Ind. Aerodyn., 69-71 (1997) 697.
[8] B. Bienkiewicz, Y. Tamura, H.J. Hann, H. Ueda, K. Hibi, Proper orthogonal decomposition and reconstruction of multi-
channel roof pressure, J.Wind Eng. Ind.Aerodyn., 54-55 (1995) 369.
[9] H. Kikuchi, Y. Tamura, H. Ueda, K. Hibi, Dynamic wind pressure acting on a tall building model – proper orthogonal
decomposition, J. Wind Eng. Ind. Aerodyn., 69-71 (1997) 631.
[10] Y. Tamura, S. Suganuma, H. Kikuchi, K. Hibi, Proper orthogonal decomposition of random wind pressure field, J. Fluid
Struct., 13 (1999), 1069.
[11] Shinozuka, M., Yun, C.M., Seya, H., Stochastic methods in wind engineering, J. Wind Eng. Ind. Aerodyn., 36 (1990)
829.
[12] Di Paola, M, Gullo, I., Digital generation of multi-variate wind field processes, J. Prob. Eng. Mech., 16 (2001) 1.
[13] Tubino, F., Solari, G., Double proper transformation for representing and simulating turbulence field, J. Eng. Mech.,
ASCE 131, 12 (2005) 1302.
[14] Le, T.H, Nguyen, D.A., Digital simulation of turbulent field and gust response analysis of line-like structures based on
proper orthogonal decomposition, Proc. Int’l Conf. on Nonlinear Analysis and Engineering Mechanics Today (NA-
EMT2006), Ho Chi Minh City, Vietnam.
[15] Solari, G., Carassale, L., Modal transformation tools in structural dynamics and wind engineering, Wind & Structures, 3,
4 (2000) 221.
[16] Chen, X., Kareem, A., Proper orthogonal decomposition-based modeling, analysis, and simulation of dynamic wind load
effects on structures”, J.Engrg. Mech., ASCE 131, 4 (2005) 325.
[17] Solari, G., Tubino, F., Gust response of long span bridges by double modal transformation, Proc. 4
th
European and
African Conference on Wind Engineering (EACWE4) 2005.
[18] Matsumoto, M., Le, T.H., Time and frequency gust response prediction of bridges using proper orthogonal
decomposition, Proc. of the Int’l Conference on Wind Engineering (ICWE12), Cairns Australia 2007.
[19] De Grenet, E.T., Ricciardelli, F., Spectral proper transformation of wind pressure fluctuations: application to a square
cylinder and a bridge deck, J.Wind Eng.Ind. Aerodyn., 92 (2004) 1281.
[20] Cao, Y.H., Xiang, H.F., Zhou, Y., Simulation of stochastic wind velocity field on long-span bridges, J. Eng. Mech.,
ASCE 126, 1 (2000) 1.
[21] Shinozuka, M., Jan, C.M., Digital simulation of random processes and its application, J. Sound Vib., 25, 10 (1972) 111.
[22] Simiu, E., Scanlan, R.H., Wind Effects on Structures, John Wiley&Sons, 1986.