Tài liệu Women of the World Women''''s Health in India doc
Bạn đang xem bản rút gọn của tài liệu. Xem và tải ngay bản đầy đủ của tài liệu tại đây (172.18 KB, 11 trang )
U.S. Census Bureau,
the Official Statistics
™ December 10, 1998
Women of the World
Womens
Health
in India
WID/98-3
U.S. Department of Commerce
Economics and Statistics Administration
BUREAU OF THE CENSUS
Issued December 1998
By Victoria A. Velkoff and Arjun Adlakha
International Programs Center
India is one of the few countries in
the world where women and men
have nearly the same life expect-
ancy at birth. The fact that the
typical female advantage in life
expectancy is not seen in India
suggests there are systematic
problems with women’s health.
Indian women have high mortality
rates, particularly during childhood
and in their reproductive years.
The health of Indian women is
intrinsically linked to their status in
society. Research on women’s
status has found that the contribu-
tions Indian women make to
families often are overlooked, and
instead they are viewed as eco-
nomic burdens. There is a strong
son preference in India, as sons
are expected to care for parents as
they age. This son preference,
along with high dowry costs for
daughters, sometimes results in the
mistreatment of daughters. Fur-
ther, Indian women have low levels
of both education and formal labor
force participation. They typically
have little autonomy, living under
the control of first their fathers, then
their husbands, and finally their
While women in India face many
serious health concerns, this profile
focuses on only five key issues:
reproductive health, violence
against women, nutritional status,
unequal treatment of girls and
boys, and HIV/AIDS. Because of
the wide variation in cultures,
religions, and levels of development
among India’s 25 states and 7
union territories, it is not surprising
that women’s health also varies
greatly from state to state. To give
a more detailed picture, data for the
major states will be presented
whenever possible.
sons (Chatterjee, 1990; Desai,
1994; Horowitz and Kishwar, 1985;
The World Bank, 1996). All of these
factors exert a negative impact on
the health status of Indian women.
Poor health has repercussions not
only for women but also their
families. Women in poor health are
more likely to give birth to low-
weight infants. They also are less
likely to be able to provide food and
adequate care for their children.
Finally, a woman’s health affects the
household economic well-being, as
a woman in poor health will be less
productive in the labor force.
Women of the World
Female
sterilization
67%
Condom
6%
Traditional
11%
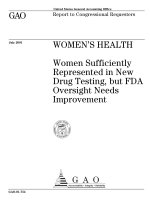
Figure 1.
Percent Distribution of Contraceptive Users by
Method: 1992-93
Note: Percentages do not add to 100 due to rounding.
Source: International Institute for Population Sciences, 1995
IUD
5%
Male
sterilization
9%
Pill
3%
Womens
Health
in India
U.S. Census Bureau,
the Official Statistics
™ December 10, 1998
Women of the World
Urban
Rural
Illiterate
Figure 2.
Fertility and Contraceptive Prevalence: 1992-93
Births per woman
Total fertility rates are for the 3 years preceding the survey.
Source: International Institute for Population Sciences, 1995
5 4 3 2 1 0 10 20 30 40 50 60
Percent of married women
using contraceptives
Total fertility rate Contraceptive use
Less than primary
Primary
High school and above
Hindu
Muslim
Christian
Sikh
All India
Fertility Intertwined
With Women’s Health
Many of the health problems of
Indian women are related to or
exacerbated by high levels of
fertility. Overall, fertility has been
declining in India; by 1992-93 the
total fertility rate was 3.4 (Interna-
tional Institute for Population
Science (IIPS), 1995).
1
However,
there are large differences in
fertility levels by state, education,
religion, caste and place of resi-
dence. Utter Pradesh, the most
populous state in India, has a total
fertility rate of over 5 children per
woman. On the other hand, Kerala,
which has relatively high levels of
female education and autonomy,
has a total fertility rate under 2.
High levels of infant mortality
combined with the strong son
preference motivate women to bear
high numbers of children in an
attempt to have a son or two
survive to adulthood. Research
has shown that numerous pregnan-
cies and closely spaced births
erode a mother’s nutritional status,
which can negatively affect the
pregnancy outcome (e.g., prema-
ture births, low birth-weight babies)
and also increase the health risk for
mothers (Jejeebhoy and Rao,
1995). Unwanted pregnancies
terminated by unsafe abortions
also have negative consequences
for women’s health. Reducing
fertility is an important element in
improving the overall health of
Indian women.
Increasing the use of contracep-
tives is one way to reduce fertility.
While the knowledge of family
planning is nearly universal in India,
only 36 percent of married women
aged 13 to 49 currently use mod-
ern contraception (IIPS, 1995).
Female sterilization is the main
form of contraception; over two-
thirds of the married women using
contraception have been sterilized
(Figure 1).
Place of residence, education, and
religion are strongly related to both
fertility and contraceptive use
(Figure 2). More than half of
married women with a high school
education or above use contracep-
tives, compared to only one-third of
illiterate women. Not surprisingly,
the total fertility rates for these two
groups are significantly different:
4.0 children for illiterate women
compared to 2.2 children for
women with a high school educa-
tion or above. Differentials among
the religious groups also are
pronounced; e.g., Muslims have the
highest total fertility rate and the
lowest contraceptive use (IIPS,
1995).
Despite a large increase in the
number of women using contracep-
tives and limiting their fertility, there
is still unmet need for contracep-
tives in India.
2
Nearly 20 percent
2
Women who either do not want any more
children or want to wait 2 or more years
before having another child, but are not
currently using contraception, are said to
have an unmet need for family planning.
1
The total fertility rate is the number of
children a woman could expect to bear in her
lifetime given the prevailing age-specific
fertility rates.
2
U.S. Census Bureau,
the Official Statistics
™ December 10, 1998
Women of the World
of married women in India either
want to delay their next birth or
have no more children (IIPS, 1995).
Most of the unmet need among
younger women is for spacing
births rather than limiting them.
This implies that methods other
than female sterilization, the
method strongly promoted by
India’s family planning program,
need to be considered.
Over 100,000 Indian
Women Die Each Year From
Pregnancy-Related Causes
Maternal mortality and morbidity
are two health concerns that are
related to high levels of fertility.
India has a high maternal mortality
ratio—approximately 453 deaths
per 100,000 births in 1993.
3
This
ratio is 57 times the ratio in the
United States. The World Health
Organization (WHO) and United
Nations Children’s Fund (UNICEF)
estimate that India’s maternal
mortality ratio is lower than ratios
for Bangladesh and Nepal but
higher than those for Pakistan and
Sri Lanka (WHO, 1996). The level
of maternal mortality varies greatly
by state, with Kerala having the
lowest ratio (87) and two states
(Madhya Pradesh and Orissa)
having ratios over 700 (Figure 3)
(UNICEF, 1995). This differential
maternal mortality is most likely
related to differences in the socio-
economic status of women and
access to health care services
among the states.
The high levels of maternal mortal-
ity are especially distressing
because the majority of these
deaths could be prevented if
women had adequate health
services (either proper prenatal
care or referral to appropriate
health care facilities) (Jejeebhoy
and Rao, 1995). In fact, the leading
contributor to high maternal mortal-
ity ratios in India is lack of access
to health care (The World Bank,
1996).
Few Pregnant Women
Receive Prenatal Care
The most recent National Family
Health Survey (NFHS) was con-
ducted in 1992-93; it found that in
the 4 years preceding the survey,
37 percent of all pregnant women
in India received no prenatal care
during their pregnancies (IIPS,
1995). The proportion receiving no
care varied greatly by educational
level and place of residence.
Nearly half of illiterate women
received no care compared to just
13 percent of literate women.
Women in rural areas were much
less likely to receive prenatal care
than women in urban areas (42
percent and 18 percent, respec-
tively).
Most women who did not receive
health care during pregnancy said
they did not because they thought it
was unnecessary (IIPS, 1995).
Thus, there is a definite need to
educate women about the impor-
tance of health care for ensuring
healthy pregnancies and safe
3
The maternal mortality ratio is the number of
deaths from pregnancy-related causes per
100,000 live births.
3
Orissa
Madhya Pradesh
Uttar Pradesh
Figure 3.
Total Fertility Rate and Maternal Mortality Ratio by Major State:
1993
Births per womam
*The maternal mortality ratio is the number of deaths from pregnancy-related causes per 100,000 live births.
Note: Data for the state of Jammu and Kashmir are unavailable.
Source: UNICEF, 1995 and India Registrar General, 1996a
5 4 3 2 1 0 100 200 300 400 500 600
Maternal mortality ratio*
Bihar
Assam
Karnataka
Haryana
West Bengal
Gujarat
Tamil Nadu
Punjab
6 700 800
Maharashtra
Kerala
Rajasthan
Andhra Pradesh
U.S. Census Bureau,
the Official Statistics
™ December 10, 1998
Women of the World
childbirths. Another reason for the
low levels of prenatal care is lack of
adequate health care centers. It is
currently estimated that 16 percent
of the population in rural areas lives
more than 10 kilometers away from
any medical facility (Bhalla, 1995).
Majority of Births in India
Take Place at Home
Place of birth and type of assis-
tance during birth have an impact
on maternal health and mortality.
Births that take place in non-
hygienic conditions or births that
are not attended by trained medical
personnel are more likely to have
negative outcomes for both the
mother and the child. The NFHS
survey found that nearly three-
quarters of all births took place at
home and two-thirds of all births
were not attended by trained
medical personnel.
While health care is important,
there are several other factors that
influence maternal mortality and
health. Medical research shows
that early age at first birth and high
numbers of total pregnancies take
their toll on a woman’s health.
Although fertility has been declining
in India, as noted earlier, many
areas of the country still have high
levels. In 1993, five states had total
fertility rates of over 4 children per
woman (India Registrar General
(IRG), 1996a). In general, high
maternal mortality ratios are related
to high fertility rates (Figure 3).
One in Five Maternal
Deaths Related to Easily
Treated Problem
Anemia, which can be treated
relatively simply and inexpensively
with iron tablets, is another factor
related to maternal health and
mortality. Studies have found that
between 50 and 90 percent of all
pregnant women in India suffer
from anemia. Severe anemia
accounts for 20 percent of all
maternal deaths in India (The
World Bank, 1996). Severe anemia
also increases the chance of dying
from a hemorrhage during labor.
Every 5 Minutes, a
Violent Crime Against
a Woman Is Reported
Research by Heise (1994) has
shown that violence against women
is a health problem that is often
ignored by authorities who view
such behavior as beyond their
purview. Likewise, many donor
agencies do not want to work on
this problem as they consider it
culturally sensitive. In certain
societies, violence, such as wife
beating, is perceived as “normal” or
as a husband’s right. However, as
Heise concludes, violence against
women is detrimental to economic
development because it deprives
women of the ability to participate
fully in the economy by depleting
both their emotional and physical
strength. Violence against women
also can have negative conse-
quences for the children of the
victims.
While violence is a serious health
issue for Indian women, it is difficult
to say how widespread it is be-
cause data are limited. The data
that are available show an increase
in the reported level of violent crime
against women. However, such
statistics do not reflect the actual
levels of these crimes because
many incidents, particularly domes-
tic violence, go unreported (Kelkar,
1992).
The data that are available show
that much of the violence to which
women are subjected occurs in the
home and/or is carried out by
relatives. For instance, the major-
ity of reported rapes are committed
4
Illiterate
Figure 4.
Nutritional Status of Children
Under Age 4 by Level of Mother’s
Education: 1992-93
Percent
Note: Children who fall below the international reference population median by:
Literate and less than
middle school
Middle school
completed
High school
and above
24.7
59.2
58.5
16.7
50.4
46.4
12.4
43.5
39.3
7.8
30.3
30.0
Source: International Institute for Population Sciences, 1995
3 standard deviations = Severely undernourished (weight-for-age)
2 standard deviations = Undernourished (weight-for-age)
2 standard deviations = Stunted (height-for-age)
Severely undernourished
Undernourished
Stunted
U.S. Census Bureau,
the Official Statistics
™ December 10, 1998
Women of the World
by family members. Many of the
victims are young women; 30
percent of all reported rapes
happened to girls who were age 16
or younger (National Crime
Records Bureau (NCRB), 1995). In
the past few years, there has been
an increase in the reported inci-
dence of torture — cruelty by the
husband and the husband’s rela-
tives. The reported number of
incidents of torture increased 93
percent between 1990 and 1994.
The crime rate for torture was 5.9
cases per 100,000 females in 1994.
Often women are tortured by other
women such as a mother-in-law.
Dowry Deaths Increasing
The most media-sensationalized
type of violence against women in
India is dowry death. When a
woman marries, her family provides
the husband’s family with gifts (e.g.,
clothes, household goods, cash).
In many instances, the demand for
these gifts does not end with the
marriage but continues, as the
husband’s family persists in making
additional dowry demands for years
after the wedding. A dowry death
is defined as the unnatural death of
a woman caused by burns or bodily
injury occurring within the first 7
years of marriage, if it can be
shown that the woman was sub-
jected to cruelty by her husband or
her husband’s relatives shortly
before death in connection with a
demand for dowry (Johnson, 1996;
Prasad, 1996). Nearly 5,000
women were reported to have
suffered this type of death in 1994,
about 1 dowry death for every
100,000 women (NCRB, 1995).
The actual number is certainly
larger, as there are many deaths
that should be reported as a dowry
death and are not.
While studies have shown that
dowry-related violence against
women occurs among all sub-
groups of the population, the rates
are higher among the poor and the
lower castes. Alcoholism is also
associated with increases in
violence against women (Rao and
Bloch, 1993).
Nowhere to Turn
Unfortunately, because many
crimes against women are domes-
tic, women have limited recourse.
Many women who suffer from
domestic violence have little or no
education, are not likely to be able
to support themselves, and are
unlikely to be able to turn to their
parents if they leave their husbands
because their parents either will not
(because of the social stigma) or
cannot (because of economics)
take them in. Generally, the police
have not been helpful to women in
domestic violence cases, and there
are few community support pro-
grams available to these women
(Johnson et al., 1996; Kelkar,
1992). Thus, many victims of
domestic violence remain in
abusive situations.
More Than Half of Indian
Children Are Malnourished
Numerous studies indicate that
malnutrition is another serious
health concern that Indian women
face (Chatterjee, 1990; Desai,
5
Orissa
Madhya Pradesh
Uttar Pradesh
Figure 5.
Percent of Undernourished Children, by Major State: 1992-93
Source: International Institute for Population Sciences, 1995
Bihar
Assam
Karnataka
Haryana
West Bengal
Gujarat
Tamil Nadu
Punjab
Maharashtra
Rajasthan
Andhra Pradesh
INDIA
Jammu and Kashmir
Kerala
0 10 203040506070
Percent
U.S. Census Bureau,
the Official Statistics
™ December 10, 1998
Women of the World
1994; The World Bank, 1996). It
threatens their survival as well as
that of their children. The negative
effects of malnutrition among
women are compounded by heavy
work demands, by poverty, by
childbearing and rearing, and by
special nutritional needs of women,
resulting in increased susceptibility
to illness and consequent higher
mortality.
While malnutrition in India is
prevalent among all segments of
the population, poor nutrition
among women begins in infancy
and continues throughout their
lifetimes (Chatterjee, 1990; Desai,
1994). Women and girls are
typically the last to eat in a family;
thus, if there is not enough food
they are the ones to suffer most
(Horowitz and Kishwar, 1985).
According to the NFHS, Indian
children have among the highest
proportions of malnourishment in
the world. More than half (53
percent) of all girls and boys under
4 years of age were malnourished,
and a similar proportion (52 per-
cent) were stunted (i.e., too short for
their age). Other studies show that
many women never achieve full
physical development (The World
Bank, 1996). This incomplete
physical development poses a
considerable risk for women by
increasing the danger of obstructed
deliveries.
Mother’s Education
Strongly Related to
Children’s Malnutrition
Mother’s education, according to the
NFHS, is highly correlated with the
level of malnutrition among children
(Figure 4). Children of illiterate
mothers are twice as likely to be
undernourished or stunted as
children whose mothers have
completed at least high school. The
differentials are even larger when
severely undernourished children
are considered. Children of illiterate
mothers are three times as likely to
be severely undernourished as
children of mothers with
at least a high school education.
Nutritional status of children also
differs by state (Figure 5). Bihar
and Uttar Pradesh have the highest
proportion of undernourished
children and Kerala has the lowest,
consistent with the different levels
of socio-economic development in
these states.
Excess Female Deaths
Several studies have found that one
of the reasons for the poor health
of Indian women is the discrimina-
tory treatment girls and women
receive compared to boys and men
(Das Gupta, 1994; Desai, 1994).
The most chilling evidence of this
is the large number of “missing
women” (i.e., girls and women who
have apparently died as a result of
past and present discrimination).
Recent estimates place this num-
ber at approximately 35 million
(The World Bank, 1996). In other
words, there is a deficit of 35 million
6
Orissa
Madhya Pradesh
Uttar Pradesh
Figure 6.
Infant Mortality Rate, by Sex, for Major States: 1993
Note: Data for the state of Jammu and Kashmir are unavailable.
Source: India Registrar General, 1996a
Bihar
Assam
Karnataka
Haryana
West Bengal
Gujarat
Tamil Nadu
Punjab
Maharashtra
Rajasthan
Andhra Pradesh
INDIA
Kerala
02040 8060 120
Deaths per 1,000 live births
100
Female
Male
U.S. Census Bureau,
the Official Statistics
™ December 10, 1998
Women of the World
girls/women who should be part of
the population but are not. This
deficit of females is due to higher
female than male mortality rates for
every age group up to age 30 (IRG,
1996a).
4
Differential treatment of girls and
boys in terms of feeding practices
and access to health care is among
the factors responsible for higher
female mortality. As a conse-
quence of their lower status overall,
women experience discrimination in
the allocation of household re-
sources including food and access
to health services. Boys are
breast-fed longer than girls; 25.3
months versus 23.6 months on
average (IIPS, 1995). Boys who
are ill are more likely to be taken for
medical treatment than are girls
(Bhalla, 1995; Jejeebhoy and Rao,
1995). Causes of death for children
aged 1 to 4 show girls dying at a
higher rate than boys from acci-
dents and injuries, fever, and
digestive disorders—all causes that
are related to living conditions and
negligence (Government of India,
1995).
As with other indicators of health
status, differential treatment of
boys and girls varies by state. The
infant mortality rate by sex can be
used as a proxy for differential
treatment. In the vast majority of
countries worldwide, males have
higher mortality in infancy than do
females. Higher female rates are
therefore considered likely to signal
discrimination against girls. Only
7 of the 15 major states in India
have higher male infant mortality
(Figure 6). In the remaining states,
equal or higher female rates
suggest that girls suffer greater
neglect.
One of the most extreme manifes-
tations of son preference is sex-
selective abortion. The use of
medical technology to determine
the sex of a fetus is on the rise in
India, and over 90 percent of
fetuses that are aborted are female
(The World Bank, 1996). In all
countries, more boys are born than
girls, with a sex ratio at birth around
105 boys per 100 girls. Data on
hospital births from various parts of
India show that sex-selective
abortion has increased the sex
ratio at birth to 112 boys per 100
girls (Das Gupta, 1994).
HIV/AIDS in India Is a Little-
Understood Epidemic
The HIV/AIDS epidemic in India is
spreading rapidly and increasingly
will affect women’s health in coming
years. A recent study estimated
that between 2 and 5 million
Indians are currently infected with
HIV (AIDS Control and Prevention
Project of Family Health Interna-
tional et al., 1996). The highest
4
In most countries, females have lower age-
specific mortality rates than do males.
7
Figure 7.
Percent of Ever-Married Women Who Have Heard About AIDS in Selected States: 1992-93
Source: International Institute for Population Sciences, 1995
02040 8060
Percent
100
Mizoram
Manipur
Goa
Nagaland
Delhi
Meghalaya
Tamil Nadu
Maharashtra
Arunachal Pradesh
Tripura
Gujarat
West Bengal
Assam
U.S. Census Bureau,
the Official Statistics
™ December 10, 1998
Women of the World
8
rates of infection are found in
population groups with certain high-
risk behaviors (i.e., sex workers,
intravenous drug users, and
sexually transmitted disease
patients). However, infection also
is increasing in the general popula-
tion. For example, HIV sero-
prevalence among pregnant
women in the state of Tamil Nadu
quadrupled between 1989 and
1991 from 0.2 to 0.8 percent (U.S.
Bureau of the Census, 1995). The
epidemic is fueled by both married
and unmarried men visiting sex
workers who have high rates of
infection. Migrant workers and
truck drivers are important compo-
nents of the spread of HIV. Sur-
veys in some areas show 5 to 10
percent of truck drivers in the
country are HIV infected (AIDS
Analysis, 1996).
Despite the alarming growth of the
epidemic, most women in India
have very little knowledge of AIDS.
The NFHS found that a large
majority of Indian women had never
heard of AIDS. Even among those
who had heard of the disease,
there were many misconceptions
about modes of transmission.
Indian women could benefit from a
strengthened national HIV/AIDS
education program and intervention
programs targeting groups most
susceptible to HIV infection.
References
AIDS Analysis, 1996, “India: ‘a
rapid and extensive spread of HIV’,”
Incorporating AIDS and Society,
Vol. 2, No. 5, p. 11.
AIDS Control and Prevention
Project of Family Health Interna-
tional et al., 1996,
The Status and
Trends of the Global HIV/AIDS
Pandemic,
Final Report, Satellite
Symposium, XI International
Conference on AIDS, Vancouver.
Bhalla, A. S, 1995,
Uneven
Development in the Third World:
A Study of China and India,
Basingstoke, United Kingdom.
Chatterjee, Meera, 1990,
Indian
Women: Their Health and Eco-
nomic Productivity,
World Bank
Discussion Papers 109, Washing-
ton, DC.
Das Gupta, Monica, 1994, “Fertil-
ity Decline and Gender Differentials
in Mortality in India,” paper pre-
sented at the International Sympo-
sium on Issues Related to Sex
Preference for Children in the
Rapidly Changing Demographic
Dynamics of Asia, Seoul.
Desai, Sonalde, 1994,
Gender
Inequalities and Demographic
Behavior, India,
New York.
Government of India, 1995,
Country Report, Fourth UN World
Conference on Women at Beijing,
New Delhi.
Heise, Lori L., 1994,
Violence
Against Women: The Hidden Health
Burden,
World Bank Discussion
Papers 255, Washington, DC.
Horowitz, Berny and Madhu
Kishwar, 1985, “Family Life–The
Unequal Deal,” in Madhu Kishwar
and Ruth Vanita, eds.,
In Search
of Answers: Indian Women’s
Voices from Manushi,
London.
India Registrar General, 1992,
Final Population Totals,
Series 1,
Paper-2 of 1992, New Delhi.
——,
1995,
SRS Based Abridged
Life Tables 1988-92,
Occasional
Paper No. 4 of 1995, New Delhi.
——,
1996a,
Fertility and Mortality
Indicators 1993,
New Delhi.
——,
1996b,
Sample Registration
Bulletin,
Vol. 30, No. 1, New Delhi.
International Institute for Population
Sciences, 1995,
India National
Family Health Survey, 1992-93,
Bombay.
Jejeebhoy, Shireen J. and Saumya
Rama Rao, 1995, “Unsafe Mother-
hood: A Review of Reproductive
Health,” in Monica Das Gupta,
Lincoln C. Chen and T.N. Krishnan,
eds.
, Women’s Health in India:
Risk and Vulnerability,
Bombay.
U.S. Census Bureau,
the Official Statistics
™ December 10, 1998
Women of the World
9
Johnson, Cate et al., 1996, “Do-
mestic Violence in India,” unpub-
lished report to USAID/INDIA.
Johnson, F. Catherine, 1996,
“Violence Against Women in India:
The Law as Protector?,” paper
presented at the Association of
Women in Development Interna-
tional Conference, Washington, DC.
Kelkar, Govind, 1992,
Violence
Against Women: Perspectives and
Strategies in India,
Indian Institute
of Advanced Study, Occasional
Papers 30, New Delhi.
National Crime Records Bureau,
1995,
Crime in India-1994,
New Delhi.
Prasad, Shally, 1996, “Instituting
Measures to Address Violence
Against Women in India,” paper
presented at the Association of
Women in Development Interna-
tional Conference, Washington, DC.
Rao, Vijayemdra and Francis Bloch,
1993, “Wife-beating, Its Causes
and Its Implications for Nutrition
Allocations to Children: An Eco-
nomic and Anthropological Case-
Study of a Rural South-Indian
Community,” University of Michi-
gan, Population Studies Center,
Research Report No. 93-298,
Ann Arbor.
United Nations Children’s Fund
(UNICEF), 1995,
The Progress
of Indian States,
New Delhi.
U.S. Bureau of the Census, Interna-
tional Programs Center, 1995,
HIV/
AIDS in Asia,
Research Note No.
18, Washington, DC.
The World Bank, 1996,
Improving
Women’s Health in India,
Washing-
ton, DC.
World Health Organization, 1996,
“Revised 1990 Estimates of Mater-
nal Mortality: A New Approach by
WHO and UNICEF,” WHO/FRH/
MSM/96.11, Geneva.
U.S. Census Bureau,
the Official Statistics
™ December 10, 1998
Women of the World
10
Selected Population and Demographic Indicators for India
State or territory
1991 census
population
(in 000’s)
Life expectancy
1988-92
Infant mortality
rate 1993
Tota l
fertility rate
1993
Sex ratio*
Percent of
females
married
before
age 18
1993
Percent literate Employment rate
Male Female Male Female
Male Female Male Female 1981 1991 1981 1991 1981 1991 1981 1991 1981 1991
India and Major States
INDIA 846,303 58.6 59.0 73 75 3.5 934 927 20 56.5 64.2 29.9 39.2 52.6 51.6 19.7 22.3
Andhra Pradesh 66,508 59.1 61.5 70 57 2.7 975 972 44 46.8 55.1 24.2 32.7 57.7 55.5 33.5 34.3
Assam 22,414 53.9 54.4 81 81 3.3 910 923 9 NA NA NA NA NA 49.5 NA 21.6
Bihar 86,374 58.4 56.4 68 72 4.6 946 911 27 46.6 52.5 16.5 22.9 50.2 47.9 13.5 14.9
Gujarat 41,310 58.0 60.5 58 58 3.2 942 934 7 65.1 73.1 38.5 48.6 52.9 53.6 20.7 26.0
Haryana 16,464 62.1 63.2 60 73 3.7 870 865 20 58.5 69.1 26.9 40.5 49.9 48.5 10.6 10.8
Jammu and Kashmir
1
. . . NA NA NA NA NA 3.1 892 923 NA NA NA NA NA 55.8 NA 31.3 NA
Karnataka 44,977 60.5 63.6 69 66 2.9 963 960 18 58.7 67.3 33.2 44.3 54.6 54.1 25.3 29.4
Kerala 29,099 68.1 73.4 16 10 1.7 1032 1036 5 87.7 93.6 75.7 86.2 44.9 47.6 16.6 15.9
Madhya Pradesh 66,181 53.8 53.2 106 106 4.2 941 931 33 48.4 58.4 19.0 28.9 54.5 52.3 30.6 32.7
Maharashtra 78,937 62.0 64.7 50 50 2.9 937 934 25 69.7 76.6 41.0 52.3 53.7 52.2 30.6 33.1
Orissa 31,660 55.8 55.1 118 101 3.1 981 971 13 56.5 63.1 25.1 34.7 55.9 53.8 19.8 20.8
Punjab 20,282 65.4 67.2 49 62 3.0 879 882 4 55.6 65.7 39.7 50.4 53.8 54.2 6.2 4.4
Rajasthan 44,006 56.2 56.7 82 81 4.5 919 910 33 44.8 55.0 14.0 20.4 50.9 49.3 21.1 27.4
TamilNadu 55,859 60.7 62.5 57 56 2.1 977 974 10 68.1 73.8 40.4 51.3 56.6 56.4 26.5 29.9
Uttar Pradesh 139,112 56.1 54.5 87 100 5.2 885 879 24 47.5 55.7 17.2 25.3 50.8 49.7 8.1 12.3
WestBengal 68,078 60.8 62.3 57 59 3.0 911 917 24 59.9 67.8 36.1 46.6 50.3 51.4 8.1 11.3
Smaller States
Arunachal Pradesh 865 NA NA NA NA 4.2 862 859 NA 35.1 51.5 14.0 29.7 58.6 53.8 45.7 37.5
Goa 1,170 63.2 63.0 NA NA 1.9 975 967 NA 76.0 83.6 55.2 67.1 48.5 49.6 21.9 20.5
Himachal Pradesh 5,171 NA NA 72 53 3.0 973 976 6 64.3 75.4 37.7 52.1 52.6 50.6 31.9 34.8
Manipur 1,837 NA NA NA NA 2.8 971 958 NA 64.2 71.6 34.7 47.6 46.8 45.3 39.5 39.0
Meghalaya 1,775 NA NA NA NA 3.7 954 955 NA 46.7 53.1 37.2 44.9 54.0 50.1 37.5 34.9
Mizoram 690 NA NA NA NA 2.3 919 921 NA 79.4 85.6 68.6 78.6 52.5 53.9 37.7 43.5
Nagaland 1,210 NA NA NA NA 3.3 863 886 NA 58.6 67.6 40.4 54.8 52.6 46.9 43.2 38.0
Sikkim 406 NA NA NA NA NA 835 878 NA 53.0 65.7 27.4 46.7 57.2 51.3 37.6 30.4
Tripura 2,757 NA NA NA NA 2.7 946 945 NA 61.5 70.6 38.0 49.7 50.7 47.6 12.8 13.8
Union Territories
A&NIslands 281 NA NA NA NA NA 760 818 NA 70.3 79.0 53.2 65.5 56.7 53.3 10.8 13.1
Chandigarh 642 NA NA NA NA NA 769 790 NA 78.9 82.0 69.3 72.3 54.8 54.3 9.1 10.4
Dadra and Nagar Haveli. 138 NA NA NA NA NA 974 952 NA 44.6 53.6 20.4 27.0 56.3 57.5 41.3 48.8
DamanandDiu 102 NA NA NA NA NA 1062 969 NA 74.5 82.7 46.5 59.4 44.5 51.6 22.6 23.2
Delhi 9,421 NA NA NA NA 3.0 808 827 NA 79.3 82.0 62.6 67.0 52.7 51.7 6.8 7.4
Lakshadweep 52 NA NA NA NA NA 975 943 NA 81.2 90.2 55.3 72.9 39.2 44.2 9.2 7.6
Pondicherry 808 NA NA NA NA NA 985 979 NA 77.1 83.7 53.0 65.6 47.1 50.6 13.5 15.2
* Sex ratio = number of women per 1,000 men.
1
1991 Census was not taken in Jammu and Kashmir. The projected population for the state is 7,718,700. The total population for India includes this estimate for Jammu and Kashmir. Other
information shown for Jammu and Kashmir is for only the Jammu Region of the state.
Sources: India Registrar General, 1992, 1995, 1996a, and 1996b.
U.S. Census Bureau,
the Official Statistics
™ December 10, 1998
Women of the World
11
The States and Territories of India
Note: The two island territories of Andaman and Nicobar and Lakshadweep are not shown.