Tài liệu Báo cáo " Research on the optimal picket sampling interval in automated digital terrain model creation by using digital photogrammetry " ppt
Bạn đang xem bản rút gọn của tài liệu. Xem và tải ngay bản đầy đủ của tài liệu tại đây (224.33 KB, 9 trang )
VNU Journal of Science, Earth Sciences 23 (2007) 96-104
96
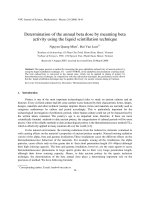
Research on the optimal picket sampling interval
in automated digital terrain model creation
by using digital photogrammetry
Tran Quoc Binh*
College of Science, VNU
Received 24 February 2007
Abstract. In the method of creating digital terrain model (DTM) by using digital photogrammetry,
the picket sampling interval (PSI) plays an important role since it strongly influences on the
production effectiveness and on the accuracy of created DTMs. The optimal value of PSI must be
balanced between requirements of effectiveness and of accuracy.
This research is focused on the influence of PSI on root mean square error (RMSE) of created
DTM and on the number of error pickets (caused by limitation of image matching technique) that
must be checked and corrected manually. Based on the results obtained in four experimental areas
of Vietnam (Co Loa, Duong Lam, Ba Vi, and Lang Son), the paper has proposed an empirical
equation for choosing optimal PSI:
a
MPkPSI ×=
, where
P
is the scan resolution (µm);
a
M
is
the denominator of airphoto scale;
k
is a coefficient depending on the characteristics of topography.
Keywords: Digital terrain model (DTM); Picket sampling interval; Digital photogrammetry; DTM
accuracy.
1. Introduction
*
Being known from 1950s, the Digital
Terrain Models (DTM), as well as the Digital
Elevation Models (DEM), are getting more and
more popular. Nowadays, DTM becomes an
important component of spatial data
infrastructure (SDI) and to the creation of
DTMs a special attention is given.
At present time, among available methods
for creating DTMs, the method using airphoto
and applying digital photogrammetry is the
most popular one [1]. In DTM creation using
_______
*
Tel.: 84-4-8581420.
E-mail:
digital photogrammetry, the key steps are
placing a grid of pickets over the interested area
and measuring these pickets automatically by
using image matching technique. Since the
image matching technique is still imperfect [2,
3], the choice of picket sampling interval (PSI),
i.e. the distance between pickets in the
measuring grid, is very important. The smaller
the PSI, the more detailed DTMs are obtained.
But in the same time, the number of error
pickets that must be discovered and corrected
manually is getting much higher.
Currently, the most common way to choose
PSI is to use the following equation [4, 5]:
a
MPPSI ××= 30 , (1)
Tran Quoc Binh / VNU Journal of Science, Earth Sciences 23 (2007) 96-104
97
where
P
is the scan resolution of airphotos;
a
M is the denominator of airphoto scale.
The practical experiences show that
Equation (1) usually gives PSI a smaller value
than the optimal one. Thus, different researches
are conducted to find the better way to
determine optimal PSI by using high-quality
airphotos of some areas in Europe [6-8]. Since
the characteristics of topography and the
quality of airphotos are important factors
influencing on the choice of PSI, the results of
these researches are hardly applicable for the
conditions of Vietnam, which are different from
European ones.
In this research, we investigated the
influences of PSI on the number of error
pickets and the accuracy of DTM by using
airphoto database of Vietnam. On this basis,
some recommendations on choosing optimal
PSI are given.
2. Testing methodology
2.1. DTM creation
In this research, the workflow shown in Fig. 1
is used for creating and testing DTMs. Since the
main purpose of the research is to assess the
quality of automated picket sampling and
measuring, some steps (additional breakline
measuring, field checking, ) are intentionally
omitted. The software used for airphoto
measurement and DTM creation is PhotoMOD
3.51 - a softcopy photogrammetric system
developed by Racurs Inc.
- Photoscanning: the airphotos are scanned at
different resolutions from 800dpi (32µm) to
1600dpi (16µm) by using photogrammetric
scanner ZEISS SCAI.
- Project assembling: the main purpose of this
step is to distribute airphotos by strips as they
were shot in the field.
- Ground control measurement: three GPS
receivers Trimble 4600LS are used for ground
control measurement. There are at least 5
ground control points in each of photostrips (4
at the corners and 1 in the center). The
coordinates of control points are obtained by
measuring GPS baselines to at least 3 points of
the State Control Network. The overall
accuracy of coordinates is 2-4cm in horizontal
directions and 4-7cm in vertical direction.
Photoscanning
Project assembling
Ground control
measurement
Photo orientation and
triangulation
Block adjustment
Stereo drawing
Picket grid placement
Automated picket
measurement
Error checking and
counting
DTM generation
DTM accuracy
assessment
Fig. 1. The workflow for DTM creation and testing.
Tran Quoc Binh / VNU Journal of Science, Earth Sciences 23 (2007) 96-104
98
- Photo orientation and triangulation: Interior
orientation of each airphoto is made by
measuring fiducial points with an error of
about 0.7 pixels. Exterior orientation is made by
entering collected ground control points
(absolute orientation) and measuring tie points
between stereo pairs and between strips
(relative orientation). The estimated error of
relative orientation is about 4-6 pixels.
- Block adjustment: The method of adjustment
is "Independent stereo pairs" in order to improve
the accuracy comparing to "Independent strips"
method. The fully constrained adjustment is
preceded by minimally constrained adjustment
in order to discover possible errors in the tie
points measurement.
- Stereo drawing: The anaglyph method is used
for drawing streomodels. Detailed information
about this method can be found in [3].
- Picket grid placement: this step is done with
the aim to determine the DTM area and the
distribution of pickets, which will be measured
in the next step. The grids are placed in the
central area of the stereo models. The distances
from grids to edges of airphotos are kept at more
than 10% of the length (or width) of airphotos
in order to reduce errors in the areas near edges
of airphotos. The PSI, i.e. the grid cell size, is
varied from 20 to 120m.
- Automated picket measurement: each node of
the picket grid is measured automatically by
using image matching technique. The correlation
threshold is set to a relatively high value (0.90)
in order to eliminate large errors in homogeneous
areas. If the coordinates of a node are measured
successfully, a picket is created. Otherwise, the
software will move the node for a small
distance and the process repeats until success.
- Error checking and counting: this step is
made to discover the errors generated by the
previous step since the image matching technique
does not ensure 100% reliability. There are still
some incorrectly measured pickets, especially
in the areas on airphotos with homogeneous
grey level [9]. The operator has three options to
discover incorrect pickets:
+ Watch the grid of pickets placed on the
stereomodel and visually find those pickets that
are above or below the ground.
+ Compare the distance (parallax) between
red and blue points representing the investigated
picket on the stereo model with the same
distance of nearby pickets or ground features.
Since neighbour points usually have almost
same elevation, they usually have almost same
parallax in the stereo model. Any anomaly of
parallax may point out an error.
+ Generate an intermediate DTM as a TIN
(Triangulated Irregular Network) from current
set of pickets and display it in 3D space. Any
peak or abyss formed by one - two pickets may
point out an error (see Fig. 2).
Fig. 2. An intermediate DTM displayed in 3D space. The small circles denote possible errors.
Tran Quoc Binh / VNU Journal of Science, Earth Sciences 23 (2007) 96-104
99
The number of error is registered for
statistical analysis explained in the next session.
After that, the incorrect pickets are corrected for
the next step.
- DTM generation: this step is done
automatically from the checked and corrected
set of pickets measured in the previous steps by
using module DTM.
- DTM accuracy assessment: the main
purpose of this step is to compare the created
DTM with a control DTM and compute root
mean square error (RMSE) of the former. In this
research, as the control DTMs we used high
accuracy DTMs created manually from airphoto
in combination with field survey. The method
proposed by the author for DTM accuracy
assessment is explained in the next session.
2.2. Method for computing error of DTM by
using GIS
Since the sets of pickets used for generating
testing DTM and control DTM are not
coincided in both horizontal and vertical
directions, the RMSE of the testing DTM can
not computed directly picket by picket. So, in
this research, we have developed a method
using GIS for comparing two DTMs and
computing RMSE.
The idea is to interpolate two DTMs (or
corresponding sets of pickets) into two raster
layers of high resolution, and then use the
raster analysis capability of GIS for calculating
the difference of values of each pair of
coincident cells on these two raster layers. In
this research, we use Raster Calculator and
Raster Zonal Statistics tools of ArcGIS software
for this purpose.
The workflow for computing error of DTM
by using ArcGIS is presented in Fig. 3.
The testing and control sets of pickets (or
DTM) are imported to point feature classes (or
TIN) and opened as two layers in ArcGIS. After
that, an interpolation is applied to convert
Import to ArcGIS
R
TEST
Interpolate to raster R
CONTROL
Calculate differences ∆
i
of raster values v
i
cell by cell
TEST
i
CONTROL
ii
vv −=∆
and
2
i
∆
Compute average value
∑
=
∆=
n
i
i
n
D
1
2
1
RMSE =
D
n
n
i
i
=∆
∑
=1
2
1
Control set of pickets
or control DTM
Testing set of pickets
or testing DTM
Fig. 3. The developed workflow for computing RMSE of DTM by using ArcGIS.
Tran Quoc Binh / VNU Journal of Science, Earth Sciences 23 (2007) 96-104
100
these feature layers into raster layers. There
exist many interpolation algorithms, but the
same algorithm must be applied for both feature
layers. We prefer to use Spline interpolation
since it is the most popular algorithm for
interpolating topographic surfaces [10]. At this
step, we have two raster layers, namely R
TEST
and R
CONTROL
. The values of their cells represent
the heights of the surfaces interpolated from the
testing DTM and control DTM.
The next step is to calculate differences
i
∆
between the values
CONTROL
i
v and
TEST
i
v of coincided
raster cells:
nivv
TEST
i
CONTROL
ii
, ,2,1 , =−=∆
(2)
where
n
is number of cells inside the interested
area.
The above calculation can easily be done by
using Raster Calculator tool of ArcGIS software.
For the sake of convenience, the squares of
i
∆
are also calculated in this step:
(
)
2
2 TEST
i
CONTROL
ii
vv −=∆
(3)
In the next step, the average value
D
of
2
i
∆
inside the interested area is computed using
Raster Zonal Statistics tool of ArcGIS:
∑
=
∆=
n
i
i
n
D
1
2
1
(4)
Finally, the RMSE of testing DTM is
computed as follows:
D
n
n
i
i
=∆=
∑
=1
2
1
RMSE (5)
3. Test and discussion
The influence of PSI on the quality of
automatically created DTM is investigated on
four experimental areas. The main characteristics
of these areas are shown in Table 1.
3.1. Co Loa experimental area
Co Loa is a commune of Dong Anh District,
Hanoi City. This place is very famous in
Vietnam thanks to the Co Loa Wall, which is
built in the III Century B.C. Being located in
18km from center of Hanoi, Co Loa has an even
and flat terrain, except for the above mentioned
Co Loa Wall with height of about 2-4m. The
population density is relatively high. There are
many houses and traces of dykes in the central
area, which make some difficulties in automated
picket measurement by using image matching
technique.
The experimental area covers about 200 ha
in the Northwest of the commune. In this area,
we tested four PSIs: 20, 30, 40, and 60m. The
summarized results are shown in Table 2 and
Fig. 4.
Table 1. Characteristics of the experimental areas
Airphoto characteristics
Area Sub-area Type of topography
Number
of photo
Number
of strips
Flying
year
Scale
Flying
height
Scan
resolution
Co Loa Plain, high building density 13 2 2003 1:7000 1050m 28µm
Duong Lam 1
Residential area, similar to
Co Loa
Duong
Lam
Duong Lam 2
Hills, paddy-fields, many
mounds
2 1 1997 1:33000
5000m 16µm
Ba Vi 1 Residential area
Ba Vi
Ba Vi 2 Mountainous area
3 1 2004 1:32000
4900m 20µm
Lang
Son
High mountains 3 1 2000 1:35000
5350m 32µm
Tran Quoc Binh / VNU Journal of Science, Earth Sciences 23 (2007) 96-104
101
Table 2. Results obtained in Co Loa experimental area
Error pickets
PSI (m)
Total number
of pickets
Number %
RMSE
(m)
20 6634 552 8.32 0.55
30 2982 217 7.28 0.62
40 1642 141 8.59 0.68
60 700 34 4.86 0.75
0
200
400
600
20 30 40 50
PSI (m)
Number of error pickets
0
0.2
0.4
0.6
0.8
RMSE (m)
Fig. 4. Expected (dotted line) and actual (solid line)
numbers of error pickets, and RMSE (dashed line) in
Co Loa experimental area.
From the obtained results, some remarks
can be made:
- The RMSE of DTM almost linearly
increases with the increase of PSI.
- The errors are mainly occurred in the area
with homogeneous grey levels (surface water,
shadows of high objects, etc.). The similar
remark was made by some researchers [2, 9].
- When PSI increases from 20m to 30m, the
number of error pickets are significantly
decreases (from 552 to 217). Further increase of
PSI does not give such significant decrease of
error pickets.
- The percentage of error pickets shows a
tendency to decrease with increase of PSI.
However, in Table 2 we can see an anomaly: the
PSI of 40m has a larger percentage of error than
the PSI of 30m. We suppose that this happens
due to the random allocation of the pickets
relatively to the ground objects. Note that this
percentage is used only for reference: a more
important parameter is the absolute number of
errors.
- The hyperbola-like shape of the graph
representing the actual number of error pickets
in Fig. 4 is what we expected. It can be
explained as follows:
Ideally, if the percentage
p
of error pickets
remains unchanged then the number of error
pickets
e
equals:
2
PSI
S
pe =
, (6)
where
S
is the area of DTM. Thus, the graph
(
)
PSIee = theoretically should have a hyperbola-
like shape (dotted line in Fig. 4). Some observed
deviations of the actual number of error pickets
are due to the errors of measurement and to the
random allocation of pickets.
- Based on the obtained results, the optimal
PSI for Co Loa experimental area can be chosen
equal 30-40m since it gives an acceptable
accuracy with relatively small number of error
pickets.
3.2. Duong Lam experimental area
The old village of Duong Lam is a famous
cultural heritage and historical monument of
Vietnam. Located in 5km in the Northwest of
Son Tay Town, Duong Lam has typical
characteristics of the midland topography. The
area has many mounds combined with low hills.
The experimental area covers about 335 ha,
and it is divided into two sub-areas: the Duong
Lam 1 is a residential sub-area (175 ha), and
Duong Lam 2 is a hill and field sub-area (160
ha). We have tested four PSIs: 30, 50, 70, and
90m. The summarized results are shown in
Table 3 and Fig. 5.
For Duong Lam experimental area, we have
made the following remarks:
- With increase of PSI, the number of error
pickets drops significantly at PSI = 50 ÷ 70m and
then decreases slowly.
- The RMSE increases by 4-9% when PSI
increases by 20m. The corresponding graph in
Fig. 5 has a parabola-like shape with a very low
curvature.
Tran Quoc Binh / VNU Journal of Science, Earth Sciences 23 (2007) 96-104
102
Table 3. Results obtained in Duong Lam
experimental area
Error pickets
PSI (m)
Total number
of pickets
Number %
RMSE
(m)
Duong Lam 1: residential sub-area
30 1935 249 12.87 0.93
50 702 87 12.39 1.02
70 342 51 14.91 1.14
90 210 22 10.47 1.17
Duong Lam 2: hill and paddy-field sub-area
30 1786 538 30.12 1.07
50 616 162 26.30 1.15
70 320 57 17.81 1.22
90 180 42 23.33 1.27
0
200
400
600
30 50 70 90
PSI (m)
Number of error pickets
0.8
1
1.2
1.4
RMSE (m)
Fig. 5. Number of error pickets (solid line) and RMSE
(dashed line) in Duong Lam 2 sub-area.
- The errors are concentrated in vegetable
fields, ponds, mounds, hill bases and hill tops.
- The optimal PSI can be chosen equal 50-
70m for both residential and field sub-areas.
3.3. Ba Vi experimental area
Located in 53km from Hanoi in the
northwest direction, Ba Vi District is a half-
mountain half-plain area. The topography is
divided into three different sub-types: mountain,
hill - mound, and plain. Our interested area
covers about 720 ha around Ba Vi National Park.
It has two sub-areas: Ba Vi 1 is a residential sub-
area (330 ha) and Ba Vi 2 is a mountainous sub-
area (390 ha).
In Ba Vi experimental area, we have tested
four PSIs: 40, 60, 80, and 100m. The summarized
results are shown in Table 4 and Fig. 6.
Table 4. Results obtained in Ba Vi experimental area
Error pickets
PSI (m)
Total number
of pickets
Number %
RMSE
(m)
Ba Vi 1: residential sub-area
40 2070 246 11.88 0.91
60 930 86 9.25 0.94
80 506 48 9.48 0.95
100 342 25 7.31 0.98
Ba Vi 2: mountainous sub-area
40 2444 535 21.89 1.29
60 1120 218 19.46 1.44
80 650 154 23.69 1.58
100 420 101 24.05 1.68
0
200
400
600
40 60 80 100
PSI (m)
Number of error pickets
1
1.2
1.4
1.6
1.8
RMSE (m)
Fig. 6. Number of error pickets (solid line) and RMSE
(dashed line) in Ba Vi 2 sub-area.
The following remarks are made for Ba Vi
experimental area:
- The number of error pickets has the same
distribution character as in Co Loa and Duong
Lam, though the PSIs values are 1.5-2.0 times
bigger.
- The percentage of error pickets in the
mountainous sub-area is much large (2 times)
than that is in the residential sub-area.
Consequently, the RMSE in the mountainous
sub-area is much higher.
- The errors pickets are concentrated on the
tops of mountains, which appear as uniformly
black blocks in the airphotos.
- The optimal PSI can be chosen equal 80-
100m for the residential sub-area, and 60-80m
for the mountainous sub-area. It is not a
surprise that the mountainous sub-area has a
Tran Quoc Binh / VNU Journal of Science, Earth Sciences 23 (2007) 96-104
103
larger PSI than the residential sub-area, since
the former has much more varying elevation
than the latter.
3.4. Lang Son experimental area
Lang Son City is one of the important
administrative centers of Vietnam in the
Northeast region. The city is a valley at
elevation of 250-500m relatively to the sea level.
The experimental area is located in the
Southwest of Lang Son City. Most of the area is
covered by high mountains, some peaks reach
550m and higher. The mountains make serious
difficulties for automated picket measurement
since they appear as large black blocks in the
airphotos.
In Lang Son experimental area, we have
tested four PSIs: 45, 60, 80, 100, and 120m. The
summarized results are shown in Table 5 and
Fig. 7.
Table 5. Results obtained in Lang Son
experimental area
Error pickets
PSI (m)
Total number
of pickets
Number %
RMSE
(m)
45 2392 499 20.86 1.78
60 1326 301 22.70 1.92
80 754 174 23.08 2.04
100 460 111 23.91 2.15
120 323 66 20.43 2.24
0
200
400
600
45 60 80 100 120
PSI (m)
Number of error pickets
1
1.2
1.4
1.6
1.8
2
2.2
2.4
RMSE (m)
Fig. 7. Number of error pickets (solid line) and RMSE
(dashed line) in Lang Son experimental area.
In Lang Son area, we have made the
following remarks:
- The errors of DTMs are significantly larger
than in the previous areas. The reason is that
the topography of Lang Son is much more
difficult to image matching technique than in
the previous areas.
- The character of dependency of RMSE and
the number of error pickets to PSI is similar to
the previous cases, though it is less abrupt.
- The optimal PSI for Lang Son experimental
area can be chosen equal 80-100m. Note that
this PSI can be chosen only if the DTM error of
about 2m is acceptable.
3.5. Some comments on choosing optimal PSI
From the results obtained in 4 experimental
areas, some comments are made as follows:
- The optimal PSI is not linearly correlated
to the scan resolution. Thus, Equation (1) is not
very suitable. Moreover, it usually gives PSIs
smaller than optimal PSIs discovered in this
research.
- The larger the scale of airphotos, the
smaller the optimal PSI. This relationship is
consistent with the results of other researchers
[6].
- We proposed to use the following
empirical equation for choosing the optimal PSI:
a
MPkPSI ×=
(7)
where
P
is the scan resolution (µm);
a
M is the
denominator of airphoto scale;
k
is a coefficient
depending on the characteristics of topography,
09.008.0 ÷=k for mountainous areas and
105.0095.0 ÷=k
for plain areas.
- For projects covering large areas, it is
better to test some small sub-area to derive the
optimal PSI instead of using Equation (7).
- In all cases, an additional manual
breakline measurement is required for achieving
better accuracy of DTM.
4. Conclusions
With increase of PSI, the accuracy of DTM
Tran Quoc Binh / VNU Journal of Science, Earth Sciences 23 (2007) 96-104
104
is decreased almost linearly. In the same time,
the number of errors caused by image matching
technique is decreased too. However, this
change is drastic at some smaller values of PSI,
and then is moderate at larger values of PSI.
Based on the results obtained in four
experimental areas of Vietnam, we have
proposed an empirical equation for choosing
optimal PSI:
a
MPkPSI ×=
where
P
is the
scan resolution (µm);
a
M is the denominator of
airphoto scale;
k
is a coefficient depending on
the characteristics of topography.
Acknowledgements
This paper was completed within the
framework of Fundamental Research Project
702406 funded by Vietnam Ministry of Science
and Technology.
References
[1] P.V. Thanh, Digital elevation models in natural
resource and environment research, Publishing
House of Science and Technology, Hanoi, 2004
(in Vietnamese).
[2] M. Kasser, Y. Egels, Digital Photogrammetry,
Taylor & Francis, London and New York, 2002.
[3] P.R. Wolf, B.A. Dewitt, Elements of
photogrammetry (with application in GIS),
McGraw Hill, 2000.
[4] F. Ackermann, Digital Elevation Model –
Techniques and Application, Quality Standards,
Development, Proceedings of the Symposium
Mapping and Geographic Information Systems,
Commission IV of ISPRS, Athens G.A., USA,
1994.
[5] F. Ackermann, Techniques and Strategies for
DEM Generation, Digital Photogrammetry – An
addendum to the Manual of Photogrammetry, ed. C.
Greve, American Society for Photogrammetry
and Remote Sensing, Maryland, USA, 1996, pp.
135-141.
[6] M. Sauerbier, Accuracy of automated aero-
triangulation and DTM generation for low
textured imagery, XX
th
ISPRS Congress,
Commission 2, Turkey (2004) 521.
[7] K. Krauss et al., Quality measures for digital
terrain models, XX
th
ISPRS Congress, Commission
2, Turkey (2004) 113.
[8] J. Gong, L. Zhilin, et al., Effect of various factors
on the accuracy of DEMs: An intensive
experimental investigation, Photogrammetric
Engineering and Remote Sensing 9 (2000) 1113.
[9] T. Q. Binh, A Method for controlling errors of
automated image matching in areas with
homogeneous grey levels, VNU Journal of
Science, Natural Sciences and Technology No. 5AP
/ XXI (2005) 21 (in Vietnamese).
[10] N. El-Sheimy, C. Valeo, and A. Habib, Digital
Terrain Modeling - Acquisition, Manipulation and
Applications, Artech House, Inc., Norwood,
Massachusetts, 2005.