Tài liệu Báo cáo " Tourism carrying capacity assessment for Phong Nha Ke Bang and Dong Hoi, Quang Binh Province " doc
Bạn đang xem bản rút gọn của tài liệu. Xem và tải ngay bản đầy đủ của tài liệu tại đây (190.95 KB, 8 trang )
VNU Journal of Science, Earth Sciences 23 (2007) 80-87
80
Tourism carrying capacity assessment for Phong Nha -
Ke Bang and Dong Hoi, Quang Binh Province
Tran Nghi*, Nguyen Thanh Lan, Nguyen Dinh Thai, Dang Mai, Dinh Xuan Thanh
College of Science, VNU
Received 06 February 2007
Abstract. Recently, tourism activities in Quang Binh Province have been growing rapidly,
especially since the Phong Nha - Ke Bang National Park was certified as the World Natural
Heritage in 2004. Among the tourist sites of Quang Binh, Phong Nha and Dong Hoi tourism centers
are the two places which attract the largest numbers of visitors. The rapid but unplanned tourism
activities have been creating various social and environmental concerns. If appropriate planning
measures are not derived from the consideration of the carrying capacities of these sites, tourism
centers will be overloaded, tourism quality will be degraded and therefore the benefit obtained
from tourism activities will be reduced. This paper presents the tentative establishment of a method
to calculate the environmental carrying capacities of three basic components: ecological, economic
and social. As the results, the carrying capacities of several tourism activities are quantitatively
evaluated for Phong Nha tourism center. The resulting carrying capacities for Phong Nha cave
sightseeing, ecotourism forest hiking and cable car ridding are 43893, 1450 and 33000 visits per day
respectively. With respect to the Dong Hoi tourism center, the carrying capacities of local beaches are
71000 visits per day. These estimates can be used as the preliminary benchmarks for later tourism
planning of the two tourism centers: Phong Nha - Ke Bang and Dong Hoi.
Keywords: Tourism; Carrying capacity; Limiting factor; National park; Beach.
1. Introduction
*
Tourism, as well as some other economic
sectors, is a profitable economic sector in
Vietnam. The tourism activities are related to
different exploited natural resources such as
mineral resources, geotop, cultural site, The
rapid but unplanned exploitation and
utilization of these resources create a risk of
loosing their recovery capacities, destroying the
basic functionalities of ecosystem within
_______
*
Corresponding author. Tel.: 84-4-5587059.
E-mail:
tourism areas. Various tourism-related factors
can be identified to have impact on these
resources, among which the number of tourists
would be the most important one. The concept
of carrying capacity of a tourism site was
stemmed from this perception. This concept is
important in the tourism planning which aims
to sustainable tourism development. In 1994,
the World Tourism Organization (WTO)
proposed a definition of tourism carrying
capacity as follow: "The maximum number of
people that may visit a tourist destination at the
same time, without causing destruction of the
physical, economic, socio-cultural environment and
Tran Nghi et al. / VNU Journal of Science, Earth Sciences 23 (2007) 80-87
81
an unacceptable decrease in the quality of visitors'
satisfaction".
Luc Hens [1] defined the tourism carrying
capacity as "The maximum number of people that
use tourism site without unacceptable effect on
environmental resources while meeting the demand
of tourists".
Based on our perception of sustainable tourism
development, objectives of the project QGTD-
03-04, the local characteristics, and several
concepts of carrying capacity in literature, our
concept proposed to be applied to Quang
Binh as follow: "Tourism carrying capacity is the
highest bearing capacity of a natural, environmental
and socio-economic system within which the
maximum number of tourists has no influence on
sustainable development of the entire system and
tourists' satisfaction are remained during the peak
tourism period".
According to this definition, the tourism
carrying capacity includes three components:
ecological carrying capacity, social carrying
capacity and economic carrying capacity.
Ecological carrying capacity is the number of
tourists who can undertake activities in a
tourism site without causing the degradation
below the allowable limit of natural
environment. In order to calculate the
ecological carrying capacity, safety limits of
ecosystems are often used through indicators of
natural environment, biological diversity,
environmental pollution,
Social carrying capacity includes two aspects:
1) Acceptance level of local community which
is reflected by the maximum number of tourists
which does not make local residents unpleasant;
and 2) acceptance level of tourists which is
expressed by their satisfaction to tourism sites
and the number of returnees.
Economical carrying capacity is acceptable
level of tourism activities without doing any
harm to key local economic activities. It means
that tourism activities must not make conflict to
other economic sectors and a decrease in the
income of the local people.
2. General formulae
To calculate carrying capacity of some
tourism activities in Quang Binh Province, the
formulae of Cifuentes [2] and Ceballos –
Lascurain [3] are used with some adjustments.
Tourism carrying capacity is divided into the
following levels:
2.1. Physical carrying capacity (PCC)
Definition: PCC is the maximum number of
tourists that can physically fit into or onto a
specific area, over particular time:
RfDAPCC ××= , (1)
where:
A
: available area for use (m
2
);
D
: tourist density (tourists / m
2
);
Rf : Rotation factor (number of visits
per day).
A
is determined by particular conditions of
the considered area. In natural area, this
parameter can be determined by natural
boundary such as mountain range, river,
stream, or safety demand. In conservation
area, where tourism is developed, the available
area can be estimated from the length of track
in that area or the total area where tourists can
do camping.
The tourist density or the area required per
tourist
D
is the area needed for a tourist who
can undertake activities comfortably.
Rotation factor is the number of permissible
visits over a specified time (usually calculated
by daily open hours) and expressed by:
Rf = Open period / average time of visit (2)
2.2. Effective Real Carrying Capacity (ERCC)
Definition: ERCC is the maximum number
of tourists that is permitted by the local
conditions and management capacity without
influencing the tourists’ demand:
n
CfCfCfPCCERCC −−−−−=
21
, (3)
Tran Nghi et al. / VNU Journal of Science, Earth Sciences 23 (2007) 80-87
82
where:
i
Cf (corrective factors or limiting factors)
are factors which have negative impact on
tourism activities and assessed by limiting
threshold which used for identifying impact
level of a factor (%):
100
100
100
100
100
100
21
n
cfcfcf
PCCERCC
−
××
−
×
−
×=
, (4)
where limiting factors can be determined by:
Mt
M
Cf
1
=
, (5)
1
M
: limiting magnitude of variable;
Mt : total magnitude of variable.
These factors are selected based on tourism
activities and local conditions of the study area.
In consideration of tourism activities at National
Parks, the following factors should be taken
into account: environmental safety, conservation,
natural resources managements, tourism
activities, planning and local factors such as
human resources, the contribution of tourism to
local economic development, social crimination,
2.3. Limiting factors used in calculating tourism
carrying capacity
Environmental indicators are used to
indicate the sensitivity of environment and
development. Indicators form a set of indicators
(index) that help us to recognize on-going
problems and propose corrective actions. In
estimation of carrying capacity, only negative
factors which hinder the development of
tourism activities are considered. These factors
are translated into quantitative or semi-
quantitative values which measure the
adaptability of environmental, socio-economic
subsystem and tourists’ demand.
Therefore, indicators selected for calculating
carrying capacities have the following
characteristics:
- Computable (often quantitative or semi-
quantitative values).
- Easily surveyed and collected (by field
research and questionnaire).
3. Carrying capacity of the main tourism centers
3.1. Phong Nha tourism center
a. Cave sightseeing
To calculate Effective Real Carrying Capacity
(
ERCC
), factors that affect tourist's comfort such
as the necessary distance between two people
and the distance between two groups on a
route should be considered. It is a limitation of
the previous formulae proposed in the literature.
Therefore, to improve Ceballos-Lascurain
formula, the following physical parameters are
included:
- Length of sightseeing route in Phong Nha
cave (Wet cave): 600m.
- Length of sightseeing route in Tien Son
cave (Dry cave): 450m.
- Distance from waiting house to Tien Son
cave: 200m.
- Length of a boat: 5-7m.
- Distance between two boats operating in
Phong Nha cave: 5m.
- Distance between two groups in Tien Son
cave: 5m.
- Average distance between two people: 1m.
- Maximum number of people on one boat:
13 visitors (include tour guide).
- Average time for a tour: 3 hours (excluding
the time on boat along Son River).
- Open period: 8 AM - 17 PM (9 hours).
Let
x
to be the maximum number of boats
in Phong Nha cave. From entrance to the last
visiting point, the number of boats is expressed
by equation:
6005)1(7 =×−+× xx .
The above equation gives:
=
x
50 boats.
Let
k
to be the maximum number of groups
going into Tien Son cave (one group is
equivalent to one boat). The length of this cave
is 450 meters, the distance from waiting house
to entrance is 200 meters, and therefore the
route is 650 meters in lengths:
6505)1(13 =×−+× kk
=⇒ k
36 groups.
Tran Nghi et al. / VNU Journal of Science, Earth Sciences 23 (2007) 80-87
83
Open period is 9 hours/day; each tour is
about 3 hours. Thus the number visits per day
is 3 ( =Rf 9/3). Therefore, the maximum number
of visits per day is:
31386313)( ××=××+= kxPCC
= 3354 visits/day (100620 visitors/ month).
Thus, the maximum number of tourists that
Phong Nha cave could serve is about 3354
visitors/day.
Corrective factors:
Survey and investigation results show that
the physical, biological, ecological parameters
in this area are insignificant. Moreover, the
sightseeing route Phong Nha - Tien Son lies
outside the strict protection area of the National
Park, so these parameters are not limiting
factors.
+ Weather limiting factor (
1
Cf ):
During the year, storms often occur in
September and October, and limit the number
of visitors. At the same time, boats cannot get
into the cave because of high water levels [4].
Almost all tourists, who were asked, do not
want to visit the National Park during this time,
so weather factor is taken as a limiting factor:
1
M
: 60 days (two month Sept., Oct.);
Mt : 365 days (one year).
Limiting factor for weather (
1
Cf ):
%)4.16( 164.0
365
60
1
===Cf
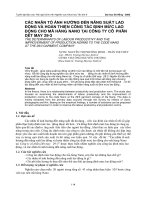
+ Noise (Cf2): Statistical analysis of
questionnaires filled by managers, tour guides
and tourists at the National Park has indicated
that the noise from boat engine has affected
tourists (they must bear the noise and are
almost unable to communicate when being on
boat). Therefore, the noise is taken as a limiting
factor. The results of questionnaires are
analysed and shown in Fig. 1.
The following formula is used to estimate
the noise limiting factor:
=
2
Cf The number of people uncomfortable
by noise/ Total people survey
= 16/ 69 = 23.2% .
0
10
20
30
40
50
60
70
80
90
Unpleasant Acceptable
Percents (%)
23.2%
Fig. 1. Comment of tourists on the noise
from boat engines.
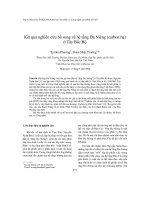
+ Infrastructure limiting factor (
3
Cf
)
The authors used questionnaires for
infrastructure quality assessment. Respondents
chosen for the survey were staff of the tourism
center and tourists. The subjects included the
quality of guest house, hotel and traffic,
difficulties met in waiting house, on boat and in
cave. According to the assessment of tourists
and staff (Fig. 2):
=
3
Cf 11/ 69 = 15.9 %
0
20
40
60
80
100
Good Normal Bad
Percents (%)
15.9
Fig. 2. Infrastructure quality assessment.
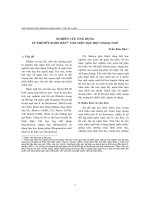
+ Management limiting factor (resources
management and tourism services -
4
Cf )
For capacity of resource use and
management, an attention is paid on the
following issues: scenery management, fresh
water and energy (fuels) supply, waste and
environmental pollution (Fig. 3).
Tran Nghi et al. / VNU Journal of Science, Earth Sciences 23 (2007) 80-87
84
0
10
20
30
40
50
60
Difficult Less difficult Not difficult
Percents (%)
14.3%
Fig. 3. Assessment of resources use
and management capacity.
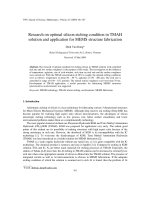
Capacity of tourism service exploitation
and management: service management
includes issuing regulations, rules for business
enterprises, controlling high quality services,
supplying news service activities and
enhancing knowledge of local people about
tourism services (Fig. 4).
0
10
20
30
40
50
Difficult Less difficult Not difficult
Percents (%)
9.5%
Fig. 4. Assessment of tourism service exploitation
and management capacity.
4
Cf is determined by the following equation:
2
1
4
=Cf
(capacity of resource use and
management + service exploitation)
=
2
1
(14.3 + 9.5) = 11.9%
+ Tourist safety limiting factor (
5
Cf ):
According to regulation of Earth Check
TM
(refer to Green Globe 21 – Standard for cave
sightseeing visitors [5]) each group of cave
visitors has maximum 10 to 12 people and 1
tour guide. The number of guides in Phong
Nha Tourism Center is 32 and it is enough to
meet the service demand even in festival days.
Therefore, at present this is not a limiting factor.
The number of visitors on one boat is 13
people (a group of visitors on boat is equivalent
to one group). The exceeding number of visitors
is a factor which can bring risk to the safety of
visitors. Thus,
=
5
Cf 1/12 = 0.083 = 8.3%
The effective real carrying capacity of
Phong Nha cave is:
100
100
100
100
5
1
CfCf
PCCERCC
Ca
−
××
−
×=
= 3354 × 83.6 × 76.8 × 84.1 × 88.1 × 91.7
= 1463 visitors / day (= 43893 visitors / month)
b. Ecotourism forest hiking in the National Park
This tourism service activity is about to be
put in operation. The observed parameters are:
- Length of ecotourism forest hiking route:
14000m.
- Maximum number of tourists in one
group: 15 visitors.
- Average distance between two people: 1m.
- Distance between two groups: 50m.
- Average time for a visit: 6 hours.
- Open period: 7 AM- 16 PM (9 hours).
Let
x
to be the number of groups:
1400050)1(15 =×−+× xx
=
⇒
x
216 groups.
Open period is 9 hours, average time for a
visit is 6 hours, so each visitor just goes
sightseeing one time per day, or 1=Rf .
3240115216
=
×
×
=
PCC
(visitors/ day)
Corrective factors
+ Excessive sunshine (
1
Cf ): June and July are
the two months having the highest average
temperature in the year. At noon (from 11 AM to
14 PM) visitors can hardly walk on the concretized
routes. This can be considered as a limiting factor.
1
M
: 60 days (June and July) × 3 hours (11
AM to 14 PM) = 180 hours.
Mt : 180 days (6 months have sunshine) ×
12 hours = 2160 hours.
Tran Nghi et al. / VNU Journal of Science, Earth Sciences 23 (2007) 80-87
85
Therefore: %33.82160/180/1
1
=== MtMCf
+ Flood season (
2
Cf ): Heavy rains and storms
often occur in September and October affecting
tourists’ sightseeing. Hence, it can be taken as a
limiting factor.
2
M
: 60 days (September and October).
Mt : 365 days (12 months).
Therefore, %44.16365/60/1
2
=== MtMCf .
+ Hiking route limiting factor (
3
Cf
):
According to the assessment of World
Tourism Organization, the route slope of 10
o
or
greater has impact on the traveling speed and
health of tourists. Thus, it is the factor limiting
the tourism capacity. As it is derived from the
topography map, more than 4 km (30% of route
length) has the slope of 10
o
or greater. Thus,
%30
3
=Cf .
+ Wild animal and plant limiting factor (
4
Cf ):
Most kinds of fruits ripen in June and July,
so birds and small animals go to near track
finding food. They will fear and go to another
place when visitors walk into the National
Park. Thus, %44.16365/60
4
==Cf .
From the above assessment, ERCC of
ecotourism forest hiking can be computed as:
y).(visits/da 1450%56.83%70
%56.83%67.913240
=××
×××=
Eco
ERCC
c. Cable car ridding
This type of tourism service activity has
been put in operation in Da Lat, Ninh Thuan,
Yen Tu, Chua Huong, Safety standards are
applied to the cable car route at Phong Nha - Ke
Bang with the similar length.
Design parameters:
- Length of ridding route (one-way): 2500m.
- The number of tourists per cabin: 6 people.
- Average distance between two visitors: 1m.
- Distance between cabins: 50m.
- Average time for route: 15 min.
- Open period: 7 AM- 16 PM (9 hours).
- Cable car moving speed: 1-5m/s.
- Maximum visitors (by design): 1000 - 1200
visitors/hour (or 9000 - 10800 visitors/day).
- The number of cabins: 2500/50 = 50 cabins.
1080015/540650 =××=PCC
visits/day.
Corrective factors
+ Excessive sunshine (
1
Cf ): June and July are
the two months that have the highest average
temperature in the year. At noon (11 AM - 14
PM) visitors are difficult to move by cable cars.
So, %33.82160/180/1
1
=== MtMCf .
+ Flood season (
2
Cf ): September and October
usually have heavy rains and storms to affect
recreation of tourist:
%44.16365/60/1
2
=== MtMCf
+ Safety factor (
3
Cf ): It is designed by safety
standards (O.I.T.A.F), risk probability is
calculated less than 1%, or %1
3
=Cf .
Effective real carrying capacity of cable car
ridding:
y).(visits/da 8190
%99%56.83%67.9110800
=
×××=
CableCar
ERCC
Therefore, real carrying capacity of Phong
Nha - Ke Bang center equals:
nth. visits/mo333000
y visits/da11100
819014501463
=
=
++=
++=
CableCarEcoCaPN
ERCCERCCERCCERCC
3.2. Dong Hoi tourism center
The main tourism activities in Dong Hoi are
beach tour, sightseeing sand bar and ostrich
farmer. The corrective factors are:
Winter season (
1
Cf
):
During winter months (from September to
March next year), the beach is temporarily closed
for a period of 6 months. So,
=
1
Cf 6/12 = 50%.
Excessive sunshine (
2
Cf ):
The period from May to July has the highest
temperature in Quang Binh. At noon (10 AM -
15 PM) in this period, visitors hardly want to go
to the beach.
1
M
: 90 days (May, June, and July) × 5 hours.
Mt
: 180 days × 12 hours.
%8.2012180/590
2
=××=Cf .
Tran Nghi et al. / VNU Journal of Science, Earth Sciences 23 (2007) 80-87
86
Table 1. Beach quality assessment matrix of Dong Hoi
No Beach Tide
Nearshore
Current
Mud/
sand
Thickness
of sand
layer (m)
Slope
(Degree)
Clean
sand
Md/ So
Quality
of sea
water
*
Quality
of beach
1. Bao Ninh + + + + + + + 7/7
2. Nhat Le + + 0 0 + + 0 4/7
3.
North Nhat Le
(Quang Phu)
+ + + 0 + + + 6/7
Notation: "+" Good or suitable quality; "0" Average or no impact quality; "-" Low or unsuitable quality.
Quality of sea water (
3
Cf ):
According to the statistical data obtained by
Coastal Water Quality Monitoring Center
(quarterly data), Department of Environment
and Natural Resource and some coastal
investment projects, concentrations of pollutants
(such at BOD
5
, SS) exceed Vietnamese standard
(TCVN 5942 level B) during period from May to
August. In other areas, almost all indicators are
less than standard. Therefore, quality of sea
water is a corrective factor in Nhat Le.
1
M
: from May to August (120 days).
Mt
: 1 year (365 days).
%88.32365/120
3
==
NL
Cf .
Quality of beach (
4
Cf ):
This factor is assessed by geological criterion
through a matrix table (Table 1).
Safety factor (
5
Cf ):
There exist underwater vortices and sand
bar along the nearshore area of Quang Binh.
Around 10% of the length of the coastal line
was assessed by scientists to have potential risk
for tourists’ safety. Therefore, %10
5
=Cf .
From the above assessment, the
ERCC
of
beach in Dong Hoi center is:
y).(visits/da 71000
27493546838000
=
++=
++=
QPNLBNDH
ERCCERCCERCCERCC
4. Conclusions
The tourism carrying capacity assessment
method used in this article is mainly based on
general equations which proposed by Cifuentes
[2] and Ceballos - Lascurain [3] with a slightly
modification. There are three levels of tourism
carrying capacity: Physical Carrying Capacity
(PCC), Real Carrying Capacity (RCC) and
Effective Carrying Capacity. These three are
reduced into PCC and ERCC by considering
infrastructure and management capacities as
the limiting factors in computation of RCC.
The authors have calculated the tourism
carrying capacity in Dong Hoi and Phong Nha
centers by using the adjustment from PCC to
RCC or ERCC based on various limiting factors.
The obtained results are as follows: i) Dong Hoi
center has the highest tourism carrying
capacity, about 71000 visits per day. The main
tourism activities are beach recreation, sand bar
sightseeing and ecotourism; ii) Phong Nha
National Park has a lower tourism carrying
capacity than other centers in Quang Binh, with
11000 visits per day. There are many tourism
activities in this area such as: cave sightseeing,
adventure tourism, cable car ridding, mountain
climbing, ecotourism forest hiking in National
park, geotop,
Acknowledgements
This paper is completed with the financial
support of Project QGTD-04-03 and Council of
Earth Sciences under the Fundamental Research
Program, Vietnam Ministry of Technology and
Science.
Tran Nghi et al. / VNU Journal of Science, Earth Sciences 23 (2007) 80-87
87
References
[1] Luc Hens, Tourism and Environment, Free
University of Brussels, Belgium, 1998.
[2] A.M. Cifuentes, Determinacion de Capacidad de
Carge Turistica en Areas Protegidas CATIE,
Turrialba, Costa Rica, 1992.
[3] H. Ceballos-Lascurain, Tourism, Ecotourism and
Protected Areas: The state of nature-based tourism
around the world and guidelines for its development,
IUCN, Gland, Switzerland and Cambridge, UK,
1996.
[4] Tran Nghi et al., World natural heritage – Phong
Nha - Ke Bang, Quang Binh, Vietnam, General
Department of Geology and Mineral Resource,
Hanoi, 2003 (in Vietnamese).
[5] Green Globe 21, Travel and Tourism industry
Benchmarking methodologies. Green Globe
International Ecotourism Standard, Australia,
2004.