Tài liệu Public attitudes to inflation and interest rates doc
Bạn đang xem bản rút gọn của tài liệu. Xem và tải ngay bản đầy đủ của tài liệu tại đây (767.86 KB, 9 trang )
148 Quarterly Bulletin 2008 Q2
Introduction
The monetary policy objectives of the Bank of England are to
maintain price stability and subject to that, to support the
Government’s economic policy, including its objectives for
growth and employment. As part of its price stability
objective, the Bank of England is tasked with achieving an
inflation target of 2%, as measured by the annual change in
the consumer prices index (CPI).
Monetary policy is likely to be most effective if people
understand and support this goal. To that end, the Bank uses a
variety of methods to raise public awareness of its monetary
policy objective. For example, the Monetary Policy Committee
(MPC) explains its interest rate decisions in the minutes of its
monthly meetings, supplemented each quarter by the
publication of the Inflation Report. In addition, MPC members
explain their decisions in appearances before parliamentary
committees and in speeches, media interviews and regional
visits. The Bank also promotes the objective of price stability
through its range of educational material for schools and the
general public.
It is easier for monetary policy to achieve its objective of price
stability if households and businesses believe that
policymakers will do so — ie that inflation expectations remain
close to the target in the medium term. Inflation expectations
play a key role in a number of household and business
decisions. First, inflation expectations are important for wage
negotiations. Employees care about their real purchasing
power — the quantity of goods and services that they can buy.
If inflation is expected to be higher, employees may bargain for
higher nominal wage growth to maintain their standard of
living. Second, inflation expectations play a key role in
households’ saving decisions. For a given level of nominal
interest rates, higher expected inflation implies a lower
expected real rate of return on saving. That would tend to
make spending today more attractive relative to saving.
Finally, businesses need to make a judgement on the likely
path of the prices of other goods that they may be competing
with, so that they can judge the likely demand for their
product. If they expect the prices of other goods to be
higher, that may prompt them to raise their own output
prices.
A key risk for monetary policy makers is that inflation
expectations move persistently away from the 2% inflation
target. If that occurred, and those expectations became built
into future wages and prices, there is a risk that inflation would
remain away from the target for longer. Assessing that risk is
difficult, not least because inflation expectations cannot be
observed directly. But a number of measures — such as
surveys of households, businesses and economists, as well as
those derived from the prices of financial market instruments
that are linked to inflation — can act as a guide.
(1)
One
survey the MPC looks at is the Bank/GfK NOP Inflation
Attitudes Survey. This article discusses the latest results from
this survey in more detail. The first section discusses the latest
trends in households’ inflation perceptions and expectations.
A key upside risk to the medium-term outlook for inflation stems from the possibility that a further
period of above-target inflation could lead to persistently elevated inflation expectations.
According to the Bank/GfK NOP survey, households’ expectations for inflation over the next year
have risen markedly. This article focuses on the factors which may have driven the increase, drawing
on the results of some additional questions included in the February 2008 survey. It concludes that
while the latest increases in households’ inflation expectations could be consistent with recent
macroeconomic data, increases in households’ perceptions of current inflation may also have played
some role. The article also summarises the public’s attitudes to interest rates and the conduct of
monetary policy.
(1) For a further discussion of recent movements in a wide range of measures of inflation
expectations, see the box on pages 36–37 of the February 2008 Inflation Report, and
page 36 of the May 2008 Inflation Report.
Public attitudes to inflation and
interest rates
By James Benford of the Bank’s Monetary Assessment and Strategy Division and Ronnie Driver of the Bank’s
Inflation Report and Bulletin Division.
Research and analysis Public attitudes to inflation and interest rates 149
The second section summarises the public’s attitudes to
interest rates and the conduct of monetary policy.
The Bank/GfK NOP survey
The Bank/GfK NOP survey, which was commissioned by the
Bank in 1999, assesses the general public’s perceptions of
inflation over the past year, expectations for inflation over the
next year, views on interest rates and knowledge of the
monetary policy framework. The survey is conducted every
February, May, August and November, and usually samples
around 2,000 individuals. Every February, however, the survey
is more comprehensive, asking a longer list of questions to
around 4,000 people.
Interpreting the results of the questions on inflation
perceptions and expectations is not straightforward. First, the
Bank/GfK NOP survey does not ask about people’s views on a
specific measure of inflation. Rather, it asks about the
evolution of prices of ‘goods and services’. This is designed to
reflect a concept of inflation the general public are likely to be
familiar with, rather than any specific measure of inflation
(such as the CPI inflation rate). As a result, it is not clear which
official measure of inflation, if any, should correspond most
closely to the survey responses.
(1)
Second, the Bank/GfK NOP survey asks respondents for their
expectations of inflation over the next year. Given the lags
inherent in the transmission mechanism of monetary policy,
there will be times when CPI inflation moves away from the
target in the near term. For example, the MPC’s projection,
presented in the May 2008 Inflation Report, was for CPI
inflation to rise further during the remainder of 2008, before
subsequently falling back to settle around the 2% target in the
medium term. As a result, an increase in this short-term
measure of inflation expectations does not necessarily imply
an increase in medium-term inflation expectations. But if
higher near-term inflation expectations were to feed through
into higher wages and prices, that would pose an upside risk to
the inflation outlook in the medium term.
Recent trends in public attitudes to inflation
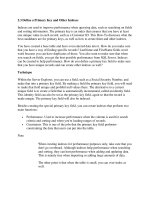
Over the past year, the general public’s perceptions of current
inflation and their expectations of inflation over the next year
have both increased materially. In May 2008, the median
individual’s perception of the current level of inflation was
4.9%, the highest rate since the survey began in November
1999 (Chart 1).
(2)
The median respondent’s expectation
for annual inflation in a year’s time was 4.3%, also a series
high.
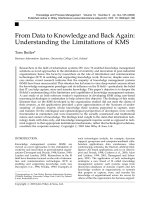
These increases in the median measures of perceptions and
expectations were accompanied by a significant change in the
distribution of responses across households. Compared to
November 2005, just before the Bank/GfK NOP measure of
inflation expectations began to rise, the proportion of
respondents who expected inflation to be above 5% in the
year ahead rose from 10% to around 35% (Chart 2).
As already discussed, this rise in near-term inflation
expectations does not, by itself, provide sufficient evidence to
judge whether inflation expectations will remain persistently
above target in the medium term. Assessing that risk requires
an understanding of what has driven the rise in near-term
(1) Measures of inflation expectations derived from financial market instruments are
explicitly linked to RPI inflation. But given the time-varying wedge between RPI and
CPI inflation, and the fact that market-based measures are influenced by changes in
risk premia and idiosyncratic market factors, these are also difficult to interpret. The
article by Joyce, Sorensen and Weeken on pages 157–66 of this Bulletin, discusses
ways of extracting policy-relevant information from financial market instruments.
(2) For a discussion of how these median measures are estimated, see the box on
page 209 of the 2007 Q2 Quarterly Bulletin.
0
1
2
3
4
5
2000 01 02 03 04 05 06 07 08
Perceptions over the past year
Expectations over
the next year
Percentage changes in prices
Source: Bank/GfK NOP survey.
Chart 1 Bank/GfK NOP median perceptions of current
inflation and expectations for inflation one year ahead
<0
No change
0 to 1
1 to 2
2 to 3
3 to 4
4 to 5
5+
No ide
a
0
10
20
30
40
November 2005
May 2008
Percentage of respondents
Percentage changes in prices
Source: Bank/GfK NOP survey.
Chart 2 Distribution of households’ inflation
expectations one year ahead in Bank/GfK NOP survey
150 Quarterly Bulletin 2008 Q2
inflation expectations. To that end, the next section examines
how households’ inflation expectations are formed, drawing
on the results of some additional questions included in the
February 2008 survey (see the box above).
What drives households’ inflation
expectations?
There are many factors that could shape households’ inflation
expectations. If households are forward looking, understand
the transmission mechanism of monetary policy and believe
that the monetary policy framework is credible, then their
medium-term inflation expectations should be equal to the
inflation target. But, as discussed earlier, owing to the lags
inherent in the transmission mechanism of monetary policy,
inflation can deviate from the target in the near term,
sometimes quite markedly. If monetary policy remains
credible, such that households believe inflation will be at
target in the medium term, forward-looking households’
near-term inflation expectations could increase, without
necessarily posing longer-term risks to the inflation outlook.
But if expectations remain elevated for a prolonged period,
that could pose upside risks to inflation in the medium term.
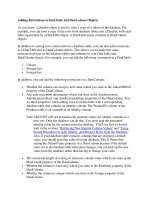
Over the period when households’ inflation expectations have
been rising, both the MPC and external professional
forecasters have also been revising up their one year ahead
inflation projections. As a result, it may be unsurprising that
households’ near-term inflation expectations have picked up.
For example, between February 2007 and May 2008, the
MPC’s central projection for CPI inflation one year ahead
increased by over 1 percentage point, while the households’
measure rose by 1.5 percentage points (Chart 3).
The rise in households’ inflation expectations in the most
recent quarter was somewhat larger than the rise in the MPC’s
Additional questions in the February 2008
Bank/GfK NOP survey
Every quarter, the Bank/GfK NOP survey asks respondents how
they perceive the prices of goods and services to have changed
over the past twelve months, and how they expect prices in
the shops generally to change over the next twelve months.
But these questions on their own do not indicate how
respondents formed these perceptions and expectations. To
gain insight into these issues, the Bank posed additional
questions to some of the respondents in the February 2008
survey. After asking respondents about their perceptions of
inflation over the past year, interviewers asked:
How important were the following things in getting to that
answer?
• Your personal experience of the change in the price of food
and drink.
• Your personal experience of the change in the price of
clothing and footwear.
• Your personal experience of the change in the price of
transport, including the cost of petrol/diesel.
• Your personal experience of the change in the price of
household energy (eg gas, electricity, coal).
• Your personal experience of the change in the cost of
housing (eg mortgage payments, rents).
• Reports on inflation in the media.
• Other factors.
After asking about respondents’ inflation expectations over the
next year, interviewers asked:
How important were the following things in getting to that
answer?
• How prices have changed in the shops in your most recent
visits (ie the past one to six months).
• How prices have changed in the shops over the longer term
(ie the past twelve months or more).
• The current level of interest rates.
• The current strength of the British economy.
• The inflation target set by the Government.
• Reports on the inflation outlook in the media.
• Other factors.
In both questions, respondents were asked whether each
factor was very important, fairly important, not very important
or not important at all. They could also respond ‘don’t know’.
0.5
0.0
0.5
1.0
1.5
2.0
May Aug. Nov. Feb. May Total
since February
2007
Median household’s inflation expectations, one year ahead
MPC central projection for CPI inflation, one year ahead
Percentage points
Quarterly changes
+
–
Sources: Bank of England and Bank/GfK NOP survey.
Chart 3 Revisions to the inflation outlook one year
ahead
Research and analysis Public attitudes to inflation and interest rates 151
central projection for inflation. There are various reasons
why that may be so. For example, the MPC’s central
projection is for a specific measure of inflation (CPI), whereas
households are asked about prices of goods and services in
general.
Alternatively, the greater rise in households’ inflation
expectations may relate to the elevated level of perceptions of
current inflation. If households form their inflation
expectations in a backward-looking way, high perceptions of
current inflation might be expected to push up on their
inflation expectations. According to the Bank/GfK NOP
survey, the median household’s inflation perceptions and
expectations began to rise at the same time (Chart 1). And
analysing the individual survey responses over the past year
confirms that there is a close link between the two. Chart 4
plots each respondent’s perceptions of current inflation
against their expectations for inflation over the next year, with
the width of each bubble corresponding to the proportion of
respondents holding that view. The largest bubbles lie on the
45° line, with around half of the survey respondents since
May 2007 reporting that they expected inflation over the next
twelve months to be the same as they perceived it to have
been over the past twelve months. If rates of inflation increase
further, as the MPC expects, then inflation perceptions may
themselves pick up further.
In practice it may be that some people are forward looking,
while others are more backward looking or use rules of thumb
to form their inflation expectations. In order to interpret the
changes in measures of inflation expectations correctly, it is
important for the MPC to understand whether, on balance,
households are more forward looking or backward looking.
Furthermore, it is also important to know how this balance
may change in light of economic developments. For example,
Brazier et al (2006) present a model in which the proportion of
people who use backward-looking rules of thumb to form their
inflation expectations rises when actual inflation moves away
from the target. They find that such a change in the way
people form their expectations can lead to an increase in the
volatility of inflation.
One of the additional questions posed in the February 2008
survey asked respondents what factors were most important in
forming their expectations. The results suggested that
households’ inflation expectations over the next year were
influenced by a number of factors (Chart 5). Some households
put weight on factors such as the strength of the British
economy, the level of interest rates and the inflation target.
But almost half of the respondents reported that their past
perceptions of inflation, both in recent periods and over a
longer term, played a ‘very important’ role in forming their
inflation expectations. This result suggests that, in order to
understand changes in households’ inflation expectations, it is
important to understand what drives changes in households’
perceptions of current inflation.
What drives households’ perceptions of
current inflation?
When aggregated, movements in households’ perceptions of
current inflation ought to be related to movements in the
official inflation data. Since February 2007 official measures of
inflation have moved in different ways (Chart 6). For example,
0 0–1 1–2 2–3 3–4 4–5 >5<0
0
0–1
1–2
2–3
3–4
4–5
>5
<0
Perceptions of inflation over the past year (per cent)
Expectations of inflation over the next year (per cent)
Sources: Bank/GfK NOP survey and Bank calculations.
(a) Respondents who answered either question ‘No idea’ are excluded. The width of each bubble
represents the proportion of respondents holding that view. As respondents are asked to
select from inflation ranges that typically cover 1 percentage point, some bubbles may be
partly obscured.
Chart 4 Individual views of inflation perceptions and
expectations, May 2007 to May 2008
(a)
0
10
20
30
40
50
Perceptions of inflation
over the past six months
Perceptions of inflation over
the past twelve months or more
Strength of the
British economy
Current level of
interest rates
Inflation target
Media reports
Other
Percentage of respondents
Source: Bank/GfK NOP survey.
(a) Based on an additional question asked in the February 2008 survey. Respondents could
select more than one option.
Chart 5 Factors cited as ‘very important’ in forming
households’ inflation expectations over the next year
(a)
152 Quarterly Bulletin 2008 Q2
both CPI and RPIX inflation fell during the middle of 2007, but
have since picked up again, while RPI inflation fell in the first
half of 2007 and has since remained broadly constant.
These differences partly reflect the way these measures of
inflation are calculated, and partly the composition of the
indices.
(1)
By contrast, households’ inflation perceptions have
picked up over this period, from 2.9% in February 2007 to
4.9% in May 2008.
This section discusses three factors that might account for the
divergence between official measures of inflation and
households’ perceptions of current inflation: differences in
households’ experiences of inflation; recent price changes,
particularly for frequently purchased items; and discussions in
the media.
(a) Differences in households’ experiences of inflation
Different households are likely to experience different rates of
inflation. That partly reflects the fact that the inflation rates of
different items vary considerably (Chart 7). For example,
petrol prices have risen by around 20% over the past year,
while the price of audio-visual equipment has fallen by around
15% over the same period. Furthermore, expenditure patterns
will differ markedly from household to household, for example
with factors such as age, income and household size.
Combined with the dispersion in individual inflation rates, that
is likely to mean that households can experience markedly
different inflation rates.
The aggregate RPI, RPIX and CPI data are based on the changes
in the price of a basket of goods and services, designed to
reflect the expenditure pattern of the representative
household. By contrast, the Bank/GfK NOP estimate of
inflation perceptions is a median measure. As a result, changes
in the survey measure of perceptions of current inflation might
not necessarily relate directly to changes in the official
inflation data.
(b) Recent price changes
It is possible that, when reporting their perceptions of current
inflation, households put more weight on those price changes
that they have observed recently. In that case, three-monthly
(as opposed to annual) inflation rates may be more useful in
explaining households’ perceptions of inflation. One way to
assess this is to use a simple regression technique to estimate
the relationship between recent price changes and survey
measures of inflation perceptions. These regressions take the
form:
(1)
where
π
p
t
is the Bank/GfK NOP median inflation perception
over the past year at time t,
α
is a constant,
π
t
is a seasonally
adjusted measure of three-month changes in prices at time t,
and
ε
t
is an error term. The swathe in Chart 8 shows the
range of fitted values from three such regressions, which use
the three-month change in CPI, RPI and RPIX to try to explain
changes in households’ inflation perceptions.
(2)
The results
show that recent inflation rates can explain some, but not all,
of the pickup in inflation perceptions, suggesting that other
factors are also playing a role.
(3)
One explanation may be that households place more weight
on the price changes of certain, more frequently purchased
goods and services. For example, Driver and Windram (2007)
παβπβπ βπ βπ ε
t
p
tt t tt
=+ + + + +
−− −1213243
6
4
2
0
2
4
6
8
1997 98 99 2000 01 02 03 04 05 06 07 08
CPI
Median (50th percentile)
Percentage changes on a year earlier
+
–
(a) The limits of the dark band in the chart are the 35th and 65th percentiles of that distribution.
The pair of lighter bands include a further 30% of the items in the basket, so that the entire
coloured region includes 60% of the items in the basket.
Chart 7 Distribution
(a)
of price changes of
subcomponents of the CPI
(1) For example, the CPI index is not directly influenced by changes in house prices, and
the RPI index includes the effect of mortgage interest payments. Information on how
the official measures of inflation rates are calculated can be found at
www.statistics.gov.uk/downloads/theme_economy/CPI_Technical_Manual.pdf.
(2) The right-hand side variables in equation (1) are based on the three-month change in
CPI, RPI and RPIX inflation in the month before the Bank/GfK NOP survey was taken.
(3) These three-monthly inflation rates can also explain more of the recent pickup in
inflation perceptions than the equivalent annual inflation rates.
0
1
2
3
4
5
6
2000 01 02 03 04 05 06 07 08
Per cent
CPI
RPI
RPIX
Perceptions of current inflation
Sources: Bank/GfK NOP survey and ONS.
Chart 6 Inflation perceptions and annual CPI, RPI and
RPIX inflation rates
Research and analysis Public attitudes to inflation and interest rates 153
showed how the Bank/GfK NOP measure of perceptions of
current inflation was better correlated with food and energy
price inflation than with the aggregate CPI measure. And
the responses to one of the additional questions in the
February 2008 survey confirmed that food, transport
and energy prices were particularly important in
determining households’ perceptions of current inflation
(Chart 9).
In recent months there have been significant increases in oil,
wholesale gas and food prices — the inflation rates of these
goods have been significantly above their historical averages
(Table A). As a result, the particularly rapid inflation rates of
these goods may have had a disproportionate impact on
households’ perceptions of current inflation.
(c) Discussions in the media
Around a quarter of respondents to the February 2008 survey
cited media reports as being a ‘very important’ factor
influencing their perceptions of current inflation (Chart 9).
Increased media coverage could, by encouraging the spread of
information, lead to a better understanding of inflation, and
better anchored expectations (Carroll (2001)). But rising
media coverage of recent and prospective changes in inflation
could also have contributed to the rise in households’
perceptions of current inflation.
Over the past year there has been an increase in the number of
articles discussing energy, food and house prices (Chart 10).
These prices were all cited by some households as being ‘very
important’ in forming their perceptions of current inflation.
This increase in the number of news stories about the inflation
rates of these individual items could explain part of the rise in
aggregate inflation perceptions.
0
1
2
3
4
5
2000 01 02 03 04 05 06 07 08
Per cent
Median perceptions of inflation
over the past year
Range of fitted values
(a)
Sources: Bank/GfK NOP survey and Bank calculations.
(a) The swathe shows the difference between the maximum and minimum fitted values from
three regressions (of median perceptions of current inflation on current and past lags of
three-monthly changes in CPI, RPI and RPIX) at each point in time.
Chart 8 Explaining Bank/GfK NOP perceptions with
three-monthly inflation rates
0
10
20
30
40
50
60
70
80
Household
energy
Transport,
including
petrol
Food/
drink
Cost of
housing
(b)
Clothing and
footwear
Media
reports
Other
Percentage of respondents
Source: Bank/GfK NOP survey.
(a) Based on an additional question asked in the February 2008 survey. Respondents could
select more than one option.
(b) For example, mortgage payments or rents.
Chart 9 Factors cited as ‘very important’ in forming
households’ perceptions of inflation over the past year
(a)
Table A Food, fuel, household energy and CPI inflation
Per cent
Annual change Three-monthly change
(a)
Apr. 2008 Average Apr. 2008 Average
since 2003 since 2003
CPI inflation 3.0 1.9 1.4 0.5
Foods and non-alcoholic drinks (10.6%)
(b)
6.6 2.3 2.1 0.7
Fuels and lubricants (3.2%)
(b)
18.7 6.3 1.6 1.9
Electricity, gas and other fuels (3.1%)
(b)
8.3 10.4 13.9 2.8
Sources: ONS and Bank calculations.
(a) Based on CPI indices which have been seasonally adjusted by Bank staff.
(b) The figures in parentheses show the 2008 weights in the CPI basket.
0
10
20
30
40
50
60
70
80
90
100
1988 90 92 94 96 98 2000 02 04 06 08
Food prices
Energy prices
House prices
Number of headlines
Source: © 2007 Factiva, Inc. All rights reserved.
(a) Six-month moving average. Based on searches designed to count the number of headlines
referring to food, energy and house prices, but where possible exclude headlines referring to
non-UK inflation. Newspapers included in the search are the Daily Express, the Daily Mail, the
Daily Mirror, the Daily Star, The Daily Telegraph, the Financial Times, The Guardian, The
Independent, The Independent on Sunday, The Mail on Sunday, the News of the World, The
Observer, The People,The Sun, the Sunday Mirror, The Sunday Telegraph, The Sunday Times and
The Times.
Chart 10 Media discussions of price changes
(a)
154 Quarterly Bulletin 2008 Q2
One drawback of this type of analysis is that looking at the
total number of stories does not distinguish between articles
that refer to prices rising as opposed to falling. Chart 11 shows
that, excluding articles discussing house prices, the number of
articles referring to rising prices fell back in the early part of
2007, before picking up again towards the end of 2007 and
into 2008. That pattern is similar to the profile for CPI and
RPIX inflation over that period. By contrast the number of
articles referring to falling prices is little changed compared to
a year ago. So it remains plausible that media discussions of
rising prices have continued to influence households’
perceptions of current inflation, at least to a degree.
Conclusion on inflation expectations
The Bank/GfK NOP measure of households’ inflation
expectations rose to a series high in May 2008. This increase
in inflation expectations could be consistent with recent
macroeconomic data, which have prompted the MPC and
other forecasters to revise up their expectations of inflation
one year ahead. However, there is evidence to suggest that a
significant proportion of households appear to form inflation
expectations on a backward-looking basis — around half of the
respondents over the past year reported inflation expectations
that were in the same range as their perceptions of current
inflation. Since 2007, reported perceptions of current inflation
have increased by more than can be explained by movements
in the official headline inflation measures. This may reflect
differences in individual households’ inflation experiences,
households putting greater weight on more recent price
changes (eg the increases in household energy costs), or an
increase in media reporting on food and energy price inflation.
Households’ perceptions of current inflation and expectations
of inflation one year ahead are also likely to affect their
attitudes to interest rates and satisfaction with the Bank. The
remainder of this article considers these in turn.
Attitudes to interest rates
The Bank/GfK NOP survey assesses the extent to which
households are aware of changes in interest rates, by asking
‘how would you say interest rates on things such as
mortgages, bank loans and savings have changed over the past
twelve months?’. Historically, the net balance of respondents
who reported that they had perceived interest rates to have
risen over the past year has moved in a similar way to the
annual changes in the effective (average) borrowing and
savings rates facing households. For example, the net balance
picked up during 2006; remained little changed in 2007;
and subsequently fell back, to lower levels in February and
May 2008 (Chart 12). That suggests that households have a
reasonably good understanding of how interest rates have
changed over the past year.
The survey also asks respondents how they expected interest
rates on mortgages, bank loans and savings to change over the
next year. On balance, households have never predicted a fall
in interest rates. But previous Bank analysis (Driver and
Windram (2007)) has suggested that households are
nonetheless reasonable judges of future turning points in
interest rates. Between February 2007 and February 2008
there was a large fall in the net balance of households
expecting interest rates to rise (Chart 13). That is consistent
with financial market participants’ expectations for official
interest rates, which were also revised down over that period.
However, the net balance expecting rates to increase over the
next year picked up again in May 2008. That may reflect the
increase in the general public’s inflation expectations.
0
10
20
30
40
Jan. July Jan. July Jan. July Jan.
Number of headlines
Articles referring to rising prices
Articles referring to falling prices
2005 06 07 08
Source: © 2007 Factiva, Inc. All rights reserved.
(a) Six-month moving average. Excludes articles referring to house prices. The sample of
newspapers used is listed in footnote (a) of Chart 10.
Chart 11 Media discussions of rising and falling prices
(a)
80
60
40
20
0
20
40
60
80
100
2000 01 02 03 04 05 06 07 08
160
120
80
40
0
40
80
120
160
200
Basis point changes on a year earlier Net percentage balance
(a)
Effective rate on stock
of borrowing
(c)
(left-hand scale)
Perceived changes in interest rates over the
past year (right-hand scale)
Effective rate on stock
of savings
(b)
(left-hand scale)
+
–
+
–
Sources: Bank of England and Bank/GfK NOP survey.
(a) The net balance is constructed by subtracting the percentage who thought rates had gone
down from the percentage who thought they had gone up.
(b) Weights together the household time and sight deposit effective stock rates by the
outstanding balances.
(c) Weights together the household secured and unsecured borrowing effective stock rates by
the outstanding balances.
Chart 12 Interest rate perceptions and movements in
household interest rates
Research and analysis Public attitudes to inflation and interest rates 155
The survey also asks respondents what path for interest rates
they think would be best for the British economy (Question 7)
and for themselves personally (Question 8). Over the past year
there has been a marked increase in the proportion of
respondents who believe that it would be best for the
economy if interest rates were lower. The results to
Question 8 also suggest that the majority of respondents who
expressed a view thought that it would be best for them
personally if rates were lower.
Question 10 asks respondents if they would prefer higher
interest rates to try to keep inflation down or lower rates and
higher inflation, and is now only posed in the February surveys.
In February 2008, the proportion of respondents who
preferred higher rates fell to 52%, the lowest rate since
May 2000. But there was also a significant rise in the
proportion of respondents who replied that they had ‘no idea’.
That may reflect heightened uncertainty among some
households about how the recent developments in financial
and energy markets are likely to affect the economic outcomes
they care most about — such as prices, employment and
output growth.
Attitudes to monetary policy and satisfaction
with the Bank
The Bank/GfK NOP survey includes a series of questions
assessing the general public’s understanding of the
inflation-targeting regime. For example, Question 3 asks
whether Britain’s economy would be stronger or weaker as a
result of higher inflation. Since 2005, the proportion of
respondents who thought that higher inflation would make the
economy weaker started to increase, reaching 70% in
May 2008, up from an average of around 55% during 2007
(Chart 14). The relationship between perceptions of inflation
over the past year and the perceived impact of a higher
inflation rate on the British economy (shown in Chart 14)
suggests that households may think that a given increase in
inflation has a larger effect when their perceptions of current
inflation are elevated. Alternatively, households might find it
easier to identify with the costs of higher inflation when they
have just experienced a higher inflation rate.
Question 14 asks whether participants are satisfied with the
way the Bank of England is doing its job to set interest rates in
order to control inflation. Over the past few years, the
majority of respondents have been satisfied with the Bank.
But since 2005, the net balance of respondents satisfied with
the Bank has been falling gradually, and is now at its lowest
level since February 2000 (Chart 15).
There are several possible explanations for the fall in the
satisfaction balance. Historically, those households who have
reported higher perceptions of inflation or perceived rises in
80
60
40
20
0
20
40
60
80
100
2000 01 02 03 04 05 06 07 08
Net percentage balances
(a)
Perceptions of changes in interest rates over
the past year
Expectations of changes in interest rates over
the next year
+
–
Source: Bank/GfK NOP survey.
(a) The net percentage balances are constructed by subtracting the percentage who thought
rates had gone/would go down from the percentage who thought they had gone/would go
up.
Chart 13 Perceptions and expectations of changes in
interest rates
0
10
20
30
40
50
60
70
80
2000 01 02 03 04 05 06 07 08
0
1
2
3
4
5
Median perceptions of inflation over the past year
(left-hand scale)
‘If prices started to rise faster than they do now that would
make the British economy weaker’ (right-hand scale)
Percentage of respondentsPer cent
Source: Bank/GfK NOP survey.
Chart 14 Households’ views on the impact of higher
inflation on the British economy
100
80
60
40
20
0
20
40
60
80
100
2000 01 02 03 04 05 06 07 08
0
1
2
3
4
5
Per cent Net percentage balances
(a)
Median perceptions of inflation
over the past year
(left-hand scale)
Perceived changes in interest rates
over the past year (right-hand scale)
Net satisfaction with the Bank
(right-hand scale)
+
–
Source: Bank/GfK NOP survey.
(a) The net percentage balances are constructed by subtracting the percentage who thought
rates had gone down from the percentage who thought they had gone up, and by subtracting
the percentage who were fairly or very dissatisfied with the Bank from the percentage who
were fairly or very satisfied.
Chart 15 Public satisfaction with the Bank of England
References
Brazier, A, Harrison, R, King, M and Yates, T (2006), ‘The danger of
inflating expectations of macroeconomic stability: heuristic switching
in an overlapping generations monetary model’, Bank of England
Working Paper no. 303.
Carroll, C (2001), ‘The epidemiology of macroeconomic
expectations’, NBER Working Paper no. 8695.
Driver, R and Windram, R (2007), ‘Public attitudes to inflation and
interest rates’, Bank of England Quarterly Bulletin, Vol. 47, No. 2,
pages 208–23.
Joyce, M, Sorensen, S and Weeken, O (2008), ‘Recent advances in
extracting policy-relevant information from market interest rates’,
Bank of England Quarterly Bulletin, Vol. 48, No. 2, pages 157–66.
156 Quarterly Bulletin 2008 Q2
interest rates, have been, on average, less satisfied with the
Bank (Chart 16). Interestingly, respondents who perceive
inflation to be less than 1% reported the highest level of
satisfaction with the Bank, suggesting that households are
more concerned about high inflation than about low inflation.
So the fall in the net satisfaction balance since 2005 may at
least in part reflect the pickup in interest rate and inflation
perceptions over that period. But concerns about the
economic and financial outlook may also have played a
role.
Conclusion
The results of the Bank/GfK NOP surveys show that
households’ inflation expectations have risen significantly
since February 2007. So long as people still expect the MPC to
meet the 2% CPI target over the medium term then the
monetary policy implications of higher short-term inflation
expectations are limited. But if any of the recent increase in
inflation expectations were built into higher wages and prices,
inflation could persist above the target for longer.
The latest rise in households’ inflation expectations could be
consistent with recent macroeconomic data, which have
prompted economic forecasters, including the MPC, to revise
up their near-term inflation projections. However, there is
some evidence to suggest that a significant proportion of
households appear to form inflation expectations on a
backward-looking basis. Households’ perceptions of current
inflation have also picked up sharply over the past year, and by
more than can be explained by movements in the official
headline inflation measures alone. That divergence may be
partly explained by differences in individual households’
experiences of inflation, the price rises of particular, frequently
purchased items such as food and energy, and an increase in
media discussions of rising prices.
The net percentage balance of respondents reporting higher
interest rates over the past year fell. That was consistent with
the profile of annual changes in the household effective
borrowing and savings rates. Between February 2007 and
February 2008, the net balance expecting higher interest rates
over the next year fell sharply. But in the May 2008 survey the
net balance bounced back slightly. Nonetheless, the majority
of respondents thought that it would be best for the economy
if interest rates were lower.
Although the majority of respondents continued to report that
they were satisfied with how the Bank of England is setting
interest rates to meet the inflation target, the net balance who
were satisfied declined further over the past year. Part of that
decline may reflect higher households’ inflation perceptions
over that period, although some part of it may reflect concerns
about the near-term economic outlook.
0
10
20
30
40
50
60
70
<1% 1% to 3% 3%+ Fallen No
change
Risen
Net percentage balance
(b)
Inflation perceptions
over the past year
Interest rate perceptions
over the past year
Sources: Bank/GfK NOP survey and Bank calculations.
(a) Data based on the individual responses to the Bank/GfK NOP survey in February 2001, 2002
and every quarter since February 2003.
(b) The net percentage balance is constructed by subtracting the percentage who were fairly or
very dissatisfied with the Bank from the percentage who were fairly or very satisfied.
Chart 16 Public satisfaction with the Bank of England by
inflation and interest rate perceptions
(a)