Tài liệu Báo cáo khoa học: Comparison of membrane fraction proteomic profiles of normal and cancerous human colorectal tissues with gel-assisted digestion and iTRAQ labeling mass spectrometry pptx
Bạn đang xem bản rút gọn của tài liệu. Xem và tải ngay bản đầy đủ của tài liệu tại đây (525.06 KB, 11 trang )
Comparison of membrane fraction proteomic profiles of
normal and cancerous human colorectal tissues with
gel-assisted digestion and iTRAQ labeling mass
spectrometry
Jinn-Shiun Chen
1,2
, Kuei-Tien Chen
3
, Chung-Wei Fan
2,4
, Chia-Li Han
5
, Yu-Ju Chen
5
, Jau-Song Yu
6
,
Yu-Sun Chang
7
, Chih-Wei Chien
5
, Chien-Peng Wu
5
, Ray-Ping Hung
3
and Err-Cheng Chan
3
1 Department of Surgery, Chang Gung Memorial Hospital, Tao Yuan, Taiwan
2 College of Medicine, Chang Gung University, Tao Yuan, Taiwan
3 Department of Medical Biotechnology and Laboratory Science, Chang Gung University, Tao Yuan, Taiwan
4 Department of Colorectal Surgery, Chang Gung Memorial Hospital, Keelung, Taiwan
5 Institute of Chemistry, Academia Sinica, Taipei, Taiwan
6 Department of Cell and Molecular Biology, Chang Gung University, Tao Yuan, Taiwan
7 Molecular Medicine Research Center, Chang Gung University, Tao Yuan, Taiwan
Introduction
Colorectal cancer (CRC) remains one of the most
prevalent cancers in the western world and the third
highest cause of cancer mortality in Taiwan [1]. CRC
is thought to evolve into invasive cancer from adeno-
Keywords
biomarker; colorectal cancer; mass
spectrometry; membrane protein; proteomic
profile
Correspondence
E C. Chan, Department of Medical
Biotechnology and Laboratory Science,
Chang Gung University, 259 Wen-Hua 1st
Road, Kweishan, Taoyuan, Taiwan, China
Fax: +886 3 2118741
Tel: +886 3 2118800 (ext. 5220)
E-mail:
Note
Jinn-Shiun Chen, Kuei-Tien Chen and
Chung-Wei Fan contributed equally to this
article
(Received 12 January 2010, revised 9 April
2010, accepted 17 May 2010)
doi:10.1111/j.1742-4658.2010.07712.x
The aim of this study was to uncover the membrane protein profile differ-
ences between colorectal carcinoma and neighboring normal mucosa from
colorectal cancer patients. Information from cellular membrane proteomes
can be used not only to study the roles of membrane proteins in fundamen-
tal biological processes, but also to discover novel targets for improving
the management of colorectal cancer patients. We used solvent extraction
and a gel-assisted digestion method, together with isobaric tags with related
and absolute quantitation (iTRAQ) reagents to label tumoral and adjacent
normal tissues in a pairwise manner (n = 8). For high-throughput quantifi-
cation, these digested labeled peptides were combined and simultaneously
analyzed using LC-MS ⁄ MS. Using the shotgun approach, we identified a
total of 438 distinct proteins from membrane fractions of all eight patients.
After comparing protein expression between cancerous and corresponding
normal tissue, we identified 34 upregulated and eight downregulated pro-
teins with expression changes greater than twofold (Student’s t-test,
P < 0.05). Among these, the overexpression of well-established biomarkers
such as carcinoembryonic antigens (CEACAM5, CEACAM6), as well as
claudin-3, HLA class I histocompatibility antigen A-1, tapasin and mito-
chondrial solute carrier family 25A4 were confirmed by western blotting.
We conclude that gel-assisted digestion and iTRAQ labeling MS is a poten-
tial approach for uncovering and comparing membrane protein profiles of
tissue samples that has the potential to identify novel biomarkers.
Abbreviations
CEA, carcinoembryonic antigen-related cell adhesion molecule 5; CLDN, claudin; CLDN3, claudin-3; CLDN4, cluadin-4; CRC, colorectal
carcinoma; HLA, human leukocyte antigen; HLA-A1, HLA class I histocompatibility antigen A-1; iTRAQ, isobaric tags with related and
absolute quantitation; SLC25A4, mitochondrial solute carrier family 25A4; TAPBP, tapasin.
3028 FEBS Journal 277 (2010) 3028–3038 ª 2010 The Authors Journal compilation ª 2010 FEBS
matous polyps by acquired mutations in various genes
[2]. Development from adenoma into carcinoma takes
5–15 years, and there is therefore plenty of opportu-
nity for early intervention. Approximately half of
patients diagnosed with colorectal cancer die within
5 years of diagnosis, although an early diagnosis sig-
nificantly improves patients’ outcomes. Unfortunately,
few biomarkers are available for CRC analyses and
none is sufficiently sensitive for screening purposes [3].
Therefore, it is of great interest to identify proteins
whose levels are consistently altered in CRC, both to
improve the diagnosis and monitoring of CRC patients
and because their function may reveal insight into
critical events in tumorigenesis.
Various proteomic technologies have been used to
search for new biomarkers in colorectal cancer [4–10].
There is increasing interest in sample prefractionation
to reduce proteome complexity and gain deeper insight
into the proteome. This strategy is particularly useful
for low-abundance proteins such as membrane pro-
teins. Membrane proteins account for 30% of the
proteome and play critical roles in many biological
functions such as cell signaling, cell–cell interactions,
communication, transport mechanisms and energy [11].
Information from membrane proteomes will help us
understand the role of these proteins in fundamental
biological processes, and it may also help us discover
novel targets for biomedical therapeutics to improve
patient management during pathogenesis [12]. Thus,
global analysis of membrane proteins in CRC may
provide an important source of diagnostic or prognos-
tic markers such as carcinoembryonic antigen-related
cell adhesion molecule 5 (CEA).
Although high-throughput proteomic technologies
can provide comprehensive analyses of soluble proteins,
the analysis of membrane proteins has lagged behind
because of their low concentration and high hydropho-
bicity. New tools and strategies are needed so that
membrane fractions from cancer cells can be screened
for candidate biomarkers. In this study, we utilized a
technology combining gel-assisted digestion, isobaric
tags with related and absolute quantitation (iTRAQ)
labeling and LC-MS ⁄ MS for quantitative analysis of
the membrane proteome of colorectal tissue. In brief,
membrane proteins were solubilized with various types
of detergents at high concentrations and subsequently
incorporated into polyacrylamide gels without electro-
phoresis. Excess detergent was removed prior to protein
digestion so that it would not interfere with the LC-
MS ⁄ MS analysis. In addition, we also utilized a recently
developed and widely used multiplexed quantitation
strategy based on iTRAQ isobaric reagents [13–15]. The
iTRAQ labeling strategy offers enhanced identification
confidence and quantitation accuracy for proteomic
research, especially for low-abundance proteins [16,17].
We used iTRAQ labeling together with gel-assisted
digestion and mass spectrometry to detect differences
in the protein expression profiles of membrane frac-
tions from tumoral and adjacent normal mucosa from
colorectal cancer patients. Differentially expressed pro-
teins were identified by mass spectrometry and verified
by western blotting. Initial validation studies confirmed
the expression of claudin-3 (CLDN3) as a tumor-asso-
ciated antigen in colorectal cancer. We also uncovered
some candidates, such as HLA class I histocompatibil-
ity antigen A-1 (HLA-A1), tapasin (TAPBP) and mito-
chondrial solute carrier family 25A4 (SLC25A4), as
potential biomarkers for monitoring CRC.
Results
Quantitative analysis of membrane proteins from
paired tumoral and adjacent normal tissue of
CRC patients
A total of eight tumor tissues and eight matched normal
tissues were collected from eight CRC patients (Table
S1) and protein expression was compared between each
tumor and adjacent normal tissue using LC-MS ⁄ MS
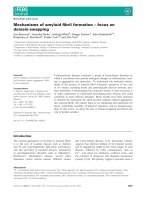
analysis (Fig. 1). In our previous study using the same
proteomic platform, quantitation of four independently
purified membrane fractions from HeLa cells gave high
accuracy (< 8% error) and precision (< 12% relative
SD), demonstrating a high degree of consistency and
reproducibility of this quantitation platform [18]. We
used the same quantitative strategy to enhance identifi-
cation confidence and quantitation accuracy for proteo-
mic research. A total of 438 proteins from both the
tumor and normal tissue of eight patients was identified
(false discovery rate = 2.25%). Figure 1 illustrates the
flowchart for quantitative analysis of membrane pro-
teins of the CRC samples and reveals 215, 299, 191 and
208 proteins from four 4-plex iTRAQ LC-MS ⁄ MS
experiments, respectively. Statistical analysis of the
expression level from eight CRC patients revealed
changes in the expression of 42 proteins by more than
twofold within 95% confidence levels (Student’s t-test;
P < 0.05) of individual variation. Among the 42 identi-
fied proteins, 34 were upregulated and eight were down-
regulated (Table S2).
Differential protein expression analysis in CRC
with hierarchical clustering
Cluster analysis was performed on our identified
proteins to evaluate the relation between deregulated
J S. Chen et al. Profiles of membrane fractions from CRC patients
FEBS Journal 277 (2010) 3028–3038 ª 2010 The Authors Journal compilation ª 2010 FEBS 3029
proteins and colorectal tissue samples and to identify
interesting protein expression clusters. We initially
uncovered 438 proteins from eight CRC patients and
estimated their expression by comparing tumor tissues
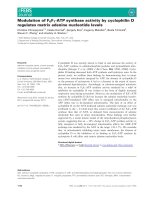
with adjacent normal tissues. By using a hierarchical
clustering analysis, a clear distinction of expression
patterns enabled the clustering of these proteins into
several characteristic profiles, which split the 438
proteins into two main clusters: either upregulated (in
red) or downregulated (in green) (Fig. 2). In cluster
group 1, six proteins were notably downregulated in
tumor tissues, including collagen I alpha-1 chain
()3.3-fold, P < 0.001), collagen I alpha-2 chain
()2.5-fold, P < 0.001), biglycan ()1.7-fold,
P = 0.12), mimecan ()2.1-fold, P < 0.05), actin of
aortic smooth muscle ()2.0-fold, P < 0.05) and myo-
sin-11 ()1.7-fold, P = 0.11). In cluster group 2, 46
proteins were notably upregulated in tumor tissues,
including isoform 1 of surfeit locus protein 4 (2.8-
fold, P < 0.05), ITGB2, VDAC1, ADP ⁄ ATP translo-
case 1 (SLC25A4; 2-fold, P < 0.05), HLA-A1,
VDAC2 and VDAC3, among others. Using cluster
analysis with hierarchical partitioning of the expres-
sion profiles of identified proteins, the results from
cluster groups 1 and 2 confirmed 73.8% (31 ⁄ 42) of
the previously selected differentially expressed proteins
(more than twofold within 95% confidence levels nof
individual variation; Table S2) and added other inter-
esting candidates, such as cytochrome c oxidase sub-
unit 7C, NADH-ubiquinone oxidoreductase chain 4
or microsomal glutathione S-transferase 3 as possible
CRC markers. For many of these proteins, there was
a remarkable homogeneity of upregulated or down-
regulated expression across the eight pairs of CRC
samples. Moreover, there were different cluster groups
of proteins with less uniform patterns across the eight
patients.
Functional classification of proteins
identified in CRC
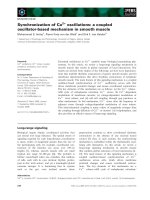
Proteins identified by mass spectrometry were classified
by subcellular location and molecular function
(Fig. 3). To better understand the probable roles of
the membrane proteomes in terms of their biological
functions, the subcellular localization and molecular
functions of the 438 identified proteins were classified
using the gene ontology (GO) consortium. The subcel-
lular locations of these proteins are shown in Fig. 3A.
We analyzed a total of 438 proteins, and 51% were
found to be membrane bound or membrane associ-
ated. Among these, 27% were shown to be in the
plasma membrane, including CEACAM5, CEACAM6,
VDAC1, VDAC3, isoform 1 of tapasin (TAPBP),
SLC25A4, HLA-A1, CLDN3, ITGB2, Galectin-3 and
keratin type II cytoskeletal 8, and 24% were shown to
be in organelle membranes (mitochondria or mem-
brane-bound vesicles), including SEC11C, VDAC2 and
cytochrome c oxidase subunit I. It is unclear whether
the differentially identified mitochondrial proteins are
related to the disease or whether they are sampling
artifacts. Another 17% were shown to be in the extra-
cellular space, including biglycan, collagen III alpha-1
Purification of membrane proteins from
adjacent non-tumor (N) and Tumor (T)
tissues of CRC patients
Gel-assisted digestion
iTRAQ labeling
LC-MS/MS analysis
Dataset A
Dataset B
90 27
25
9
19
30952
23
223
78
18
22
10
Dataset C
Dataset D
iTRAQ Quantitation by Multi-Q
A-1
A-1
B-1
N T N T N T N T
B-2 D-1 D-2
114 115 116 117
114 115 116 117
114 115
116 117
114 115 116 117
A-2 C-1 C-2
N T
N T N T N T N T
N T N T N T N T N T N T N T
A-2 B-1 B-2 C-1 C-2 D-1 D-2
Fig. 1. Methods for LC-MS ⁄ MS analysis and evaluation of
database search results. Schematic describing the mixing of four
samples separately labeled with an iTRAQ tag onto the same run,
followed by simultaneous identification and quantification for data
analysis.
Profiles of membrane fractions from CRC patients J S. Chen et al.
3030 FEBS Journal 277 (2010) 3028–3038 ª 2010 The Authors Journal compilation ª 2010 FEBS
chain, S100A8 and S100A9. Figure 3B shows the
molecular function categorization of the proteins iden-
tified in CRC patients. Regarding major molecular
functions, the proteins were mostly associated with
binding functions (29.9%; S100A8, Galectin-3, keratin
type II cytoskeletal 8), transporter activity (17.1%;
VDAC1, VDAC2, VDAC3, TAPBP, SLC25A4) and
catalytic activity (12.8%; cathepsin G, mitochondrial
cytochrome c1 heme protein, component of pyruvate
dehydrogenase complex mitochondrial precursor). A
small number of proteins were also found associated
with structural molecule activity (collagen I alpha-1
chain, collagen I alpha-2 chain, tubulin beta chain),
molecular transducer activity (ITGB2, interferon-
induced transmembrane protein 1, integrin alpha-6 and
integrin alpha-M), signal transducer activity (S100A9,
HLA-A1, CLDN3) and motor activity. For a few
proteins (19.4%), no molecular function has yet been
annotated.
Validation of differentially expressed proteins in
CRC patients by western blotting
To further validate the results obtained from the rela-
tive comparative expression studies with LC-MS ⁄ MS,
we examined the expression status of several of the
identified proteins using western blotting. These repre-
sentative proteins were selected based on changes of
more than twofold in in their expression within the
95% confidence level (Student’s t-test; P < 0.05) of
individual variation. In cases where the antibodies
were suitable for western blotting, we tested their reac-
tivity with CRC samples as a means of verification.
Protein extracts from normal and tumoral tissues from
another 16 patients were resolved by SDS ⁄ PAGE
and blotted onto poly(vinylidene difluoride)
membranes (Table S2). Figure 4 shows a representative
compilation of immunoblotting for these proteins.
These representative proteins included CLDN3,
COL1A1
COL1A2
BGN
OGN
ACTA2
SURF4
PRG2
SEC11C
GPSN2
STT3A
S100A8
ITGB2
TSPAN8
VDAC1
HLA-DRA
TRAM1
LBR
TMEM109
ANXA4
SLC25A4
HLA-A1
SLC25A6
SLC25A5
AT P5 H
COX7C
ATP5F1
MT-ND4
MT-CO2
MT-ND2
COX5B
MT-ATP6
COX4l1
CLDN3
MTCH2
ATP1B1
SLC25A24
MT-CO1
ATP2A2
SSR1
ZCD1
NNT
SLC25A1
SQRDL
MGST3
TA PB P
ATP5J2
AT P5 L
VDAC3
VDAC2
PHB2
PHB
MYH11
Fig. 2. Clustering analysis of colorectal can-
cer samples. The 438 proteins expressed in
the eight CRC patients were classified into
two main groups via hierarchical clustering
analysis.
J S. Chen et al. Profiles of membrane fractions from CRC patients
FEBS Journal 277 (2010) 3028–3038 ª 2010 The Authors Journal compilation ª 2010 FEBS 3031
HLA-A1, SLC25A4 and TAPBP. The results of the
western blot analysis in the tumoral and normal tissues
confirmed the LC-MS ⁄ MS results. The expression
levels of CLDN3, HLA-A1 and SLC25A4 were signifi-
cantly higher in tumor compartment from CRC
patients (P < 0.05). The protein expression of TAPBP
Unknown
13%
A
B
Cytoplasm
11%
Nucleus
3%
Cytoskeleton
5%
Extracellular space
17%
Organelle
membrane
24%
Binding
(29.9%)
(12.8%)
(5.9%)
(1.4%)
(3.7%)
(9.8%)
(17.1%)
(19.4%)
Catalytic activity
Molecular transducer activity
Signal transducer activity
Structual molecule activity
Transporter activity
Unknown
0204060
Number of identified proteins
80 100 120 140
Motor activity
Plasma membrane
27%
Fig. 3. Classification of the identified pro-
teins. (A) Subcellular localization. (B) Molec-
ular function classification of identified
proteins from CRC patients. Classification
and annotation were performed using the
Ingenuity Pathway Analysis Knowledge
Base and Gene Ontology (GO) consortium.
A
250
B
248
B
246
B
247
C
245
C
232
D
260
D
326
B
336
B
338
B
339
C
345
C
360
C
363
D
374
D
403
NT NT NT NT NT NT NT NT NT NT NT NT NT NT NT NT
B
251
B
248
B
132
B
247
C
252
C
245
D
260
D
319
B
344
B
357
B
367
B
373
C
385
C
395
D
404
D
422
NT NTNT NT NT NT NTNT NT NT N
T
NT N T NT NT NT
B
251
B
246
B
248
B
132
C
232
C
234
D
260
D
325
A
352
B
355
B
370
B
378
C
380
C
387
D
389
D
411
NT N
T
NT N T N T NT N T NT N T NT N
T
NT NT NT NT
NT
B
246
140
120
100
80
60
40
Density (CLDN3/actin)
20
0
120
100
80
60
40
Density (TAPBP/actin)
20
0
120
140
100
80
60
40
Density (HLA-A1/actin)
20
Normal Tumor Normal TumorNormal TumorNormal Tumor
0
120
140
P < 0.05
P < 0.05
P = 0.2
P < 0.05
ACTIN
SLC25A4
ACTIN
HLA-A1
ACTIN
TAPBP
ACTIN
CLDN3
100
80
60
40
Density (SLC25A4/actin)
20
0
B
247
B
248
B
132
C
252
C
245
D
306
D
325
A
361
B
368
B
384
B
390
C
393
C
410
D
421
D
424
NT N
T
NT N T NT NT N T NT
NT
NT
N
T
NT
NT
NT
NT
NT
Fig. 4. Expression levels of CLDN3, HLA-A1, TAPBP and SLC25A4 in CRC samples as measured by western blotting. In total, 16 pairs of
tissue samples including tumor tissue (T) and matched normal tissues (N) were examined. Actin was used as a loading control.
Profiles of membrane fractions from CRC patients J S. Chen et al.
3032 FEBS Journal 277 (2010) 3028–3038 ª 2010 The Authors Journal compilation ª 2010 FEBS
was still differential, although less pronounced. TAP-
BP was upregulated in 12 of 16 CRC samples, but
downregulated or not obviously changed between
tumoral and matched normal samples in another four
tissue pairs. Upregulation of CEA was not analyzed
by immunoblot analysis. However, it has been
unequivocally demonstrated in several earlier studies,
using immunohistochemistry and immunoassays, that
CEA expression is significantly elevated in neoplastic
epithelium when compared with matched normal
mucosa, and this was confirmed by our iTRAQ label-
ing MS analysis. These results demonstrate that some
of the proteins identified by LC-MS ⁄ MS could serve
as potential markers in future studies of CRC.
Discussion
This study was aimed at identifying membrane pro-
teins differentially expressed between colorectal cancer
and normal tissue. We utilized iTRAQ labeling RPLC-
MS ⁄ MS to explore the membrane protein profiles in
paired CRC tissue samples. A commonly used strategy
is multidimensional chromatography, where a first
dimension, usually the strong cation-exchange chroma-
tography, is combined with the second dimension
RP-HPLC. However, the limited amount of membrane
proteins extracted (5 lgÆsample
)1
, a total of 20 lg for
an iTRAQ analysis) from precious colorectal tissues
restricted the use of fractionation prior to MS analysis.
In our method, we decided to analyze the sample
directly by RPLC-MS ⁄ MS three times to obtain a con-
fident protein identification result. Using the iTRAQ
labeling mass spectrometry, a total of 438 proteins
were identified by our proteomic platform.
To better understand the roles of these identified
proteins, they were grouped and analyzed according to
their possible pathogenic roles. The clustering and
molecular functions of the identified proteins can
provide clues about their roles in the pathogenesis of
CRC. In general, factors that contribute to the patho-
genesis of CRC include the accumulation of mutations
and the deregulation of gene expression. Of particular
interest is the fact that a significant number of the pro-
teins identified as differentially upregulated in tumor
tissues may be functionally involved in the CRC
tumorigenesis. Several clinically well-known biomar-
kers, such as CEACAM 5 and 6, were overexpressed
in tumor tissues, compared with the matched normal
colorectal tissues in our study. Although CEA is not
an adequate screening tool for colorectal cancer
patients, the assessment of CEA levels for prognosis
has been shown to be an important variable in predict-
ing postoperative outcomes. Data from studies on
postoperative colorectal cancer patients have demon-
strated that measurement of CEA every 3 months for
at least 3 years is a valuable and cost-effective compo-
nent of follow-up [3].
Our findings are in line with the results of several
proteomics analyses. Alfonso et al. used a 2D-DIGE
based approach to detect differentially expressed mem-
brane proteins of colorectal cancer tissues. An impor-
tant implication of the study is the conclusion that
annexin A2, annexin A4 and VDAC appear as poten-
tial markers of interest for colorectal cancer diagnosis
[19]. A recent report detecting the changes of protein
profiles associated with the process of colorectal
tumorigenesis to identify specific protein markers for
early colorectal cancer detection and diagnosis or as
potential therapeutic targets. VDAC1, annexin A2 and
Keratin 8 variant have been identified [20]. Madoz-
Gurpide et al. tested seven potential markers (ANXA3,
BMP4, LCN2, SPARC, SPP1, MMP7 and MMP11)
for antibody production and ⁄ or validation. ANXA3
was confirmed to be overexpressed in colorectal
tumoral tissues [7]. Kim et al. [21] analyzed CRC
tissues using 2D difference in-gel electrophoresis on a
narrow-range IPG strip and suggested S100A8 and
S100A9 as candidates for serological biomarkers in
combination with other serum markers that aid CRC
diagnosis. Using our strategy combining gel-assisted
digestion, iTRAQ labeling and LC-MS ⁄ MS analysis,
identical or similar proteins were identified, including
VDAC1, VDAC2, VDAC3, ANXA4 (2.5-fold, P <
0.05), ANXA5 (6.5-fold, P < 0.05), S100A8 (9.5-fold,
P < 0.05) and S100A9 (8.5-fold, P < 0.05).
In addition to the well-known biomarkers and colo-
rectal cancer-associated proteins such as CEA, CEA-
CAM 6, VDAC and ANXA4, we identified several
other proteins that may be potential novel markers for
monitoring CRC but have not been unequivocally
associated with colorectal carcinoma. Overexpression
of CLDN3, HLA-A1, TAPBP and SLC25A4 in
colorectal cancer has not been prominently reported,
and there is interest in developing these proteins as
diagnostic and prognostic markers for this disease. In
western blotting analysis, CLDN3, HLA-A1 and
SLC25A4 showed the best discriminatory power
between tumoral and normal tissue. Our data provide
important clues for the identification of differentially
expressed membrane-associated proteins in CRC, and
uncover several avenues for study of their roles in
CRC carcinogenesis. Some of their functional roles
and implications in CRC are discussed below.
CLDN3 was highly expressed in cancer tissues when
tested by LC-MS ⁄ MS and western blotting. CLDN3
belongs to the claudin (CLDN) family, which consists
J S. Chen et al. Profiles of membrane fractions from CRC patients
FEBS Journal 277 (2010) 3028–3038 ª 2010 The Authors Journal compilation ª 2010 FEBS 3033
of 23 proteins that are essential for the formation of
tight junctions in epithelial and endothelial cells [22].
Specifically, CLDN1, -3, -4, -5, -7, -10 and -16 have
been found to be altered in various cancers [23]. Over-
expression of these proteins in cancer is unexpected,
but recent work suggests that claudins may be involved
in the survival of and invasion by cancer cells [24,25].
In addition, because claudins are surface proteins, they
may represent useful targets for various therapeutic
strategies. Interestingly, Clostridium perfringens entero-
toxin is a ligand for CLDN3 and CLDN4 proteins,
and binding of the toxin to these claudins leads to
rapid cytolysis of cells [26]. Preclinical studies have
suggested that Clostridium perfringens enterotoxin may
be effective against CLDN3- and CLDN4-expressing
malignancies [27,28]. In our study, we found that over-
expression of CLDN3 is significantly associated with
CRC. In a previous study, CLDN3 expression was
analyzed in 12 adenocarcinoma tissues and their paired
normal mucosa, and was shown to be upregulated 1.5-
fold in CRC [29]. It would be worthwhile to further
elucidate the value of this protein as a diagnostic
and ⁄ or prognostic marker for CRC and to further
understand its role in the survival and ⁄ or invasion in
CRC cancer cells.
SLC25A4 was also significantly increased in CRC
tissues compared with matched normal tissues. The
solute carrier family 25 (SLC25) consists of proteins
that are functionally and structurally related and that
construct the transporters of a large variety of mole-
cules [30]. Following LC-MS ⁄ MS and western blotting
analyses, SLC25A4 showed differential expression
between tumor and normal tissues. This protein could
be a valuable diagnostic marker or a target for moni-
toring patients’ conditions.
HLA-A1 was highly expressed in cancer tissues
when tested by LC-MS ⁄ MS and western blot methods.
Expression of human leukocyte antigen (HLA) class I
presenting tumor-associated antigens on the tumor cell
surface is considered to be a prerequisite for effective
T-lymphocyte activation [31]. As a consequence, HLA
class I antigens can be downregulated or lost on malig-
nant cells, and these variations may be associated with
a poor prognosis [32,33].
In our study, expression of HLA-A1, determined by
LC-MS ⁄ MS and western blotting, was upregulated in
colorectal cancer in comparison with normal tissues.
Although these results may appear controversial, only
a few studies have reported the clinical impact of HLA
class I expression in colorectal cancer, with contrasting
results. Some studies have shown no significant corre-
lation between staining intensity of HLA class I
expression and survival [34,35], whereas others found
that HLA class I expression correlated with the prog-
nosis of CRC patients [36,37].
TAPBP may upregulate the expression of HLA
class I molecules, and it was found to be upregulated
in cancer tissues in this study using LC-MS ⁄ MS and
western blotting. TAPBP plays multiple roles in the
peptide-loading complex; it stabilizes the complex, aids
in the appropriate selection of peptides, maintains
appropriate HLA class I redox status and enhances
TAP and HLA class I levels [38,39].
In summary, the strategy combining gel-assisted
digestion and iTRAQ labeling LC-MS ⁄ MS has proven
to be a potential means of identifying proteins in the
membrane fraction from CRC tumoral samples. Some
of the representative candidates, such as CLDN3,
HLA-A1 and SLC25A4, appear to be promising mark-
ers for the detection of colorectal cancer.
Materials and methods
Materials
Monomeric acrylamide ⁄ bisacrylamide solution (40%,
29 : 1) was purchased from Bio-Rad (Hercules, CA, USA).
Trypsin (modified, sequencing grade) was obtained from
Promega (Madison, WI, USA). The BCA and Bradford
protein assay reagent kits were obtained from Pierce (Rock-
ford, IL, USA). SDS was purchased from GE Healthcare
(Central Plaza, Singapore). Ammonium persulfate and
N,N,N¢,N¢-tetramethylenediamine were purchased from
Amersham Pharmacia (Piscataway, NJ, USA). EDTA was
purchased from Merck (Darmstadt, Germany). Tris(2-carb-
oxyethyl)-phosphine hydrochloride, triethylammonium
bicarbonate, Na
2
CO
3
, NaCl, sucrose, magnesium chloride
hexahydrate (MgCl
2
), Hepes, methyl methanethiosulfonate,
trifluoroacetic acid and HPLC-grade acetonitrile were pur-
chased from Sigma-Aldrich (St Louis, MO, USA). Formic
acid was purchased from Riedel de Haen (Seelze, Ger-
many). Water was obtained from Milli-Q
Ò
Ultrapure Water
Purification Systems (Millipore, Billerica, MA, USA).
Patients and tumors
Clinical tissue samples from 56 patients with colorectal can-
cer were taken from freshly isolated surgical resections in
the operating room at the Chang Gung Memorial Hospital,
Tao Yuan, Taiwan. Malignant tissue (determined by
pathological assessment) and adjacent normal tissue were
prepared from the same resection. All formalin-fixed
paraffin-embedded tumor blocks from equivalent specimens
from the same tumor tissue were inspected for quality and
tumor content, and a single representative tumor block
from each case, containing at least 70% neoplastic cells,
was selected for the study. Normal tissue was obtained
Profiles of membrane fractions from CRC patients J S. Chen et al.
3034 FEBS Journal 277 (2010) 3028–3038 ª 2010 The Authors Journal compilation ª 2010 FEBS
from the distal edge of the resection at least 10 cm from
the tumor. Written informed consent from all respective
patients was obtained before surgery in accordance with
medical ethics and approval by Human Clinical Trial Com-
mittee at Chang Gung Memorial Hospital. A total of eight
tissue pairs containing tumoral and adjacent normal tissue
were collected and analyzed by gel-assisted digestion and
iTRAQ labeling MS. Other tissue pairs were utilized to ver-
ify potential targets from the above-mentioned LC-MS ⁄ MS
analysis. Patients who had received any chemo- and ⁄ or
radiotherapeutic treatment before surgery were excluded
from this study.
Isolation of membrane proteins from tumoral
and adjacent normal tissues
After surgery, paired tumoral and adjacent normal tissues
were obtained from the same CRC patient and stored at
)80 °C. Frozen tissues were unfrozen rapidly in a 37 °C
water bath, washed with 0.9% (w ⁄ v) NaCl solution to
remove blood, resuspended in STM solution (5 gÆmL;
0.25 m sucrose, 10 mm Tris ⁄ HCl, 1 mm MgCl
2
) with pro-
tease inhibitors (protein : protein inhibitor = 100 : 1, v ⁄ v)
and homogenized with a homogenizer (Polytron System PT
1200 E, Luzernerstrasse, Switzerland). The nuclei were
removed by centrifugation at 260 g for 5 min at 4 °C, and
the postnucleus supernatant was centrifuged at 1500 g for
10 min at 4 ° C. The pellet was mixed with two-thirds the
original homogenate volume of a 0.25 m STM solution con-
taining protease inhibitors and resuspended in a homoge-
nizer with three strokes of the loose-fitting pestle followed
by one stroke of the tight-fitting pestle (Kimble ⁄ Kontes,
Vineland). The resulting solution was centrifuged at
12 000 g for 1 h at 4 °C to pellet the membrane proteins.
The pellet was washed twice with 1 mL of ice-cold 0.1 m
Na
2
CO
3
(pH 11.5), dissolved in 50 lL of 90% (v ⁄ v) formic
acid to determine the membrane protein concentration by
Bradford assay, and then vacuum dried to obtain a mem-
brane pellet for subsequent proteolysis reactions.
Digestion of membrane proteins
Purified membrane proteins were subjected to gel-assisted
digestion [18]. In detail, the membrane protein pellet was
resuspended in 50 lLof6m urea, 5 mm EDTA and 2%
(w ⁄ v) SDS in 0.1 m triethylammonium bicarbonate and
incubated at 37 °C for 30 min until completely dissolved.
Proteins were chemically reduced by adding 1.28 lLof
200 mM Tris(2-carboxyethyl)-phosphine and alkylated by
adding 0.52 lL of 200 mm methyl methanethiosulfonate at
room temperature for 30 min. To incorporate proteins into
a gel directly in an Eppendorf vial, 18.5 lL of acrylam-
ide ⁄ bisacrylamide solution (40%, v ⁄ v, 29 : 1), 2.5 lLof
10% (w ⁄ v) ammonium persulfate, and 1 lL of 100%
N,N,N¢,N¢-tetramethylenediamine was applied to the
membrane protein solution. The gel was cut into small
pieces and washed several times with 1 mL of triethylam-
monium bicarbonate containing 50% (v ⁄ v) acetonitrile. The
gel samples were further dehydrated with 100% acetonitrile
and then completely dried by SpeedVac. Proteolytic diges-
tion was then performed with trypsin (protein ⁄ trypsin =
10 : 1, g ⁄ g) in 25 mm triethylammonium bicarbonate with
incubation overnight at 37 °C. Peptides were extracted from
the gel using sequential extraction with 200 lLof25mm
triethylammonium bicarbonate, 200 lL of 0.1% (v ⁄ v)
trifluoroacetic acid in water, 200 lL of 0.1% (v ⁄ v) trifluo-
roacetic acid in acetonitrile and 200 lL of 100% acetoni-
trile. The solutions were combined and concentrated in a
SpeedVac.
iTRAQ labeling and LC-ESI MS/MS analysis
To label peptides with the iTRAQ reagent (Applied Biosys-
tems, Foster City, CA, USA), one unit of label (defined as
the amount of reagent required to label 100 lg of protein)
was thawed and reconstituted in ethanol (70 lL) by vor-
texing for 1 min. The resulting peptides from the normal
tissue of one patient were labeled with iTRAQ
114
and pep-
tides from tumor tissue of the same patient were labeled
with iTRAQ
115
. The resulting peptides from normal tissue
of another patient were labeled with iTRAQ
116
and pep-
tides from tumor tissue were labeled with iTRAQ
117
and
incubated at room temperature for 1 h. The same proce-
dures were performed in the peptides from nontumor and
tumor tissues of the remaining patients. Labeled peptides
(5 lg each) were then pooled, vacuum dried and resus-
pended in 0.1% (v ⁄ v) trifluoroacetic acid (40 l L) for
further desalting and concentration using Oasis
Ò
HLB
uElution (Waters Corporation, Milford, MA, USA).
All MS ⁄ MS experiments for peptide identification were
performed using a Waters nanoACQUITY UPLC pump
system and a Waters Q-Tof premier mass spectrometer
(Waters Corp.) equipped with a nano-ESI source. The
nanoUPLC system used an aqueous mobile phase
(buffer A) containing 0.1% formic acid in water and an
organic mobile phase (buffer B) containing 0.1% (v ⁄ v)
formic acid in acetonitrile. Desalting of the samples was
performed for 1.5 min with 99% buffer A using a C
18
trapping column (5 lm, 20 mm · 180 lm id; Waters
Corp.). Samples were separated using a Waters ACQUI-
TYÔ BEH C
18
Column (1.7 lm, 250 mm · 75 lm; Waters
Corp.) at 300 nLÆmin
)1
using a 120 min gradient.
During each LC injection, the mass spectrometer was
operated in ESI positive V mode with a resolving power of
10 000. The voltage applied to produce an electrospray was
2.85 kV and the cone voltage was 35 eV. Argon was intro-
duced as a collision gas and the collision flow rate was
0.35 mLÆmin
)1
. Data acquisition was operated in the data
directed analysis mode. This mode included a full MS scan
(m ⁄ z 400–1600, 0.6 s) and an MS ⁄ MS scan (m ⁄ z 100–1990,
J S. Chen et al. Profiles of membrane fractions from CRC patients
FEBS Journal 277 (2010) 3028–3038 ª 2010 The Authors Journal compilation ª 2010 FEBS 3035
1.2 s each scan) sequentially on the three most intense ions
present in the full scan mass spectrum. Mass accuracy was
calibrated with a synthetic human [Glu
1
]-Fibrinopeptide B
solution (500 fmolÆlL
)1
) due to the use of a NanoLock-
Spray source and sampled every 30 s. The collision energies
were used to fragment each peptide ion on the basis of its
mass-to-charge (m ⁄ z) values.
Data processing and analysis
For protein identification, data files from LC-MS ⁄ MS were
searched against the non-redundant International Protein
Index human sequence database v3.29 [40] (68 161
sequences) from the European Bioinformatics Institute
using the mascot algorithm (v2.2.1, Matrix Science, Lon-
don, UK). Peak lists were generated and processed using
mascot distiller v2.1.1.0 (Matrix Science). Search param-
eters for peptide and MS ⁄ MS mass tolerance were
± 0.1 Da and ± 0.1 Da, respectively, with allowance for
two missed cleavages made from the trypsin digest and var-
iable modifications of deamidation (Asn, Gln), oxidation
(Met), iTRAQ (N-terminal), iTRAQ (Lys) and methyl
methanethiosulfonate (Cys). Only proteins with a protein
identification confidence interval of > 95% were confi-
dently assigned. When unique peptides were identified to
multiple members of a protein family, proteins with the
highest sequence coverage were selected from the mascot
search output. To evaluate the false discovery rate, we
repeated the searches against a random database using
identical search parameters and validation criteria.
For protein quantitation, we used multi-q [41] software
to analyze the iTRAQ data. Raw data files from the Waters
Q-Tof premier mass spectrometer were converted into files
of mzXML format using masswolf (Institute for Systems
Biology, Seattle, WA, USA), and the search results in
mascot were exported in the xml data format. After the
data conversions, multi-q selected unique iTRAQ-labeled
peptides with confident MS ⁄ MS identification (mascot
score ‡ 40), detected signature ions (m ⁄ z = 114, 115, 116,
117), and performed automated quantitation of peptide
abundance. For the detector dynamic range filter, signature
peaks with ion counts < 30 were filtered out by multi-q.
To calculate protein ratios, the ratios of quantified unique
iTRAQ peptides were weighted according to their peak
intensities to minimize the standard deviation. The final
protein quantitation results were exported to an output file
in csv data format.
Clustering analysis
A total of 438 identified proteins were clustered based on
normal Euclidean distance between them and average link-
age. The treeview program was used to observe the hierar-
chical partitioning of expression profiles of identified
proteins.
Annotations
For subcellular localization and molecular function annota-
tions, all the proteins identified in this study were analyzed
using the Ingenuity Pathway Analysis Knowledge Base
( and gene ontology (GO) con-
sortium [42].
Western blot and statistical analysis
Immunoblots of selected proteins were performed using
tissue lysates from both tumoral and adjacent normal
samples to confirm the LC-MS ⁄ MS findings. In total, tissue
lysates from another patients with CRC were examined by
immunoblotting. Briefly, each tissue sample was mixed with
electrophoresis sample buffer containing 2% SDS and 5%
2-mercaptoethanol and boiled for 5 min. Proteins were
separated by electrophoresis on 12% denaturing polyacryl-
amide gels and transferred to poly(vinylidene difluoride)
membranes. These blots were blocked with 5% skim milk
and then probed with the appropriate primary antibody
(claudin-3 antibody; Abcam, Cambridge, MA, USA;
SLC25A4 mAb, Abnova, Taipei, Taiwan; HLA Class 1 A1
antibody, Abcam; Tapasin antibody, Abcam) at a dilution
of 1 : 1000 for 2 h, followed by incubation for 1 h with
peroxidase-conjugated secondary antibody at room temper-
ature. The blots were visualized by ECL and then exposed
to Kodak biomax light films. The immunoblot images were
acquired by Imagemaster (Amersham Pharmacia Biotech,
NJ, USA). The protein level of each band was quantified by
densitometry and analyzed with multi gauge version
2.0
software (Fuji PhotoFilm, Tokyo, Japan). Data were
analyzed by an unpaired t-test using the statistical
software spss ⁄ windows
11.0 statistical package (SPSS
Inc, Chicago, IL, USA). P values of < 0.05 were
considered statistically significant.
Acknowledgements
This work was supported by grants (CMRPD160097
and CMRPG371431) from Chang Gung University
and Memorial Hospital, Taiwan.
References
1 Chen LT & Whang-Peng J (2004) Current status of
clinical studies for colorectal cancer in Taiwan. Clin
Colorectal Cancer 4, 196–203.
2 Kinzler KW & Vogelstein B (1996) Lessons from
hereditary colorectal cancer. Cell 87, 159–170.
3 Locker GY, Hamilton S, Harris J, Jessup JM, Kemeny
N, Macdonald JS, Somerfield MR, Hayes DF & Bast
RC Jr (2006) ASCO 2006 update of recommendations
for the use of tumor markers in gastrointestinal cancer.
J Clin Oncol 24, 5313–5327.
Profiles of membrane fractions from CRC patients J S. Chen et al.
3036 FEBS Journal 277 (2010) 3028–3038 ª 2010 The Authors Journal compilation ª 2010 FEBS
4 Friedman DB, Hill S, Keller JW, Merchant NB, Levy
SE, Coffey RJ & Caprioli RM (2004) Proteome analysis
of human colon cancer by two-dimensional difference
gel electrophoresis and mass spectrometry. Proteomics
4, 793–811.
5 Roblick UJ, Hirschberg D, Habermann JK, Palmberg
C, Becker S, Kruger S, Gustafsson M, Bruch HP,
Franzen B, Ried T et al. (2004) Sequential proteome
alterations during genesis and progression of colon
cancer. Cell Mol Life Sci 61, 1246–1255.
6 Alfonso P, Nunez A, Madoz-Gurpide J, Lombardia L,
Sanchez L & Casal JI (2005) Proteomic expression anal-
ysis of colorectal cancer by two-dimensional differential
gel electrophoresis. Proteomics 5, 2602–2611.
7 Madoz-Gurpide J, Lopez-Serra P, Martinez-Torrecuad-
rada JL, Sanchez L, Lombardia L & Casal JI (2006)
Proteomics-based validation of genomic data: applica-
tions in colorectal cancer diagnosis. Mol Cell Proteo-
mics 5, 1471–1483.
8 Roessler M, Rollinger W, Mantovani-Endl L, Hagmann
ML, Palme S, Berndt P, Engel AM, Pfeffer M, Karl J,
Bodenmuller H et al. (2006) Identification of PSME3 as a
novel serum tumor marker for colorectal cancer by com-
bining two-dimensional polyacrylamide gel electrophore-
sis with a strictly mass spectrometry-based approach for
data analysis. Mol Cell Proteomics 5, 2092–2101.
9 Kim H, Kang HJ, You KT, Kim SH, Lee KY, Kim TI,
Kim C, Song SY, Kim HJ, Lee C et al. (2006) Suppres-
sion of human selenium-binding protein 1 is a late event
in colorectal carcinogenesis and is associated with poor
survival. Proteomics 6, 3466–3476.
10 Madoz-Gurpide J, Canamero M, Sanchez L, Solano J,
Alfonso P & Casal JI (2007) A proteomics analysis of
cell signaling alterations in colorectal cancer. Mol Cell
Proteomics 6, 2150–2164.
11 Wallin E & von Heijne G (1998) Genome-wide analysis
of integral membrane proteins from eubacterial,
archaean, and eukaryotic organisms. Protein Sci 7,
1029–1038.
12 Wu CC & Yates JR III (2003) The application of mass
spectrometry to membrane proteomics. Nat Biotechnol
21, 262–267.
13 Bisle B, Schmidt A, Scheibe B, Klein C, Tebbe A, Kel-
lermann J, Siedler F, Pfeiffer F, Lottspeich F & Oester-
helt D (2006) Quantitative profiling of the membrane
proteome in a halophilic archaeon. Mol Cell Proteomics
5, 1543–1558.
14 Ross PL, Huang YN, Marchese JN, Williamson B,
Parker K, Hattan S, Khainovski N, Pillai S, Dey S,
Daniels S et al. (2004) Multiplexed protein quantitation
in Saccharomyces cerevisiae using amine-reactive isobaric
tagging reagents. Mol Cell Proteomics 3, 1154–1169.
15 Zieske LR (2006) A perspective on the use of iTRAQ
reagent technology for protein complex and profiling
studies. J Exp Bot 57, 1501–1508.
16 Hu J, Qian J, Borisov O, Pan S, Li Y, Liu T, Deng L,
Wannemacher K, Kurnellas M, Patterson C et al.
(2006) Optimized proteomic analysis of a mouse model
of cerebellar dysfunction using amine-specific isobaric
tags. Proteomics 6, 4321–4334.
17 Aggarwal K, Choe LH & Lee KH (2005) Quantitative
analysis of protein expression using amine-specific
isobaric tags in Escherichia coli cells expressing rhsA
elements. Proteomics 5, 2297–2308.
18 Han CL, Chien CW, Chen WC, Chen YR, Wu CP,
Li H & Chen YJ (2008) A multiplexed quantitative
strategy for membrane proteomics: opportunities for
mining therapeutic targets for autosomal dominant
polycystic kidney disease. Mol Cell Proteomics 7,
1983–1997.
19 Alfonso P, Canamero M, Fernandez-Carbonie F,
Nunez A & Casal JI (2008) Proteome analysis of
membrane fractions in colorectal carcinomas by using
2D-DIGE saturation labeling. J Proteome Res 7 ,
4247–4255.
20 Bi X, Lin Q, Foo TW, Joshi S, You T, Shen HM, Ong
CN, Cheah PY, Eu KW & Hew CL (2006) Proteomic
analysis of colorectal cancer reveals alterations in meta-
bolic pathways: mechanism of tumorigenesis. Mol Cell
Proteomics 5, 1119–1130.
21 Kim HJ, Kang HJ, Lee H, Lee ST, Yu MH, Kim H &
Lee C (2009) Identification of S100A8 and S100A9 as
serological markers for colorectal cancer. J Proteome
Res 8, 1368–1379.
22 Tsukita S & Furuse M (2000) Pores in the wall: clau-
dins constitute tight junction strands containing aque-
ous pores. J Cell Biol 149, 13–16.
23 Morin PJ (2005) Claudin proteins in human cancer:
promising new targets for diagnosis and therapy. Can-
cer Res 65, 9603–9606.
24 Kominsky SL, Argani P, Korz D, Evron E, Raman V,
Garrett E, Rein A, Sauter G, Kallioniemi OP &
Sukumar S (2003) Loss of the tight junction protein
claudin-7 correlates with histological grade in both
ductal carcinoma in situ and invasive ductal carcinoma
of the breast. Oncogene 22, 2021–2033.
25 Agarwal R, D’Souza T & Morin PJ (2005) Claudin-3
and claudin-4 expression in ovarian epithelial cells
enhances invasion and is associated with increased
matrix metalloproteinase-2 activity. Cancer Res 65,
7378–7385.
26 Katahira J, Sugiyama H, Inoue N, Horiguchi Y,
Matsuda M & Sugimoto N (1997) Clostridium
perfringens enterotoxin utilizes two structurally related
membrane proteins as functional receptors in vivo.
J Biol Chem 272, 26652–26658.
27 Long H, Crean CD, Lee WH, Cummings OW & Gabig
TG (2001) Expression of Clostridium perfringens
enterotoxin receptors claudin-3 and claudin-4 in
prostate cancer epithelium. Cancer Res 61, 7878–7881.
J S. Chen et al. Profiles of membrane fractions from CRC patients
FEBS Journal 277 (2010) 3028–3038 ª 2010 The Authors Journal compilation ª 2010 FEBS 3037
28 Kominsky SL, Vali M, Korz D, Gabig TG, Weitzman
SA, Argani P & Sukumar S (2004) Clostridium perfrin-
gens enterotoxin elicits rapid and specific cytolysis of
breast carcinoma cells mediated through tight junction
proteins claudin 3 and 4. Am J Pathol 164, 1627–1633.
29 de Oliveira SS, de Oliveira IM, De Souza W & Mor-
gado-Diaz JA (2005) Claudins upregulation in human
colorectal cancer. FEBS Lett 579, 6179–6185.
30 Pebay-Peyroula E, Dahout-Gonzalez C, Kahn R,
Trezeguet V, Lauquin GJ & Brandolin G (2003) Struc-
ture of mitochondrial ADP ⁄ ATP carrier in complex
with carboxyatractyloside. Nature 426, 39–44.
31 Wallich R, Bulbuc N, Hammerling GJ, Katzav S, Segal
S & Feldman M (1985) Abrogation of metastatic prop-
erties of tumour cells by de novo expression of H-2K
antigens following H-2 gene transfection. Nature 315 ,
301–305.
32 Cormier JN, Panelli MC, Hackett JA, Bettinotti MP,
Mixon A, Wunderlich J, Parker LL, Restifo NP, Ferro-
ne S & Marincola FM (1999) Natural variation of the
expression of HLA and endogenous antigen modulates
CTL recognition in an in vitro melanoma model. Int J
Cancer 80, 781–790.
33 Kageshita T, Hirai S, Ono T, Hicklin DJ & Ferrone S
(1999) Down-regulation of HLA class I antigen-process-
ing molecules in malignant melanoma: association with
disease progression. Am J Pathol 154, 745–754.
34 Moller P, Koretz K, Schlag P & Momburg F (1991)
Frequency of abnormal expression of HLA-A,B,C and
HLA-DR molecules, invariant chain, and LFA-3
(CD58) in colorectal carcinoma and its impact on
tumor recurrence. Int J Cancer Suppl 6, 155–162.
35 Moller P, Momburg F, Koretz K, Moldenhauer G,
Herfarth C, Otto HF, Hammerling GJ & Schlag P
(1991) Influence of major histocompatibility complex
class I and II antigens on survival in colorectal carci-
noma. Cancer Res 51, 729–736.
36 Menon AG, Morreau H, Tollenaar RA, Alphenaar E,
Van Puijenbroek M, Putter H, Janssen-Van Rhijn CM,
Van De Velde CJ, Fleuren GJ & Kuppen PJ (2002)
Down-regulation of HLA-A expression correlates with
a better prognosis in colorectal cancer patients. Lab
Invest 82, 1725–1733.
37 Watson NF, Ramage JM, Madjd Z, Spendlove I, Ellis
IO, Scholefield JH & Durrant LG (2006) Immunosur-
veillance is active in colorectal cancer as downregulation
but not complete loss of MHC class I expression corre-
lates with a poor prognosis. Int J Cancer 118, 6–10.
38 Lehner PJ, Surman MJ & Cresswell P (1998) Soluble
tapasin restores MHC class I expression and function in
the tapasin-negative cell line .220. Immunity 8, 221–231.
39 Garbi N, Tiwari N, Momburg F & Hammerling GJ
(2003) A major role for tapasin as a stabilizer of the
TAP peptide transporter and consequences for MHC
class I expression. Eur J Immunol 33, 264–273.
40 Kersey PJ, Duarte J, Williams A, Karavidopoulou Y,
Birney E & Apweiler R (2004) The International
Protein Index: an integrated database for proteomics
experiments. Proteomics 4, 1985–1988.
41 Lin WT, Hung WN, Yian YH, Wu KP, Han CL, Chen
YR, Chen YJ, Sung TY & Hsu WL (2006) Multi-Q: a
fully automated tool for multiplexed protein
quantitation. J Proteome Res 5, 2328–2338.
42 Ashburner M, Ball CA, Blake JA, Botstein D, Butler
H, Cherry JM, Davis AP, Dolinski K, Dwight SS,
Eppig JT et al. (2000) Gene ontology: tool for the
unification of biology. The Gene Ontology Consortium.
Nat Genet 25, 25–29.
Supporting information
The following supplementary material is available:
Table S1. Clinical features of analyzed patients.
Table S2. Mass spectrometric identification of the
proteins exhibiting altered expression in colorectal
carcinoma.
This supplementary material can be found in the
online version of this article.
Please note: As a service to our authors and readers,
this journal provides supporting information supplied
by the authors. Such materials are peer-reviewed and
may be re-organized for online delivery, but are not
copy-edited or typeset. Technical support issues arising
from supporting information (other than missing files)
should be addressed to the authors.
Profiles of membrane fractions from CRC patients J S. Chen et al.
3038 FEBS Journal 277 (2010) 3028–3038 ª 2010 The Authors Journal compilation ª 2010 FEBS