Tài liệu Traffic Related Air Pollution: Spatial Variation, Health Effects and Mitigation Measures pdf
Bạn đang xem bản rút gọn của tài liệu. Xem và tải ngay bản đầy đủ của tài liệu tại đây (14.39 MB, 160 trang )
Traffic Related Air Pollution:
Spatial Variation, Health Effects
and Mitigation Measures
Marieke Dijkema
2011
M.B.A. Dijkema, 2011
Traffic Related Air Pollution: Spatial Variation, Health Effects and Mitigation
Measures
Thesis Utrecht University
ISBN: 978-90-5335-476-6
Cover: Wouter Rijnen - HopsaProductions 2011©, Photo by Nicole Nijhuis
Print: Ridderprint BV, Ridderkerk
Traffic Related Air Pollution:
Spatial Variation, Health Effects
and Mitigation Measures
Verkeersgerelateerde Luchtverontreiniging:
Ruimtelijke Variatie, Gezondheidseffecten
en Maatregelen
(met een samenvatting in het Nederlands)
Proefschrift
ter verkrijging van de graad van doctor aan de Universiteit Utrecht
op gezag van de rector magnificus, prof.dr. G.J. van der Zwaan,
ingevolge het besluit van het college voor promoties
in het openbaar te verdedigen op
dinsdag 20 december 2011 des middags te 2.30 uur
door
Marieke Bettine Alida Dijkema
geboren op 20 juni 1980 te Hoorn
Promotor: Prof.dr.ir. B. Brunekreef
Co-promotoren: Dr. U. Gehring
Dr.ir. R.T. van Strien
Dit proefschrift werd mogelijk gemaakt met financiële steun van ZonMW de
Nederlandse organisatie voor gezondheidsonderzoek en zorginnovatie,
Gemeente Amsterdam en GGD Amsterdam.
CONTENTS
1. General introduction 7
2. A Comparison of Different Approaches to Estimate Small 17
Scale Spatial Variation in Outdoor NO
2
Concentrations
3. Long-term Exposure to Traffic Related Air Pollution and 41
Cardiopulmonary Hospital Admission
4. Long-term Exposure to Traffic-related Air Pollution and 57
Type 2 Diabetes Prevalence in a Cross-sectional Screening Study
in the Netherlands
5. Air Quality Effects of an Urban Highway Speed Limit Reduction 77
6. The Effectiveness of Different Ventilation and Filtration Systems 91
in Reducing Air Pollution Infiltrating a Classroom near a Freeway
7. General Discussion 107
8. References 129
9. Affiliations of Contributors 139
10. Summary 143
11. Samenvatting 149
12. About the Author 155
Dankwoord 159
General Introduction
7
Chapter 1
General Introduction
Chapter 1
8
Air pollution is probably the most intensely studied field in today’s
environmental health research. The extensive body of literature on health
effects associated with air pollution exposure has led to the prioritization of air
pollution as a public health risk factor,
1
and has resulted in air quality
regulations worldwide.
e.g.2-4
However, even at concentrations below limit
values, air pollution still has a significant health impact. Therefore, the debate
on air quality policy is ongoing.
The policy debate focuses on fundamental questions; which government
tier has the responsibility and which tier has the ability to make a difference?
Moreover, the necessity to take action is often disputed. In that respect,
reliable quantitative information on the health impact of air pollution is very
important. The debate furthermore includes discussions of the relevance of
specific components of air pollution to the observed health effects, the
suitability of those specific components as targets for air quality regulations,
the levels at which limit values should be set and the effectiveness of potential
mitigation measures. Although in essence this is a debate in the political
arena, science plays an important role in providing a solid evidence basis for
the decision makers.
General Introduction
9
AIR POLLUTION AND ITS HEALTH EFFECTS
Air pollution
Air pollution is a complex mixture of many gaseous and particulate
components originating from a large variety of natural and anthropogenic
sources. Among anthropogenic sources, industry and traffic are most
prominent.
1,5-7
From a health perspective, air pollution is most relevant when
the population is exposed, like in residential areas. The main source of air
pollution in residential areas in the Netherlands is traffic.
7,8
Traffic related air
pollution originates from combustion and wear of tires, brakes and road
surface and consists of many different components, such as soot, nitrogen
oxides and particulate matter. Nitrogen dioxide (NO
2
) is often considered an
indicator of this mixture.
9
The air pollution concentration at a specific location is determined by the
presence of sources (such as traffic and industry), spatial characteristics
(ranging from street and building configuration to the size and elevation of a
city and its surroundings) and atmospheric processes (such as long-range
transport of air pollution and meteorology).
10
Due to the variation in these
characteristics, temporal and spatial differences in air pollution can be very
large.
7-9,11,12
When looking at longer time periods (months or years), the
spatial variation within a city is often larger than the temporal variation.
13-15
Exposure assessment in epidemiological studies
To estimate exposure of participants in epidemiological studies, different
methods are being used. In studies on the short-term (days to weeks) effects
of air pollution, information on the temporal variation of air pollution is
needed. Such data is often obtained from monitoring networks.
e.g.16
Exposure
of participants in these health studies is estimated by the concentration
measured at the monitoring site nearest to the participants’ residential
address.
e.g.6,17-23
Exposure assessment in long-term (years) health effects studies started by
assigning the annual mean concentration from monitoring data by the
participants city of residence.
24,25
Later, approaches to estimate the variation
of air pollution within cities were used. Since traffic is generally the dominant
source of this small scale (meters) variation,
7,8,26-28
many studies used
indicators of traffic near the residential address.
e.g.29,30
Examples of such
indicators are proximity of different types of roads, traffic flow (number of cars
per day) and/or its composition (cars, trucks) derived from questionnaires or
Geographic Information Systems (GIS). These indicators, however, do not
account for influential factors such as spatial situation, meteorology and
urbanization. Modeled air pollution concentrations, accounting for such factors,
may render a more valid estimation of exposure than indicators of nearby
traffic.
31
Therefore, modeling techniques such as Land Use Regression (LUR)
Chapter 1
10
and dispersion modeling became increasingly popular in epidemiological
studies in the past few years.
e.g.14,32
Participants’ long-term average exposure
to air pollutants such as NO
2
(proxy of the traffic related air pollution mixture)
is often estimated by applying these modeling techniques to the residential
address.
e.g.9,14,32
The estimated air pollution concentrations from dispersion or LUR
modeling are quite close to measured concentrations at selected sites
14,28
and
validity of this approach to estimate exposure has been shown.
e.g.33,34
Nevertheless, some misclassification may occur due to assumptions made.
First, this approach assumes outdoor concentrations being representative for
indoor exposure. Secondly, since exposure of an individual takes place at
several locations of which residence is only one, exposure at a residential
address is merely an indicator of long-term exposure. Furthermore, this
approach does not account for personal activities such as occupation or time
spent in traffic, which may influence exposure remarkably.
LUR models are increasingly popular in epidemiological studies as those
models are a relatively simple method to extrapolate a limited number of
measurements to a larger population. For the purpose of air quality
management and regulation, however, dispersion modeling
10
is the method of
choice in the Netherlands. Dispersion models are more complex models, for
which a lot of input data is needed. Dispersion models furthermore have
limitations in their applicability. The Dutch CAR model,
10
for instance, limits
estimations to a maximum of 50 meters from a road for which input data is
available. Only few comparisons have been made between these two modeling
techniques.
26,35,36
Air pollution health effects
Since the 1980s, the health effects of air pollution have been intensely
investigated in episode and time-series studies (also called ‘short-term
studies’), which showed that episodes of elevated air pollution levels were
associated with increases in mortality, hospital admissions, and symptoms.
6,17-
23
In the past decade, focus has shifted towards the health effects of long-term
exposure to air pollution (also called ‘long-term studies’), and traffic related air
pollution became a main priority.
37-40
The first long-term studies showed that increased long-term average air
pollution exposure was associated with increased mortality.
24,25
As air pollution
variation may be larger within cities than between cities, later studies
e.g.37,41,42
used more sophisticated methods for the estimation of long-term exposure,
such as LUR or dispersion modeling. Health effects shown to be associated
with long-term exposure to air pollution are respiratory disease, such as
asthma and chronic obstructive pulmonary disease (COPD), cardiovascular
symptoms and disease, such as arteriosclerosis and ischemic heart disease
(IHD), and mortality for these cardiopulmonary causes.
e.g.43-47
A hypothesis for
General Introduction
11
the biological mechanism underlying these health effects is that traffic related
air pollution triggers systemic oxidative stress and inflammation in for instance
endothelial cells and macrophages.
6,48
Such biological processes might also
play a role in diseases such as arthritis and type 2 diabetes (also known as
adult-onset diabetes), although data supporting an association with air
pollution are limited.
49-53
Studies furthermore showed evidence for associations
between air pollution and lung cancer,
e.g.47,54,55
lung development,
e.g.56,57
birth
outcomes
e.g.42,58-61
such as preterm birth and low birth weight and cognition.
62
Long-term studies showed larger effects of air pollution on
cardiopulmonary mortality than short-term studies. This is explained by those
cases of death in which air pollution is related to chronic disease leading to
frailty but unrelated to timing of death, which are not detected in short-term
studies.
63
Hospital admissions for cardiopulmonary causes only occasionally
have been the subject of long-term studies.
41,64-69
Since the majority of these
long-term studies on hospitalization have furthermore been done in specific
sub-populations (e.g. children
64,69
), the health impact of long-term exposure to
traffic related air pollution in the general population, remains largely unknown.
Chapter 1
12
AIR POLLUTION POLICY IN THE NETHERLANDS
The European Union (EU) has applied air quality regulations ever since the
1970’s, as “humans can be adversely affected by exposure to air pollutants in
ambient air”.
70
Under the current EU legislation (Directive 2008/50/EC),
member states should empirically assess the ambient pollution levels. When
concentrations above the EU limit values
3
are observed, air quality plans have
to be developed to ensure compliance with the limit values.
A 2008 evaluation showed that air pollution levels exceeded the
announced limit values for a large part of the country.
71
Therefore a national
action plan (NSL: Nationaal Samenwerkingsprogramma Luchtkwaliteit) was
prepared by the national government. The action plan comprises a number of
general measures, such as traffic management at freeways, stimulation of
cleaner vehicles, and a series of measures listed in the regional action plans
(RSL: Regionaal Samenwerkingsprogramma Luchtkwaliteit, under provincial
responsibility). Regional action plans consist of several municipal action plans
listing local measures such as low emission zones, traffic management at
specific crossways, limitation of driving speed and promotion of public
transport and bicycle use. As part of the NSL, all aforementioned authority
tiers are furthermore committed to provide data on local sources of air
pollution and/or their emission (e.g. the number of cars at the main roads or
the emission of a power plant) on a yearly basis. Using this information, the
national government estimates past and future air pollution concentrations at
all locations in The Netherlands, using a combination of modeling techniques
(Monitoring tool: www.nsl-monitoring.nl). This monitoring also incorporates
current and future spatial plans (such as neighborhood or road expansion and
new business parcs). Based on the monitoring results, the action plans may be
revised in order to meet EU limit values by the due date.
By applying this staged model over different authority tiers, responsibility
for improving air quality has been assigned towards the local level. Local
action plans are in part funded by the national government. As NSL has
successfully been applied to get derogation from the EU (delay of the date at
which the Netherlands will have to meet the EU limit values), all Dutch
authorities involved are legally obliged to carry out their action plans.
In general, municipal action plans are prepared by a collaboration of
municipal departments, such as the departments of environment and
infrastructure, and the Public Health Service (GGD). Important factors when
preparing such action plans are local air pollution levels, the contribution of
local sources, the availability of tools to change the current situation and, last
but not least, the political sense of urgency to take action.
General Introduction
13
EVIDENCE BASED PUBLIC HEALTH
The research presented in this thesis was conducted by the Public Health
Service of Amsterdam in collaboration with the Institute for Risk Assessment
Sciences of Utrecht University within the framework of the Academic
Collaborative Center for Environmental Health. The Academic Collaborative
Center for Environmental Health was funded by the Netherlands Organization
for Health Research and Development (ZonMW) within the ‘Academic
Collaborative Centers’ program. The aim of this program is to encourage
academic research with high practical relevance in public health and to
improve evidence based public health in Dutch Public Health Services.
B
Health
Effects
C
Public
Health
Impact
D
Policy
A
Exposure
B
Health Status
C
Overall Patient
Status
A
Cause for
Disease
D
Treatment
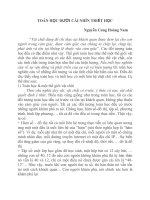
Figure 1. The cycle of clinical work (white) and public health (black)
underlying ‘evidence based medicine’, and ‘evidence based public health’,
respectively. In clinical work, cause(s) (inner Box A) of health problems (B)
results in a doctors’ diagnosis. The assessment of the overall situation of the
patient (C) determines the treatment strategy (D) to positively affect the
causes (A) and/or health (B). In public health, some exposure (A) may causes
health problems in the population (B). The assessment of its relevance (C)
may result in a policy (D) to abate the exposure (A) and improve public health
(B). Ideally, all steps in both cycles are based on scientific evidence –
evidence based medicine and public health, respectively. Adapted from Künzli
and Perez
72
Chapter 1
14
Evidence based medicine is a well established paradigm.
73
In brief,
evidence based medicine means that clinical expertise is integrated with the
best available systematic research, and that decisions are made with the
conscientious, explicit, and judicious use of the current best evidence. As
stated by Künzli and Perez,
72
evidence based public health is the natural
extension of evidence based medicine to the public health field. Their model of
evidence based public health is shown in Figure 1.
The main complicating factor in the much less established ‘evidence based
public health’ is that it deals with populations rather than individual patients.
As a consequence there is a considerable difference in methods, actors,
responsibilities and indicators of result. Especially the large variety of actors in
the public health cycle, ranging from health professionals to technical
engineers and governors at different authority tiers, poses a challenge for the
Academic Collaboration Center of Environmental Health.
For air quality policy in the Netherlands, the different phases of the
aforementioned cycle are carried out by different organizations. At the local
level, for instance, the characterization of exposure (A) is done by engineers
of the department of environment. The assessment of possible health effects
(B) and their relevance (C) is done by Public Health Services. Policies to abate
exposure (phase D) are carried out by different departments within a
municipality. In Amsterdam, for example, traffic reduction measures are taken
by the department of traffic and infrastructure, technical measures to reduce
dust emission in coal handling are taken by the port of Amsterdam, mitigation
measures to reduce exposure of vulnerable members of the population are
taken by the department of youth and education, etcetera. For certain other
policies, including those policies involving traffic management at freeways,
national government bodies are in charge. Decision making processes may
therefore become rather complicated.
Environmental health professionals from Public Health Services can be
involved in all phases of the aforementioned cycle. By providing evidence
based expertise they can contribute importantly to healthy air quality policies.
General Introduction
15
THIS THESIS
The primary objective of this thesis is to provide evidence for the association
between health effects and traffic related air pollution, and potential mitigation
measures relevant to Public Health Services in the Netherlands. The research
in this thesis comprises three elements closely related to the work of Public
Health Services: assessment of exposure (Chapter 2), its health effects
(Chapters 3 and 4) and evaluation of mitigation measures (Chapter 5 and 6).
The aim of the first part of this thesis (Chapter 2) is to estimate the spatial
variation in long-term average air pollution concentrations related to traffic in
the West of the Netherlands. Chapter 2 describes three different approaches to
model small scale variation of long-term exposure to traffic related air
pollution. Two of these approaches were developed within the framework of
this thesis, the third approach is the model required by national legislation.
The approaches were evaluated regarding their ability to estimate
concentrations at a number of independent measurement sites in Amsterdam.
The objective in the second part of this thesis (Chapters 3 and 4) is to
explore the relationship between long-term exposure to traffic-related air
pollution and morbidity. In Chapter 3, the relation between long-term
exposure to traffic related outdoor air pollution and hospital admission for
cardiovascular and respiratory disease in the total population of the West of
the Netherlands is evaluated. Chapter 4 describes the associations between
type 2 diabetes prevalence, as obtained through extensive screening of all 50-
75 year old inhabitants of the region of Westfriesland, and different proxies of
long-term exposure to traffic related air pollution.
The third aim is to assess the effectiveness of measures to reduce
exposure to traffic related air pollution (Chapters 5 and 6). In Chapter 5 the
effectiveness of a limitation of the maximum driving speed at the Amsterdam
ring freeway in reducing the contribution of traffic emissions to the
concentrations of several pollutants is evaluated. Chapter 6 describes to what
extent different ventilation systems fitted with fine particle filters were able to
reduce infiltration of outdoor air pollution into a school near a freeway.
In Chapter 7 the main findings of the studies presented in this thesis are
discussed with respect to the framework of evidence based public health,
together with the implications of the findings of this thesis. The experience
and insights resulting from this work being done in the Academic Collaboration
Centre for daily ‘air quality’-practice in Public Health Services are discussed.
Chapter 2
16
Approaches of Modeling Spatial Variation of NO
2
17
Chapter 2
A Comparison of Different Approaches to Estimate
Small Scale Spatial Variation in Outdoor NO
2
Concentrations
Marieke B.A. Dijkema
Ulrike Gehring
Rob T. van Strien
Saskia C. van der Zee
Paul Fischer
Gerard Hoek
Bert Brunekreef
Environmental Health Perspectives, 2011 (119(5):670-675)
Chapter 2
18
ABSTRACT
In epidemiological studies, small scale spatial variation in air quality is
estimated using land-use regression (LUR) and dispersion models. An
important issue of exposure modeling is the predictive performance of the
model at unmeasured locations.
In this study, we aimed to evaluate the performance of two LUR models
(large area and city specific) and a dispersion model in estimating small-scale
variations in nitrogen dioxide (NO
2
) concentrations.
Two LUR models were developed based on independent NO
2
monitoring
campaigns performed in Amsterdam and in a larger area including
Amsterdam, the Netherlands, in 2006 and 2007, respectively. The
measurement data of the other campaign were used to evaluate each model.
Predictions from both LUR models and the CAR dispersion model were
compared against NO
2
measurements obtained from Amsterdam.
The large-area and the city-specific LUR models provided good predictions
of NO
2
concentrations [percentage of explained variation (R
2
) = 87% and
72%, respectively]. The models explained less variability of the concentrations
in the other sampling campaign, probably related to differences in site
selection, and illustrating the need to select sampling sites representative of
the locations to which the model will be applied. More complete traffic
information contributed more to a better model fit than detailed land-use data.
Dispersion-model estimates for NO
2
-concentrations were within the range of
both LUR estimates.
Approaches of Modeling Spatial Variation of NO
2
19
INTRODUCTION
Many epidemiological studies have shown that air pollution is associated with
health effects such as cardiopulmonary morbidity and mortality.
6,17
Currently,
the land use regression (LUR) method
74
is increasingly being used for
estimating small scale variations in air pollution concentrations in European
and North American epidemiological studies.
e.g.14,32
The quality of LUR-based
exposure estimation of outdoor air pollution concentrations largely relies on
coverage and quality of specific monitoring campaigns and the geographic
data to support them. Information extractable from land use maps depends on
resolution, which is often limited. Another common limitation is that digital
geographic traffic information is usually not readily available, but needs to be
collected from local and national authorities and linked to digital road maps.
Most LUR studies report good performance of prediction models, expressed
as the percentage explained variation (R
2
).
14
Validation is often performed by
internal leave-one-out cross-validation from the database used for developing
the model. An independent dataset for model validation is not often available.
We had two independent datasets of NO
2
measurements in the city of
Amsterdam available that allowed us to evaluate the performance of the LUR
models in predicting concentrations from the dataset not used for model
development.
Dispersion modeling is another method to estimate small scale variations
in air pollution concentrations. In the Netherlands, the CAR dispersion model
10
is widely used for the purpose of air quality management and regulation. Few
comparisons have been made between dispersion and LUR models.
26,35,75
The aims of our study were 1) to evaluate the value of complete traffic
data that is not standard available and high resolution land use data for
improving LUR model performance, 2) to evaluate the performance of two LUR
models with independent sets of NO
2
measurements, and 3) to compare the
ability of the CAR dispersion model and two LUR models to estimate small
scale variations in NO
2
concentrations.
Chapter 2
20
METHODS
Study areas
The study area for the large area LUR is situated in the north-western part
(6,000 km
2
) of the Netherlands (Supplemental Material, Figure 1). It includes
rural, suburban and urban areas among which major cities such as Amsterdam
and Rotterdam. With 4.2 million inhabitants in almost 2 million households,
this part of the Netherlands is densely populated and has a dense road
network. The study area for the city specific LUR model consists of the greater
city of Amsterdam (1 million inhabitants, 170 km
2
, Supplemental Material,
Figure 1).
Air quality
Two independent NO
2
-monitoring campaigns were done. The campaign for the
large area model took place in 2007 using Ogawa badges (Ogawa & co,
Pompano beach, Florida). A total of 60 badges were distributed among traffic
dominated urban sites (n=18), urban non-traffic sites (n=34) and rural sites
(n=8). Eight additional badges were located at rural sites outside the study
area to minimize border-effects when calculating background concentrations.
76
All badges were located at the façade of residential buildings and away from
local sources other than traffic. One week monitoring (7 days +/- 3 hours, all
starting at the same day) was performed in all four seasons (January, April,
June and October). Sampling and analysis were done as described earlier.
33
For the city specific model, data for the year 2006 from a routinely
performed passive NO
2
monitoring program with Palmes tubes
77
in Amsterdam
was used.
78
In contrast with the other campaign, Palmes tubes were not only
located at the façade of residential buildings but also at (lamp)posts. As in the
large area campaign, all sites were away from local sources other than traffic,
measurements near hotspots such as traffic lights and bus stations were
excluded. Tubes were put up at 62 locations in Amsterdam of which 25 were
traffic dominated and 37 were not. Monitoring took place continuously. Tubes
were replaced every 28 days and analyzed as described in Palmes et al.,
77
resulting in full-year data.
All monitoring locations were geo coded using a national GIS database
(ACN) containing coordinates for all home addresses in the Netherlands.
References for the geographical databases (including traffic and land use data)
used in this study can be found in Supplemental Material, Annex A.
Traffic data
Geographical information on traffic flow was collected from all authorities
responsible for traffic management in the study area. The National
government is responsible for the freeways; Provinces for the highways, main
connection routes and other country roads in rural areas; and municipalities
Approaches of Modeling Spatial Variation of NO
2
21
for all other roads and streets. In the large study area, there were 93 sources
of traffic data: the national department of traffic, 3 provinces and 89
municipalities. All authorities provided data on traffic flow and traffic
composition by road segment. For all freeways data were obtained from
continuous automated counters, for most other roads traffic flow was
estimated from yearly two to four week automated counts in combination with
traffic models, most commonly OmniTRANS (www.omnitrans-international.
com). Data were provided for 94.1% of the nationally, 58.2% of the
provincially, and 48.1% of the municipally managed road length. Most
authorities provided traffic data for the years 2004 (52% of the available road
segments), 2005 (13%) or 2006 (31%). When no data for 2006 were
available, data from the most recent previous year were used to estimate the
expected 2006 traffic flow.
76
If no data were provided, quiet roads or small
streets were assigned a minimal flow of 1225 vehicles per 24 hours
76
(applied
to none of the nationally, 31.2% of the provincially and 44.6% of the
municipally managed road length). Altogether, for 87.3% of the total road
length in the study area traffic flow was available, for 86.9% also information
on traffic composition was available. These data were linked to a geo-database
of all roads in the Netherlands (NWB). For each measurement site we defined
traffic flow in circular buffers (100m and 250m), distance to and traffic flow at
the nearest road (distinguishing total and heavy duty traffic) for different road
types (all roads, busy roads (traffic load of more than 5,000 vehicles per 24
hours), main roads (load of more than 10,000 vehicles per 24 hours), and
freeways). All distances to roads were log transformed, a priori, to allow for
the non-linear (exponential) decay of air pollution concentrations with distance
to the road. All flow-variables were categorized by distance (25, 50, 100, 250
and 500m). All traffic variables used were derived using ArcGIS software
(version 9, ESRI, Redlands CA, USA).
Land use data
Information on land use in the large study area was derived from the
European land use database CORINE, available at a 100m*100m grid. For ten
different categories (residential, industry, transport, port, airport,
waste/construction, urban green, forest, agriculture, combined green space
(urban green, forest and agriculture)) the percentage of land use in circular
buffers with radii of 300 m, 1 km and 5 km around the monitoring sites were
calculated (following,
76,79
adapted to the resolution of the available data when
necessary, resulting in 30 land use variables).
For the city specific model, the percentage land use in 2006 from a
5m*5m grid map was calculated for circular buffers with radii of 25, 50, 100,
250 and 500m. Land use categories available in this detailed grid were
railroad, road, freeway, building, business, industry, greenhouses, agriculture,
urban green, forest, playground, sports ground, other tiled surfaces, water,
Chapter 2
22
combined green space (agriculture, urban green, forest, play- and sports
ground) and combined roads (road, highway and freeway).
For the large area and the city specific LUR-models, the number of
inhabitants in circular buffers with radii of 100m, 300m, 1km and 5 km was
calculated from the national population density database. The larger buffer
sizes represent the potential impact of area level sources (e.g. all industrial or
residential emissions) on measured concentrations, rather than the impact of a
specific road or point source.
Imputation of missing concentration data
In the large area campaign, 10.6% of badges got lost, for the city specific
campaign this was the case for 3.7% of the tubes. Based on the available
data, missing values were imputed ten times using the MICE (Multivariate
Imputation by Chained Equations) procedure in R (version 2.8.0, The R
Foundation for Statistical Computing, Vienna, Austria), incorporating
information on site type (rural, urban or traffic). The differences between the
ten imputed datasets were small as only a small percentage of the
observations was missing. From each imputed dataset the mean concentration
was calculated for each location, which was calculated to estimate the annual
mean values.
As a result of the multiple imputation applied to the measurement
datasets, ten complete datasets for each of the two campaigns were available.
Model parameters were calculated by imputation and then combined by the
MIANALYZE procedure (SAS version 9.1, SAS Institute Inc., Carry NC, USA) to
account for the uncertainty about the imputed values.
LUR model development and validation
The relationship between land use and traffic variables and NO
2
concentration
at the measurement sites was studied by multiple linear regression analysis.
Regression models were constructed using a supervised forward selection
procedure.
79
Variables were added to the regression model in four steps: 1)
traffic variables, 2) traffic related land use variables, 3) population density
related land use variables, 4) other land use variables (such as industry and
green space).
In each of these steps, the variable with the highest R
2
based on simple
(or univariate) linear regression analysis was selected first. In selecting the
best predictor, all categories (i.e. different buffer sizes) were tested separately
and only the best predictor per group (i.e. each land use category) was
selected for further testing, thus no overlapping categories were included in
the model. Then, variables with the second, third (etc.) highest R
2
were added
one by one and included in the multiple (or multivariate) regression model, if
the adjusted R
2
improved by at least one percent and the sign of each of the
regression coefficients remained as expected.
Approaches of Modeling Spatial Variation of NO
2
23
Because of the larger and more diverse area, the regional background
concentration calculated as the inverse distance weighted mean concentration
of rural background measurement sites within a radius of 50km
(measurements done in the large area campaign) was a priori included in the
large area model for all urban sites. For the rural background sites the locally
measured concentration was used as the local background concentration.
After all of the available variables had been tested, the resulting model
was re-examined. Variables with the highest p-values were excluded one at a
time if the adjusted R
2
remained mostly unchanged (difference in adjusted
R
2
<1%). The reduced model was preferred.
The final model was evaluated using an internal leave-one-out cross-
validation procedure.
14
We additionally evaluated the two models by
comparing the concentrations predicted by one model for sites used to develop
the other model. To study the additional value of the more complete traffic
and land use data, the large area model was also developed using limited
traffic data (without municipal road data) and the city specific model was also
developed using less detailed land-use data (CORINE).
Dispersion model
In this study, the Dutch modeling tool CAR
10,80
was used, which is the model
to be used in built up areas of the Netherlands according to Dutch air quality
regulations to calculate traffic-related air pollution. An extensive description of
the model is available in Supplemental Material, Annex B. CAR is an empirical
dispersion model derived from a more comprehensive Gaussian dispersion
model.
81
The model adds a local traffic contribution to a large scale
concentration map, which is updated every year. This large scale
concentration map is calculated from measurement data of the National Air
Quality Monitoring Network (RIVM, Bilthoven, the Netherlands) and modeled
contribution of sources in the Netherlands and other European countries.
Traffic contribution is calculated by multiplying the traffic emissions with a
dispersion factor. Traffic emissions are calculated from traffic intensity, -
composition and default speed-dependent national emission factors. The
dispersion factor depends on street configuration (buildings, trees), distance to
the center of the road and on average annual wind speed (see Annex). The
CAR model can be applied to a maximum distance of 60 meters from a road.
CAR version 6.1.1 was used to predict 2006 annual mean NO
2
concentrations in this study for both sets of monitoring locations, using
meteorology for the year 2006. The information included in the model was:
exact geo coded location, traffic flow (vehicles per 24 hours) and composition
(percentage of cars, vans, trucks and busses), distance to the center of the
road (m) and categorical information on driving speed, road type and the
presence of trees.
Chapter 2
24
Comparison of LUR and dispersion models
Since the CAR atmospheric dispersion model is used to predict air pollution
concentrations for almost all roads for which traffic information is available in
the Netherlands, concentrations observed at the measurement sites were
compared with the CAR-predictions as well. Performance of the dispersion
model was compared with the LUR models at the monitoring sites located in
Amsterdam (13 monitoring sites of the large area campaign, and 62
monitoring sites of the city specific campaign). This was done by evaluation of
scatter plots and correlations between observed and predicted concentrations,
and between predictions by the different models.
Approaches of Modeling Spatial Variation of NO
2
25
RESULTS
Large area LUR model
Table 1 shows the distribution of the measured concentrations and the
predictor variables for the large area model. Table 2 shows the change in NO
2
concentrations per inter quartile range increase in the predictors in this model
and the explained variance of this model (R
2
: 87%). Internal leave-one-out
cross-validation resulted in a full model R
2
of 84%. Supplemental Material,
Figure 2 shows a plot of the predicted and observed concentrations.
Table 1. Distribution of observed average NO
2
-concentrations and predictor
variables used in the large area (Northwest Netherlands) and city specific
(Amsterdam) multivariate LUR models.
Median Range
Large area LUR model (N=60)
Measured NO
2
-concentration
a
(µg/m
3
) 25.1 (10.5 to 53.1)
Regional background concentration (µg/m
3
) 20.7 (10.8 to 25.4)
Traffic volume at nearest road (veh/24hrs) 1225 (195.4 to 37132.8)
Distance to nearest busy road
b
(m) 103.4 (0 to 1409.8)
Residential land use in a 5 km buffer (%) 28.5 (0.8 to 63.9)
City specific LUR model (N=62)
Measured NO
2
-concentration a (µg/m
3
) 37.9 (24.8 to 75.1)
Traffic volume at nearest busy road
b
within 50m (veh/24hrs)
0 (0 to 29640.2)
Distance to nearest main road
c
(m) 113.5 (9.3 to 2845.1)
Green space in a 250 m buffer (%) 27.5 (0.5 to 76.3)
Water in a 100 m buffer (%) 4.9 (0 to 30.8)
a
NO
2
-concentrations: average of 10 imputed datasets
b
busy road ≥5000 vehicles per 24 hours
c
main road ≥10 000 vehicles per 24 hours
We also investigated the performance of the large-area model for the
Amsterdam sub-region of the study area. The resulting R
2
of 79%
(Supplemental Material, Figure 3) for these 13 sites was only slightly less than
in the original model (internal cross-validated R
2
: 84%). When we excluded all
13 Amsterdam sites from the model development (leaving 47 sites including
the city of Rotterdam) the model performance expressed as R
2
was 87%.
In order to evaluate the added value of the more complete traffic data, the
model was developed using traffic data for nationally and provincially managed
roads only. This resulted in a model (Supplemental Material, Figure 4)
including three predictor variables: background concentration (1) and
percentage of land use categories residential (2) and port (3) in a 5 km
circular buffer. The estimated coefficients for background concentration and
residential land use were similar to those of the model with more complete
traffic data (data not shown). The explained variance (R
2
: 73%), however,
was substantially lower than for the original model (R
2
: 87%).