Tài liệu Báo cáo khoa học: TransLISA, a novel quantitative, nonradioactive assay for transcription factor DNA-binding analyses pdf
Bạn đang xem bản rút gọn của tài liệu. Xem và tải ngay bản đầy đủ của tài liệu tại đây (415.82 KB, 9 trang )
TransLISA, a novel quantitative, nonradioactive assay
for transcription factor DNA-binding analyses
Kristiina A. Vuori
1
, Johanna K. Ahlskog
2
, Lea Sistonen
2
and Mikko Nikinmaa
1
1 Centre of Excellence in Evolutionary Genetics and Physiology, Department of Biology, University of Turku, Finland
2 Department of Biology, A
˚
bo Akademi University and Turku Centre for Biotechnology, University of Turku and A
˚
bo Akademi University,
Finland
Introduction
Transcription factors are proteins that bind DNA to
induce or suppress gene transcription. They function
in virtually all biological processes, although their
role in transcriptional regulation in eukaryotes is
poorly understood [1]. Among the most intensively
studied transcription factors is heat shock factor 1
(HSF1). HSF1 binding to its response elements in
target gene promoters is an established model system
of inductive transcriptional regulatory responses, and
studies on HSF1 have yielded important insights into
basic cellular and molecular biology and contributed
to drug discovery [2–4]. As transcriptional regulation
involving specific transcription factors has both basic
biological and drug discovery ramifications, there is
an increasing demand for quantitative, fast and high-
throughput assays of transcription factor function
with improved sensitivity and increased analytical
range.
Keywords
DNA-binding activity; HSF1; transcription
factor; TransLISA
Correspondence
K. A. Vuori, Centre of Excellence in
Evolutionary Genetics and Physiology,
Laboratory of Animal Physiology,
Department of Biology, FI-20014, University
of Turku, Finland
Fax: +358 23336058
Tel: +358 23336263
E-mail: kristiina.vuori@utu.fi
Website: .fi
(Received 5 September 2009, revised 14
October 2009, accepted 19 October 2009)
doi:10.1111/j.1742-4658.2009.07446.x
Transcription factors are DNA-binding proteins that regulate key biologi-
cal processes. Their interactions with DNA are commonly analyzed with
gel-based electrophoretic mobility shift assay (EMSA) using radioactively
labeled probes. Within various fields of research, there exists an increasing
demand to develop assays with faster sample throughput combined with
improved sensitivity, increased analytical range, and precise quantification.
Here, we describe the development and performance of a 384-well plate
immunoassay, termed TransLISA, which is a novel homogeneous assay for
rapid and sensitive quantification of the DNA-binding activity of transcrip-
tion factors in cell and tissue lysates. TransLISA outperforms EMSAs,
because it eliminates the need to use radioactive chemicals and allows fast
and precise quantification of DNA-binding activity of transcription factors
from large number of samples simultaneously. We have used TransLISA to
demonstrate the DNA-binding activity of heat shock factor 1, representing
a well-known model of inductive transcriptional regulatory responses, but
the method is easily adaptable for the study of any transcription factor.
Thus, TransLISA can replace EMSAs and may be used in various applica-
tions and research fields where quantitative, cost-effective and large-scale
measurements of the DNA-binding activity of transcription factors are
required, including screening of responses in multiple treatments in cellular
and molecular biology, evolutionary research, environmental monitoring,
and drug discovery.
Abbreviations
CV, coefficient of variation; EMSA, electrophoretic mobility shift assay; HSE, heat shock element; HSF1, heat shock factor 1; Hsp, heat
shock protein; LOCI, luminescent oxygen channeling immunoassay; MEF, mouse embryonic fibroblast.
7366 FEBS Journal 276 (2009) 7366–7374 ª 2009 The Authors Journal compilation ª 2009 FEBS
Currently, DNA-binding activities of transcription
factors are generally analyzed with electrophoretic
mobility shift assays (EMSAs) [5,6]. Cell or tissue
extracts are mixed with a radiolabeled oligonucleotide
probe containing the binding site for the transcription
factor of interest. Binding reactions are run in non-
denaturating polyacrylamide gels (PAGE). Gels are
dried and exposed to X-ray film overnight or longer
(Fig. 1A). The intensity of the resulting bands, gener-
ally 15 per gel at most, can be quantified with imaging
software. However, EMSA is time-consuming, does
not allow high-throughput analysis, and provides only
descriptive or semiquantitative results. In addition, it
produces considerable amounts of radioactive and
other waste. Recently, Iwasaki et al. [7] described a
liquid chemiluminescent DNA pull-down assay. The
method measures DNA binding of transcription
factors, and can thus replace EMSA. However, the
method uses previously tagged proteins, and cannot,
therefore, be generally used in quantitative studies of
transcription factor–DNA interactions in biological
samples. A variety of other methods, such as DNase
footprinting [8], chromatin immunoprecipitation [9],
yeast one-hybrid screens [10], and protein binding
microarrays [11], exist for investigating transcription
factors and transcriptional regulation, but the main
purpose of using these methods is not in quantifying
transcription factor–DNA binding.
Our goal was to develop a fast and versatile assay
for detecting and quantifying transcription factor–
EMSA
AB
TransLISA
HSE P
B
30 min
30 min
Incubation 1.5 mL tube
Incubation 1.5 mL tube
2 h
+
A
30 min
PAGE
Pipet to plate, add A beads and incubate
+16 h
D
1 h
Autoradiography
Add D beads and incubate
D A
O
2
Read AlphaLISA si
g
nal at 615 nm
HSE
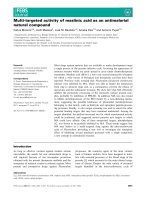
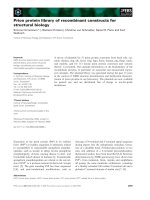
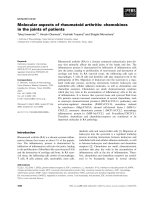
Fig. 1. Comparison of EMSA and TransLISA for the detection of HSF1–DNA binding activity. (A) Schematic presentation of EMSA assay.
Cell or tissue extracts or peptides are incubated with radioactively labeled (c
32
P) probe containing HSF1-binding sites. Binding reactions are
run in nondenaturating polyacrylamide gel. Gels are dried and exposed to X-ray film overnight or longer. The amounts of DNA-bound HSF1
complexes in the samples are detected by band intensities in the autoradiograph. (B) Schematic presentation of TransLISA. Cell or tissue
extracts or peptides are incubated with biotin-labeled probe containing HSE. Aliquots of binding reactions are pipetted into a 384-well plate,
and acceptor beads containing antibody against HSF1 are added to the wells. After incubation, streptavidin-coated donor beads are added,
and plates are covered and incubated at room temperature in the dark. When the acceptor beads are brought into proximity to the donor
beads via HSF1–DNA interactions, singlet oxygen generated by excitation at 680 nm initiates a series of luminescent energy transfers
between compounds in the acceptor beads. The resulting emission is read at 615 nm with a plate reader.
K. A. Vuori et al. TransLISA
FEBS Journal 276 (2009) 7366–7374 ª 2009 The Authors Journal compilation ª 2009 FEBS 7367
DNA binding in biological samples. Our assay is based
on the no-wash ELISA platform AlphaLISA (ampli-
fied luminescence proximity homogeneous) (Perkin-
Elmer, Boston, MA, USA), which is an application of
the luminescent oxygen channeling immunoassay
(LOCI) technology [12,13]. The principle of Alpha-
LISA is based on the proximity of ‘donor’ and ‘accep-
tor’ beads coated with different biomolecules. When
the acceptor beads are brought in proximity to the
donor beads via molecular interactions, singlet oxygen
generated in the donor bead by laser excitation at
680 nm initiates a series of luminescent energy trans-
fers in the acceptor beads. This results in emission at
615 nm when the AlphaLISA acceptor beads are used.
In the absence of biological interaction, the singlet
oxygen molecules produced remain undetected. LOCI
technology and AlphaLISA were initially applied in a
configuration where the analyte was bound by anti-
bodies on the beads bearing different epitopes [12].
The technology, however, is extremely versatile, and
may be applied to the measurement of, for example,
enzyme activity, receptor–ligand interactions, second
messenger levels, DNA, proteins, and carbohydrates.
We selected HSF1 as a model transcription factor
for our assay development because the activation of
the heat shock response has been extensively studied.
The best known promoter among the HSF⁄ HSF1-
responsive genes is the Hsp70 promoter, which is a
well-characterized model for inductive transcriptional
responses [2]. HSF1 is essential in many biological pro-
cesses, and plays a significant role in cancer, neurode-
generative diseases, aging, and longevity [3]. HSF1
belongs to an evolutionarily well-conserved family of
transcription factors, with one HSF in yeast, nematode
worms and fruit flies, and four members, HSF1–HSF4,
in vertebrates. HSF1 is required for the heat shock
response, which is triggered by proteotoxic stressors
such as elevated temperature and heavy metals. Upon
activation, HSF1 trimerizes, undergoes hyperphosph-
orylation, and binds to heat shock elements (HSEs) in
the promoters of heat shock genes, which code for
heat shock proteins (Hsps), molecular chaperones that
facilitate correct folding of nascent and misfolded
proteins [2].
Here, we describe the development and performance
of a 384-well plate immunoassay, named TransLISA,
for measuring the DNA-binding activity of a transcrip-
tion factor (Fig. 1B). This assay is the first homoge-
neous, nonradioactive assay for rapid and sensitive
quantification of the DNA binding of transcription
factors in cell and tissue lysates. Although we have
developed the assay using HSF1, it can easily be
adapted for the study of any transcription factor. The
method can thus replace EMSA whenever oligonucleo-
tides containing response elements and specific anti-
bodies for the transcription factor are available. The
assay is the first assay suitable for high-throughput
measurements of transcription factor–DNA interac-
tions in biological samples. Therefore, it can be used
in various research applications, especially when mea-
surements of tens, hundreds or thousands of samples
are needed. Such applications may include screening of
cellular responses in multiple treatments, drug discov-
ery, evolutionary research on transcriptional regula-
tion, and monitoring of transcription factor–DNA
binding in environmental samples.
Results
Optimization of probe and protein extract
concentrations
Optimal assay conditions were established for both the
biotinylated HSE1 oligonucleotide probe and protein
extract concentrations. First, increasing concentrations
(working concentration 1–250 nm; 0.05–12.5 nm in the
incubation reaction) of biotinylated oligonucleotide
probe were applied to 20 lL of incubation reactions
containing 10 lg of control or heat-shocked HeLa or
mouse embryonic fibroblast (MEF) protein extracts.
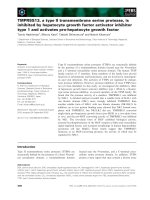
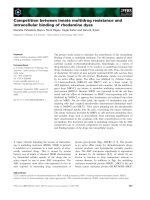
For HeLa cells, the optimal probe concentrations were
determined to be 30, 100 or 150 nm, at which the dif-
ferences between the HeLa cell control and heat-
shocked samples were greatest: 5.0-fold, 4.6-fold, and
4.8-fold, respectively (Fig. 2A). For MEFs, the optimal
probe concentrations were determined to be 100 or
150 nm, at which the differences between the MEF
control and heat-shocked samples were 3.0-fold and
3.4-fold, respectively (Fig. 2B). For clarity, a 150 nm
working concentration of the probe was selected for
use in all assays.
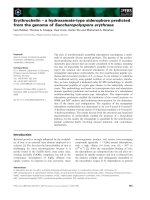
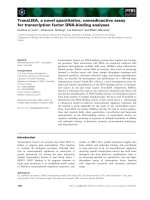
The optimal protein extract concentrations in the
first incubation reaction were tested with the HeLa cell
and MEF control and heat-shocked samples by adding
1, 5 or 10 lg of protein extract to the 20 lL reactions.
The greatest difference between HeLa cell control
and heat-shocked samples (11.2-fold) was obtained
with 5 lg of total protein (Fig. 3A), and the greatest
difference between MEF control and heat-shocked
samples (17.4-fold) was achieved with 10 lg of total
protein (Fig. 3B). As the HeLa cell incubation reac-
tions with 5 and 10 lg of protein gave very similar
results, 11.2-fold or 10.4-fold difference, respectively,
between control and heat-shocked samples, 10 lgof
total protein in a 20 lL initial binding reaction was
selected for use in all assays.
TransLISA K. A. Vuori et al.
7368 FEBS Journal 276 (2009) 7366–7374 ª 2009 The Authors Journal compilation ª 2009 FEBS
We also tested the default assay protocol in which
2.5 lL of sample, 2.5 lL of probe and 10 lL of accep-
tor beads were first added to the plate wells and incu-
bated for 30 min at 4 °C, and this was followed by
addition of 10 lL of donor beads and 1 h of incuba-
tion at room temperature before reading. This type of
assay setup, however, resulted in only 4.1-fold and 6.3-
fold differences between HeLa cell and MEF control,
respectively, and heat-shocked samples (Fig. 3A,B).
Therefore, we concluded that the best resolution of the
assay is achieved by including the first 30 min incuba-
tion step, which allows the protein–DNA complexes to
form, as in EMSA.
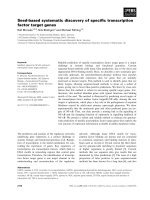
Competition experiments
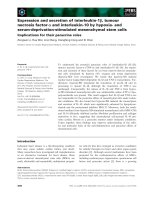
Competition experiments are used to confirm the speci-
ficity of the DNA-binding reaction in EMSA. In our
competition experiments, both unlabeled HSE probe
and blocking of the antibody with HSF1 peptide
abolished the signal in a dose-dependent manner
(Fig. 4A,B). EC50 values for unlabeled HSE probe
and blocking of the antibody with HSF1 peptide were
1.05 and 2.59 nm, respectively. Furthermore, replacing
the correct HSE probe with mutated probe or with a
nonsense ‘scrambled’ probe [14] (Table 1) did not
result in any signal (Fig. 4C). These experiments thus
confirm that the assay specifically measures HSF1
DNA-binding activity.
Analytical range and precision
The analytical range of the assay was evaluated using
known concentrations of recombinant human HSF1
instead of cell extract in the assay. It has previously
been demonstrated that recombinant HSF1 can form
DNA-bound complexes [15]. The signal increased in a
dose-dependent manner from 0.1 to 10 nm of recombi-
nant HSF1 in the binding reaction, indicating that the
assay can detect up to 100-fold differences in HSF1
0
5
10
15
20
25
30
35
40
110
Counts ×10
3
HeLa
Control
Heat shock
0
5
10
15
20
25
30
35
10
Counts ×10
3
MEF
Control
Heat shock
0.01 0.1
nM Probe
0.01 0.1 1
nM Probe
A
B
Fig. 2. Optimization of probe concentrations. Increasing concentra-
tions (working concentration of 1–250 n
M; 0.05–12.5 nM in the incu-
bation reaction) of biotinylated oligomer probe were applied to
incubation reactions containing 10 lg of control and heat-shocked
HeLa cell (A) and MEF (B) protein extracts. Circles represent the
mean counts of triplicate wells, and the error bars represent stan-
dard deviations of triplicate well counts. The concentrations on the
x-axes are concentrations in the incubation reaction.
150
MEF
200
HeLa
50
100
100
150
1 µg protein
5 µg protein
10 µg protein
Default
0
Counts ×10
3
0
50
Control Heat shock
Control Heat shock
Counts ×10
3
1 µg protein
5 µg protein
10 µg protein
Default
A
B
Fig. 3. Optimization of protein extract amounts. The optimal pro-
tein extract amounts in the first incubation reaction were tested
with the HeLa cell (A) and MEF (B) control and heat-shocked sam-
ples by adding 1, 5 or 10 lg of protein extract to the reactions. In
addition, testing of the default protocol using the same samples
without the initial incubation step was included. The probe concen-
tration was the same (working concentration of 150 n
M; 0.75 nM in
the well) for all of the optimizations. The bars represent the mean
counts of triplicate wells, and the error bars represent standard
deviations of triplicate well counts.
K. A. Vuori et al. TransLISA
FEBS Journal 276 (2009) 7366–7374 ª 2009 The Authors Journal compilation ª 2009 FEBS 7369
DNA-binding activity (Fig. 5). The signal decreased in
50 and 500 nm recombinant HSF1 when compared to
the counts of 10 nm HSF1 peptide sample. This is due
to the ‘hook effect’, whereby the signal increases with
increasing target molecule concentration up to a cer-
tain point, after which the target molecule becomes
inhibitory in the reaction because of the saturation of
the available binding sites [16]. The dissociation con-
stant, K
d
, determined from the recombinant HSF1
DNA-binding experiment was 6.27 nm.
The sample-specific intraplate variability was
assessed by pipetting specific samples in different, ran-
domly selected positions within the plate. In eight of
11 cases, the total coefficient of variation (CV) value
of the wells was less than 10%, and in only one of 11
cases was the CV value of the wells unacceptably high
(19.3%) (Table 2).
The interassay variation was assessed by using the
same samples in three or four independent assays on
different days. The interassay variation in sample-
100
120
A
B
C
Heat shock
120
140
Heat shock
40
60
80
40
60
80
100
0
20
nM Unlabeled HSE
0
20
nM HSF1
100
120
140
160
20
40
60
80
Counts ×10
3
Counts ×10
3
Counts ×10
3
0
0.1 1 10 100
0.01 0.1 1 10 100
Heat shock Mutated Scrambled
Fig. 4. Competition experiments. (A) Unlabeled HSE probe in the
incubation reaction abolished the signal of HeLa cell heat-shocked
sample in a dose-dependent manner. The units on the x-axes are
concentrations in the incubation reaction. The signal level of
untreated sample is indicated by the label ‘Heat shock’ on the graph.
(B) Blocking the antibody with recombinant HSF1 peptide abolished
the signal of HeLa cell heat-shocked sample in a dose-dependent
manner. The units on the x-axes are concentrations in the acceptor
bead preincubation reaction. The signal level of untreated sample is
indicated by the label ‘Heat shock’ on the graph. (C) Replacing the
correct HSE probe with mutated probe or with a nonsense ‘scram-
bled’ probe resulted in an absence of signal. The circles represent
the mean counts of triplicate wells, and the error bars represent
standard deviations of triplicate well counts.
Table 1. 5¢-Biotinylated and standard oligonucleotides used in
TransLISA development. The core DNA-binding sequences are indi-
cated with underlining and mutated nucleotides with bold letter.
Oligonucleotide Sequence (5¢-to3¢)
HSE sense Biotin-TCGACTA
GAAGCTTCTAGAAGCTTCTAG
HSE antisense AGCTGATCTTCGAAGATCTTCGAAGAT
Mutated HSE
sense
Biotin-TCGACTT
CAAGCTTGTACAAGCTTGTAG
Mutated HSE
antisense
AGCTGAAGTTCGAACATGTTCGAACATC
‘Scrambled’
oligonucleotide
Biotin-AACGACGGTCGCTCCGCCTGGCT
140
40
60
80
100
120
Counts ×10
3
0
20
0.01
0.1 1 10
100
nM HSF1
Fig. 5. The analytical range of the assay was evaluated using
known concentrations of recombinant human HSF1 protein instead
of cell extract in a normal assay procedure. The circles represent
the mean counts of triplicate wells, and the error bars represent
standard deviations of triplicate well counts. The units on the x-axis
are concentrations in the incubation reaction.
TransLISA K. A. Vuori et al.
7370 FEBS Journal 276 (2009) 7366–7374 ª 2009 The Authors Journal compilation ª 2009 FEBS
specific signal (counts) is shown in the top panel of
Fig. 6. All of the results obtained from independent
assays were in line with each other, indicating good
reproducibility of the assay. The CV values of within-
assay triplicates for each sample on different days
(dots) and the percentage variation between different
assays (line) are shown in the bottom panel of Fig. 6.
The within-assay triplicate CV values were consistently
below 10%. The percentage interassay variation of sig-
nals (sample-specific CV values between assays run on
different days) was 8.3–15.1%, with the exception of
one sample, where the variation was 22.5%.
Measurements of biological samples
We measured three biological replicates of control,
heat-shocked and recovering HeLa cell and MEF sam-
ples (Fig. 7A,B). The results show, on average, 8.4-fold
induction of HSF1 DNA-binding in heat-shocked
HeLa cells, and, on average, 25.8-fold induction of
HSF1 DNA-binding in heat-shocked MEFs when
compared to the untreated cells. The results are well in
line with the results obtained from EMSA (representa-
tive images of HeLa cell and MEF control, heat shock
and recovery are shown in Fig. 7A,B, top left panels),
and with previously published results [17].
We also examined the time course of induction of
HSF1 DNA-binding activity in HeLa cells and MEFs
140
40
60
80
100
120
20
30
0
20
01234567891011
Counts ×10
3
Samples
0
10
Fig. 6. The interassay variation in sample-specific signals. The inter-
assay variation was assessed using the same samples in three or
four independent assays performed on different days. The circles in
the top panel represent the mean counts of triplicate wells in one
assay. The results of independent assays for specific samples indi-
cated by different colors. All of the results given by independent
assays are in line with each other. (B) The circles in the bottom
panel represent the CV values of within-assay triplicates for each
sample on different days, and the lines represent percentage varia-
tion between different assays for each sample.
100
120
140
HeLa
60
70
80
90
MEF
C
A
B
HS R
CHSR
40
60
80
Counts ×10
3
30
40
50
Counts ×10
3
0
20
0
10
20
Control
Heat shock
Recovery
Control Heat shock Recovery
Fig. 7. The DNA-binding activity of HSF1 in biological samples.
Three biological replicates of control, heat-shocked and recovering
HeLa cell samples (A) and MEF samples (B) were measured with
TransLISA. The bars represent the mean counts of triplicate wells,
and the error bars represent standard deviations of triplicate well
counts. The results of three replicates are shown in different col-
ors. Representative EMSA autoradiographs of HeLa cell and MEF
control (C), heat shock (HS) and recovery (R) are shown in the top
left panels.
Table 2. The sample-specific intraplate variability was assessed by
pipetting specific samples at different, randomly selected positions
within the plate.
Sample
Intraplate
averages CV% Wells
S1 56 612 7.6 9
S2 73 727 5.7 9
S1 53 686 6.9 9
S1 48 659 4.4 9
S3 18 010 12.5 9
S4 3534 3.7 8
S5 22 490 10.2 8
S2 80 224 6.3 6
S4 3871 19.3 6
S2 67 068 5.1 6
S6 93 760 4.5 6
K. A. Vuori et al. TransLISA
FEBS Journal 276 (2009) 7366–7374 ª 2009 The Authors Journal compilation ª 2009 FEBS 7371
after 0 to 40 (HeLa) or 0 to 60 (MEF) min of heat
shock (Fig. 8A,B). The results indicate a very fast
response in both HeLa cells and MEFs; the DNA-
binding activity of HSF1 increased markedly already
after 10 or 15 min when cells were exposed to heat
shock. These results agree with those of earlier studies
[17,18].
Discussion
In this study, we have established a 384-well plate,
nonradioactive, homogeneous immunoassay for quan-
tifying the DNA-binding activity of the transcription
factor HSF1 in cell extracts. In comparison with the
traditional method, EMSA, the novel TransLISA
assay is superior in many ways. This assay eliminates
the use of radioactivity and the need to run gels, and
gives results much more rapidly; also, the plate format
enables cost-effective high-throughput sample analysis.
The homogeneous assay format excludes the need for
any washing steps between the addition of reagents.
The broad analytical range of the assay allows quanti-
tation of large differences in the DNA-binding activity
of transcription factors. This is precluded in EMSA
analysis, owing to overexposure of the autoradiograph
when visualizing both strong and weak signals at the
same time. In addition, given the versatility of the
AlphaLISA platform, the detection of DNA-bound
transcription factors can easily be modified by using
different antibodies to either full-length or specific
epitopes of the protein, or to different tags. The anti-
bodies may be either directly coated on the acceptor
beads or indirectly captured with protein A on the
acceptor bead. The optimal assay conditions may natu-
rally vary, and need to be determined for each tran-
scription factor specifically. The assay conditions
selected and interpretation of the results also depend
on the research application, e.g. screening or determin-
ing binding affinities for transcription factor–DNA
binding.
The results of measurements of HSF1 DNA-binding
activity from HeLa cells and MEFs are in line with
results reported in several other papers. The DNA
binding is induced within minutes of heat shock and,
depending on the temperature, is sustained during pro-
longed heat treatment for up to 3 h [18]. Attenuation
of the DNA binding is caused by acetylation of HSF1
and increased Hsp expression in a negative feedback
loop [3,19,20]. HSF1 binds to DNA in trimer form,
whereby an individual HSF1 recognizes a pentameric
sequence nGAAn through the DNA-binding domain.
Stable binding requires simultaneous binding of all
DNA-binding domains in a trimer to three adjacent
nGAAn repeats. Therefore, a functional HSE contains
at least three nGAAn repeats. The promoters of most
Hsp genes contain more than one HSE, allowing for
multiple HSF1 molecules to bind simultaneously. In
addition, HSF1 molecules bind to HSEs in a coopera-
tive manner, so that binding of one trimer facilitates
the binding of the next [2].
In this study, we have specifically analyzed the
DNA-binding activity of HSF1 as a quantitative
model. However, it is possible to establish TransLISA
assays for any transcription factor from any species
when the consensus binding sites are known and spe-
cific antibodies for the transcription factor are avail-
able. The assay described here may thus serve to
initiate further development of quantitative, cost-effec-
tive and large-scale measurements of the DNA binding
of transcription factors in biological samples, both in
basic research and drug discovery.
Experimental procedures
Cell culture, treatments and sample preparation
HeLa cells were cultured in DMEM supplemented with
10% fetal bovine serum, 2 mml-glutamine, penicillin, and
streptomycin, and MEFs were maintained in DMEM sup-
plemented with 10% fetal bovine serum, 1.2 mm sodium
pyruvate, l-glutamine, penicillin, and streptomycin. All cells
were maintained at 37 °C in a humidified 5% CO
2
atmo-
sphere. Heat shock treatment was performed in a 42 °C
(HeLa cells) or 43 °C (MEFs) water bath for the indicated
times. The recovery samples were heat-shocked for 1 h, and
then incubated at 37 °C for 3 h. Sample preparation and
EMSA were performed as described previously [5].
The protein contents of samples were determined with
the Bradford method, using the BioRad Protein Assay
(BioRad, Espoo, Finland) with BSA (Sigma-Aldrich,
St Louis, MO, USA) as the standard.
Assay components
Streptavidin-coated donor beads and protein A-coated
AlphaLISA acceptor beads were from PerkinElmer (Bos-
ton, MA, USA). The polyclonal rabbit HSF1 antibody
(SPA-901) and HSF1 peptide (SPP-900) were from Stress-
gen (Ann Arbor, MI, USA). Low-crosstalk white 384-well
Optiplates were from PerkinElmer. 5¢-Biotinylated and
standard oligonucleotides (Table 1) were purchased from
Oligomer (Helsinki, Finland). The assay buffer (pH 7.4)
contained 25 mm Hepes (Sigma-Aldrich, St Louis, MO,
USA), 1 mgÆmL
)1
Dextran T-500 (Sigma-Aldrich), 0.1%
Triton X-100 (SERVA Electrophoresis GmbH, Heidelberg,
Germany), and 0.1% casein (Pierce, Rockford, IL, USA).
All of the other chemicals were of analytical grade.
TransLISA K. A. Vuori et al.
7372 FEBS Journal 276 (2009) 7366–7374 ª 2009 The Authors Journal compilation ª 2009 FEBS
Probe preparation
Sense and antisense oligonucleotides were both added to
Tris ⁄ EDTA buffer (pH 8.0) to a final concentration of
150 nm, denatured for 10 min at 95 ° C on a heat block,
and allowed to anneal until the block temperature had
decreased to room temperature.
Assay procedure
The assay was run as a three-step assay: initial incubation of
the sample and probe, addition and incubation of the sample
and acceptor beads in the plate wells, and addition of donor
beads with incubation (Fig. 1B). The assay started with a
30 min initial incubation of samples with biotinylated oligo-
nucleotide probe on ice in Eppendorf tubes for formation of
transcription factor–DNA complexes. First, for optimiza-
tion, 1–10 lg of protein extracts was incubated with 1 lLof
1–250 nm biotinylated oligonucleotide probe in a 20 lL reac-
tion in binding buffer (containing 10 mm Tris, pH 7.5,
50 mm NaCl, 4 mm EDTA, 20% glycerol), and 1 lgof
poly(dIdC) (Sigma-Aldrich, St Louis, MO, USA). After opti-
mization (see Results), 10 lg of protein and 150 nm probe
were selected for use in the consecutive assays. After the ini-
tial incubation step, 2 lL of protein extract ⁄ probe mix was
pipetted into the plate wells in triplicate, and 9 lL of protein
A acceptor beads (working concentration of 50 lgÆmL
)1
)
preincubated for 1 h with antibody against HSF1 (working
concentration of 2 lgÆmL
)1
) was added. The plates were cov-
ered and incubated at 4 °C in the dark for 30 min. Nine
microliters of streptavidin-coated donor beads (working con-
centration of 50 lgÆmL
)1
) was then added, and the plates
were covered and incubated at room temperature in the dark
for 1 h. The plates were read with an Envision Xcite instru-
ment (PerkinElmer Wallac, Turku, Finland). The final con-
centrations of the assay components in the wells were as
follows: probe, 0.75 nm; antibody, 0.8 lgÆmL
)1
; acceptor
and donor beads, both 20 lgÆmL
)1
. The amounts of protein
extract and poly(dIdC) in the wells were 1 lg and 0.1 lg,
respectively.
Competition experiments
For competition experiments with unlabeled probe, 1.5 lm
(10-fold excess) of unlabeled sense and antisense oligonucle-
otides were mixed, and the probe was prepared as described
above. Selected protein extracts were first incubated with
0.75–75 nm unlabeled probe on ice for 30 min, as described
above, and this was followed by addition of 1 lLof
150 nm biotinylated oligonucleotide probe and an addi-
tional 30 min incubation on ice. Two microliters of protein
extract ⁄ probe mix was pipetted into the plate wells. Subse-
quent bead addition and incubation steps were as described
above. For competition experiments with the antibody-
blocking HSF1 peptide, selected protein extracts were incu-
bated with biotinylated probe and pipetted into the plate
wells as described above. Nine microliters of protein A
acceptor beads (working concentration of 50 lgÆmL
)1
)
preincubated for 1 h with antibody against HSF1 (working
concentration of 2 lgÆ mL
)1
) and 0.06–312.5 nm HSF1 pep-
tide was then added to the wells. Thereafter, the assay was
continued as described above.
Acknowledgements
This work was supported by Center of Excellence
Grants from the Academy of Finland and University
of Turku (M. Nikinmaa and K. A. Vuori), the
Academy of Finland and A
˚
bo Akademi University
120
140
A
B
70
80
0102040
0153060
60
80
100
30
40
50
60
0
20
40
Counts ×10
3
0
10
20
0 102040
0153060
Counts ×10
3
Minutes
Minutes
Fig. 8. Time course of HSF1 DNA-binding activity in HeLa (A) and
MEF (B) cell samples. The length of heat shock treatment in min-
utes is indicated on the x-axis. The bars represent the mean counts
of triplicate wells, and the error bars represent standard deviations
of triplicate well counts. Representative EMSA autoradiographs of
corresponding samples are shown in the top left panels. The num-
bers above the autoradiograph indicate the length of heat shock
treatment in minutes.
K. A. Vuori et al. TransLISA
FEBS Journal 276 (2009) 7366–7374 ª 2009 The Authors Journal compilation ª 2009 FEBS 7373
(L. Sistonen), and the Turku Graduate School of
Biomedical Sciences (J. K. Ahlskog).
References
1 Wray G, Hahn M, Abouheif E, Balhoff J, Pizer M,
Rockman M & Romano L (2003) The evolution of
transcriptional regulation in eukaryotes. Mol Biol Evol
20, 1377–1419.
2 Anckar J & Sistonen L (2007) Heat shock factor 1 as a
coordinator of stress and developmental pathways. Adv
Exp Med Biol 594, 78–88.
3 Morimoto R (2008) Proteotoxic stress and inducible
chaperone networks in neurodegenerative disease and
aging. Genes Dev 22, 1427–1438.
4 Akerfelt M, Trouillet D, Mezger V & Sistonen L (2007)
Heat shock factors at a crossroad between stress and
development. Ann NY Acad Sci 1113, 15–27.
5 Mosser D, Theodorakis N & Morimoto R (1988) Coor-
dinate changes in heat shock element-binding activity
and HSP70 gene transcription rates in human cells.
Mol Cell Biol 8, 4736–4744.
6 Kerr L (1995) Electrophoretic mobility shift assay.
Methods Enzymol 254, 619–632.
7 Iwasaki T, Miyazaki W, Rokutanda N & Koibuchi N
(2008) Liquid chemiluminescent DNA pull-down assay
to measure nuclear receptor–DNA binding in solution.
BioTechniques 45, 445–448.
8 Galas D & Schmitz A (1978) DNAse footprinting: a
simple method for the detection of protein–DNA
binding specificity. Nucleic Acids Res 5, 3157–3170.
9 Orlando V (2000) Mapping chromosomal proteins
in vivo by formaldehyde-crosslinked-chromatin
immunoprecipitation. Trends Biochem Sci 25, 99–104.
10 Fields S & Song O (1989) A novel genetic system to
detect protein–protein interactions. Nature 340, 245–246.
11 MacBeath G & Schreiber S (2000) Printing proteins as
microarrays for high-throughput function determina-
tion. Science 289, 1760–1763.
12 Ullman E, Kirakossian H, Singh S, Wu Z, Irvin B,
Pease J, Switchenko A, Irvine J, Dafforn A & Skold
C (1994) Luminescent oxygen channeling immunoas-
say: measurement of particle binding kinetics by
chemiluminescence. Proc Natl Acad Sci USA 91,
5426–5430.
13 Ullman E, Kirakossian H, Switchenko A, Ishkanian J,
Ericson M, Wartchow C, Pirio M, Pease J, Irvin B,
Singh S et al. (1996) Luminescent oxygen channeling
assay (LOCI): sensitive, broadly applicable homo-
geneous immunoassay method. Clin Chem 42,
1518–1526.
14 Anckar J, Hietakangas V, Denessiouk K, Thiele D,
Johnson M & Sistonen L (2006) Inhibition of DNA
binding by differential sumoylation of heat shock fac-
tors. Mol Cell Biol 26, 955–964.
15 Sarge K, Murphy S & Morimoto R (1993) Activation
of heat shock gene transcription by heat shock factor 1
involves oligomerization, acquisition of DNA-binding
activity, and nuclear localization and can occur in the
absence of stress. Mol Cell Biol 13, 1392–1407.
16 Tate J & Ward G (2004) Interferences in immunoassay.
Clin Biochem Rev 25, 105–120.
17 Abravaya K, Phillips B & Morimoto R (1991) Attenua-
tion of the heat shock response in HeLa cells is medi-
ated by the release of bound heat shock transcription
factor and is modulated by changes in growth and in
heat shock temperatures. Genes Dev 5, 2117–2127.
18 Abravaya K, Phillips B & Morimoto R (1991) Heat
shock-induced interactions of heat shock transcription
factor and the human hsp70 promoter examined by
in vivo footprinting. Mol Cell Biol 11, 586–592.
19 Westerheide S, Anckar J, Stevens SJ, Sistonen L &
Morimoto R (2009) Stress-inducible regulation of heat
shock factor 1 by the deacetylase SIRT1. Science 323,
1063–1066.
20 Shi Y, Mosser D & Morimoto R (1998) Molecular
chaperones as HSF1-specific transcriptional repressors.
Genes Dev 12, 654–666.
TransLISA K. A. Vuori et al.
7374 FEBS Journal 276 (2009) 7366–7374 ª 2009 The Authors Journal compilation ª 2009 FEBS