Tài liệu Báo cáo khoa học: Down-regulation of reduced folate carrier may result in folate malabsorption across intestinal brush border membrane during experimental alcoholism docx
Bạn đang xem bản rút gọn của tài liệu. Xem và tải ngay bản đầy đủ của tài liệu tại đây (671.48 KB, 12 trang )
Down-regulation of reduced folate carrier may result in
folate malabsorption across intestinal brush border
membrane during experimental alcoholism
Abid Hamid
1
, Nissar Ahmad Wani
1
, Satyavati Rana
2
, Kim Vaiphei
3
, Akhtar Mahmood
4
and
Jyotdeep Kaur
1
1 Department of Biochemistry, Postgraduate Institute of Medical Education and Research, Chandigarh, India
2 Department of Gastroenterology, Postgraduate Institute of Medical Education and Research, Chandigarh, India
3 Department of Histopathology, Postgraduate Institute of Medical Education and Research, Chandigarh, India
4 Department of Biochemistry, Panjab University, Chandigarh, India
Keywords
alcoholism; brush border membrane; crypt–
villus axis; methylation; reduced folate
carrier
Correspondence
J. Kaur, Department of Biochemistry,
Postgraduate Institute of Medical Education
and Research, Chandigarh 160 012, India
Fax: +91 172 2744401 ⁄ 2745078
Tel: +91 172 2747585 5181
E-mail:
(Received 1 August 2007, revised 6 October
2007, accepted 17 October 2007)
doi:10.1111/j.1742-4658.2007.06150.x
Folate plays a critical role in maintaining normal metabolic, energy, differ-
entiation and growth status of all mammalian cells. The intestinal folate
uptake is tightly and diversely regulated, and disturbances in folate homeo-
stasis are observed in alcoholism, attributable, in part, to intestinal mal-
absorption of folate. The aim of this study was to delineate the regulatory
mechanisms of folate transport in intestinal absorptive epithelia in order to
obtain insights into folate malabsorption in a rat model of alcoholism. The
rats were fed 1 gÆkg
)1
body weight of ethanol daily for 3 months. A
reduced uptake of [
3
H]folic acid in intestinal brush border membrane was
observed over the course of ethanol administration for 3 months. Folate
transport exhibited saturable kinetics and the decreased intestinal brush
border membrane folate transport in chronic alcoholism was associated
with an increased K
m
value and a low V
max
value. Importantly, the lower
intestinal [
3
H]folic acid uptake in ethanol-fed rats was observed in all cell
fractions corresponding to villus tip, mid-villus and crypt base. RT-PCR
analysis for reduced folate carrier, the major folate transporter, revealed
that reduced folate carrier mRNA levels were decreased in jejunal tissue
derived from ethanol-fed rats. Parallel changes were observed in reduced
folate carrier protein levels in brush border membrane along the entire
crypt–villus axis. In addition, immunohistochemical staining for reduced
folate carrier protein showed that, in alcoholic conditions, deranged
reduced folate carrier localization was observed along the entire crypt–vil-
lus axis, with a more prominent effect in differentiating crypt base stem
cells. These changes in functional activity of the membrane transport sys-
tem were not caused by a general loss of intestinal architecture, and hence
can be attributed to the specific effect of ethanol ingestion on the folate
transport system. The low folate uptake activity observed in ethanol-fed
rats was found to be associated with decreased serum and red blood cell
folate levels, which might explain the observed jejunal genomic hypomethy-
lation. These findings offer possible mechanistic insights into folate mal-
absorption during alcoholism.
Abbreviations
BBM, brush border membrane; BBMV, brush border membrane vesicle; LAP, leucine aminopeptidase; RBC, red blood cell;
RFC, reduced folate carrier; SAM, S-adenosyl methionine.
FEBS Journal 274 (2007) 6317–6328 ª 2007 The Authors Journal compilation ª 2007 FEBS 6317
The mechanism of folate transport is under extensive
investigation because mammals require the ingestion
and absorption of preformed folates in order to
meet their needs for one-carbon moieties to sustain
key biosynthetic reactions [1]. In addition, the cellu-
lar concentration of folate cofactors, in different
oxidative states, governs the intricate network of
methylation reactions of DNA, RNA, proteins and
phospholipids [2]. The most well-characterized folate
transporter, the reduced folate carrier (RFC), is an
integral membrane protein of 65 kDa that medi-
ates the cellular uptake of reduced folates and anti-
folates, and is ubiquitously expressed in tissues [3],
consistent with its integral role in tissue folate
homeostasis [4].
Cellular folate concentrations are influenced by
folate availability, cellular folate transport efficiency,
folate polyglutamylation and turnover, specifically
through degradation [1]. These processes have been
found to provide a potential means of ensuring ade-
quate levels of RFC transcripts and protein in
response to tissue requirements for folate cofactors or
exogenous tissue or cell-specific signals [5,6].
Deficiency of folate is highly prevalent throughout
the world [7]. Moreover, alcohol-associated folate
deficiency has become a major health problem world-
wide [8,9], and can develop because of dietary inade-
quacy, intestinal malabsorption, altered hepatobiliary
metabolism and increased renal excretion [10,11].
However, it is a well-established fact that the pri-
mary effect of ethanol on folate metabolism is
reflected in intestinal malabsorption [12,13]. Previous
studies have demonstrated that both initial deconju-
gation and subsequent transport of monoglutamic
folate are impaired in alcoholics [14]. However, the
exact molecular mechanism regulating intestinal
folate transport in alcoholism is not yet clear. There-
fore, the aim of this study was to elucidate the
mechanisms of regulation of folate malabsorption
during chronic alcoholism. Under chronic alcoholic
conditions, the kinetic constants of the folate trans-
port process in intestinal brush border membrane
(BBM) were calculated, and the mRNA and protein
expression of a major folate transporter, RFC, was
studied. The investigation of the regulation of folate
transport via RFC expression in absorptive epithelia
may aid in the development of future therapeutic
strategies targeting the regulatory protein. In addi-
tion to alcoholism, folate malabsorption has also
been reported to occur in several intestinal diseases,
congenital disorders of the folate transport system,
drug interactions and intestinal resection, and may
involve similar mechanisms.
Results
There was no significant decrease in body weight of
ethanol-fed rats relative to the control group during
the course of the experiment. At the time of killing,
the mean body weights of rats in control and ethanol-
fed groups were 201 ± 8 and 196 ± 9 g, respectively.
Estimation of blood alcohol levels
In order to establish the suitability of the rat model
for studies on experimental alcoholism using our
experimental set-up, the blood alcohol level was a pre-
requisite parameter. It was found that the alcohol level
was 88% higher ( P < 0.001) in the chronic ethanol-
fed group than in the control group. The mean
blood alcohol levels were 15.04 ± 1.96 and
1.77 ± 0.34 mgÆdL
)1
in the ethanol-fed and control
groups, respectively.
Purity of membrane vesicles
The membrane vesicle preparations were evaluated for
purity by biochemical, morphological and functional
criteria. The specific activities of alkaline phosphatase
and sodium–potassium adenosine triphosphatase
(Na
+
,K
+
-ATPase) were studied to check the purity of
BBM vesicles (BBMVs). A 12–15-fold increase in alka-
line phosphatase activity was observed in isolated
BBMVs, with a minimum activity of Na
+
,K
+
-ATPase,
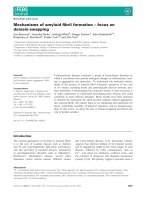
relative to the respective homogenates. Transmission
electron micrographs revealed sealed and intact vesicles
without contamination of subcellular organelles, and
were similar in the two groups of rats with ‘right side
out’ orientation (Fig. 1A,B). The functional integrity of
intestinal BBMVs was checked using [
14
C]d-glucose
uptake, which revealed a transient overshoot of the
intravesicular glucose concentration over its equilib-
rium uptake in the presence of a sodium gradient (data
not shown). [
3
H]Folic acid transport, measured by
incubating BBMVs for various time intervals, was
found to be at a maximum at 30 s in both control and
ethanol-fed groups, as described previously [15]. For
further experiments, a 30 s time interval was chosen for
the determination of the initial uptake. Moreover,
[
3
H]folic acid uptake revealed no significant difference
between fresh and frozen vesicles. In the control group,
the uptake was observed to be 36.20 ± 3.20 and
35.29 ± 2.20 pmolÆ(30 s)
)1
Æmg
)1
protein in fresh and
frozen BBMVs, respectively, in comparison with
19.69 ± 1.90 and 19.06 ± 2.81 pmolÆ(30 s)
)1
Æmg
)1
protein in the ethanol-fed group. Therefore, for further
studies, frozen reconstituted vesicles were used.
Intestinal folate malabsorption in alcoholism A. Hamid et al.
6318 FEBS Journal 274 (2007) 6317–6328 ª 2007 The Authors Journal compilation ª 2007 FEBS
[
3
H]Folic acid uptake
For all the assays, except folic acid transport during
the course of the study, BBMVs were isolated at the
end of 3 months of treatment.
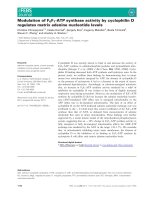
Folic acid transport during the course of the study
Folic acid uptake into BBMVs from control and etha-
nol-fed rats was studied at 1.5, 2 and 3 months during
the course of chronic ethanol dosing. Ethanol-fed rats
showed a decrease in [
3
H]folic acid transport, of the
order of 24, 55 and 62%, respectively, relative to the
control group (Fig. 2). Thus, malabsorption of folate
was observed over the entire course of ethanol treat-
ment of 3 months.
Determination of the kinetic constants of [
3
H]folic acid
uptake in BBMVs
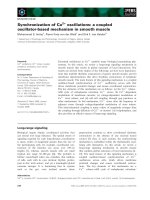
The effect of substrate concentration on [
3
H]folic acid
transport in BBMVs from control and ethanol-fed rats
after 3 months of treatment was determined by varying
the [
3
H]folic acid concentration from 0.125 to 1.50 lm
(i.e. within the physiological range). When transport
was plotted versus substrate concentration (Fig. 3), the
curve showed a plateau at about 1.00 lm in both
groups. From 0.125 to 1.0 lm of folic acid, the uptake
was 21–39% less in the ethanol-fed group (P < 0.01,
P < 0.001). From the data, the kinetic constants K
m
and V
max
for folic acid transport were determined
from the Lineweaver–Burk plot (Fig. 3, inset). The K
m
values for control and ethanol-fed groups were found
to be 0.90 ± 0.08 and 1.53 ± 0.09 lm (P < 0.01),
respectively. The V
max
values for control and ethanol-
fed groups were found to be 100 ± 5.60 and
83 ± 3.65 pmolÆ(30 s)
)1
Æmg
)1
protein (P < 0.05),
respectively.
Folate transport across the crypt–villus axis
of the intestine
The cell fractions (F1–F9) were isolated from the
small intestine of both groups of rats at the end of
AB
Fig. 1. Electron micrographs (· 60 000) of
representative BBMVs with uniform shape
showing sealed outer surfaces and ‘right
side out’ orientation: (A) control group;
(B) ethanol-fed group.
0
10
20
30
40
1.5 months 2 months 3 months
Control
Ethanol
***
***
***
V(pmol/30 sec/mg protein)
Fig. 2. [
3
H]Folic acid transport in intestinal BBMVs at different
intervals during the course of ethanol administration. An incubation
buffer of pH 5.5 and a [
3
H]folic acid concentration of 0.5 lM
were used for uptake measurements. Each data point is the
mean ± standard deviation of eight separate uptake determinations
carried out in triplicate. ***P < 0.001 versus control.
10
20
30
40
50
60
Control
Ethanol
***
0 0.5 1 1.5
[S] (µ
M
)
***
**
***
**
V(pmol/30 sec/mg protein)
Fig. 3. [
3
H]Folic acid uptake in intestinal BBMVs as a function of
substrate concentration (inset Lineweaver–Burk plot). Uptake was
measured by varying the [
3
H]folic acid concentration from 0.125 to
1.50 l
M in an incubation medium of pH 5.5 after incubating BBMVs
for 30 s. Each data point is the mean ± standard deviation of eight
separate uptake determinations carried out in triplicate. **P < 0.01,
***P < 0.001 versus control.
A. Hamid et al. Intestinal folate malabsorption in alcoholism
FEBS Journal 274 (2007) 6317–6328 ª 2007 The Authors Journal compilation ª 2007 FEBS 6319
3 months of treatment, and were characterized by an
approximate eight-fold decrease in specific activity of
the villus cell marker enzyme alkaline phosphatase
from F1 (villus tip) to F9 (crypt base) (data not
shown). In addition, isolated epithelial cells were
characterized by measuring the DNA content and
[
3
H]thymidine incorporation into DNA of various
cell fractions, as described previously [16]. On the
basis of the distribution patterns of the cell markers,
the nine cell fractions were grouped as villus tip
(F1–F3), mid-villus (F4–F6) and crypt (F7–F9) cells,
representing differentiated, differentiating and prolif-
erating enterocytes, respectively. Folate transport
from the respective BBMVs was studied. It was
observed to be 24% higher at the villus tip than
at the crypt base (P < 0.01) in the control
group; this increase was found to be 33% in the
ethanol-fed group (P < 0.001). Ethanol feeding
resulted in a significant decrease in folate transport
along the entire crypt–villus axis, the decrease being
at a maximum (50%) at the crypt base (data not
shown).
Expression of mRNA corresponding to RFC
in the intestine
The finding that the folic acid uptake process has an
apparent K
m
value in the micromolar range [17]
strongly suggests that the process is carrier mediated.
In order to elucidate the mechanism of reduced folate
transport in chronic alcoholism, transcriptional and
translational regulation of RFC was studied. For
mRNA expression, total RNA was isolated from the
upper 1 cm of jejunal tissue from both groups of rats.
RT-PCR analysis was performed with the use of gene-
specific primers corresponding to a sequence in the
open reading frame of rat RFC and b-actin (as an
internal control); products of 489 and 588 bp for RFC
and b-actin, respectively, were obtained on electropho-
resis using a 1.2% agarose gel. From densitometric
analysis, it was deduced that the expression of mRNA
coding for RFC was three-fold lower during chronic
ethanol feeding (Fig. 4A,B). Thus, ethanol imparts its
effect through transcriptional regulation of RFC at the
primary absorptive site of folic acid, i.e. the small
intestine.
Expression of the RFC protein in BBM of the
intestine
The effect of chronic alcoholism on the level of expres-
sion of the RFC protein at the BBM surface was
studied by western blot analysis. Analysis of purified
BBMVs was performed to identify RFC using
polyclonal antibodies raised against a specific region of
rat RFC; reactivity was found at approximately
65 kDa. Moreover, there was no cross-reaction of
RFC antibodies against any protein in the vesicular
preparations used. Antisera against the leucine amino-
peptidase (LAP) showed reactivity at 80 kDa, which
served as an internal control. LAP is a membrane-
bound aminopeptidase whose activity has been found
to be unaffected by chronic ethanol feeding [18,19].
The expression of the RFC protein was observed to be
2.3-fold higher in BBMVs from the control group rela-
tive to those from the chronic ethanol-fed group
(Fig. 5A,B). When studied along the crypt–villus axis
in BBMVs isolated from different cell types from the
two groups of rats, maximum RFC expression in the
control group was observed in the villus tip membrane,
followed by the mid-villus and then the crypt base
(Fig. 6A,B). In comparison with the villus tip of the
control group, there was a two- and 2.5-fold lower
RFC expression in the mid-villus and crypt base
BBMVs, respectively. However, in the ethanol-fed
group, RFC expression was observed to be at a maxi-
mum at the villus tip, with equal expression in the
mid-villus and crypt base, which was three-fold less
than that at the villus tip. Notably, ethanol feeding
reduced the expression of RFC protein in membranes
isolated from cells along the entire crypt–villus axis
(Fig. 6A,B).
12
Control Ethanol
***
0.6B
A
0.4
0.2
0
Mean relative RFC
levels (RFC/β-actin)
34 5 6
588
489
Fig. 4. RT-PCR analysis of RFC and b-actin (internal control) in jeju-
nal tissues: (A) resolved on 1.2% agarose gel electrophoresis; (B)
densitometric analysis representing relative change in RFC mRNA
expression. Data shown are the mean of eight separate sets of
experiments. ***P < 0.001 versus control. Lanes 1, 2, control;
lanes 3–5, ethanol; lane 6, negative control.
Intestinal folate malabsorption in alcoholism A. Hamid et al.
6320 FEBS Journal 274 (2007) 6317–6328 ª 2007 The Authors Journal compilation ª 2007 FEBS
RFC distribution and localization across the
intestinal vertical axis
The distribution pattern of RFC protein was deter-
mined by immunohistochemical localization. In control
rats, localization of RFC was mainly seen along the
epithelial cells of the villus lining; stronger expression
was localized along the tip epithelial cells and towards
the enterocyte brush border, and positive cells were
visible up to the base of the villi, i.e. at the villus–crypt
junction. However, there was a gradual decrease in
intensity from villus to crypt cells (Fig. 7A). In etha-
nol-fed rats, there was a marked decrease in the inten-
sity of positively stained cells; only a few cells along
the tip of the villi and mid-villus showed positivity
(Fig. 7B). No staining was detected in the sections
incubated with only secondary antibody. Furthermore,
RFC protein was not detected in the lamina propria,
muscularis mucosa, submucosa, muscularis externa or
smooth muscle cells of the small intestine (data not
shown).
Histochemical assessment of jejunal sections
After visualizing the slides under a light microscope,
no changes in intestinal architecture were observed
in the intestinal tissues from control (Fig. 8A) and
ethanol-fed (Fig. 8B) rats. However, ethanol-fed
rats showed mucodepletion and an increase in intra-
epithelial lymphocytes of the epithelial cells of the
villus lining. There was no evidence of any haemor-
rhagic mucosal lesions in the intestines of ethanol-fed
rats.
Estimation of serum and red blood cell (RBC)
folate levels
As this study dealt with folate malabsorption during
alcoholism, it was important to determine the folate
levels at the end of ethanol treatment. The results
showed that a significant (P < 0.001) decrease (32%)
in serum folate levels occurred in the chronic ethanol-
fed group; the mean serum folate levels were
49.64 ± 5.29 and 33.71 ± 4.95 lgÆL
)1
in control and
ethanol-fed rats, respectively. In addition, the RBC
folate concentration showed a 34% decrease
(P < 0.001) in chronic ethanol-fed rats, with mean
values of 950 ± 29.84 and 624 ± 49.73 lgÆL
)1
in con-
trol and ethanol-fed rats, respectively.
DNA methylation profile of jejunal tissue
DNA from highly proliferating jejunal tissue was iso-
lated, and methylation was studied using the amount
of labelled S-adenosyl methionine (SAM) incorpo-
rated into DNA (Fig. 9). The amount of SAM
incorporated into DNA is inversely proportional to
the degree of methylation. It was observed that
DNA from the ethanol-fed group incorporated eight-
fold more SAM relative to that from the control
80kDa
12
~65kDa
Control
0
1
2
3
4
5
Ethanol
***
Mean relative RFC protein
levels (RFC/LAP)
A
B
Fig. 5. (A) Western blot analysis of intestinal BBMVs using anti-
RFC (65 kDa) and anti-LAP (80 kDa) IgG. (B) Densitometric analysis
representing the relative change in RFC protein levels. Data shown
are the mean of eight separate sets of experiments. Lane 1, con-
trol; lane 2, ethanol. ***P < 0.001 versus control.
80kDa
~65kDa
12345
Villus tip
Mid villus
Crypt base
Control
1.00
###
###
###
###
***
**
**
0.75
0.50
0.25
0
Ethanol
6
Mean relative RFC protein
levels (RFC/LAP)
A
B
Fig. 6. (A) Western blot analysis of BBMVs isolated from the intes-
tinal villus tip, mid-villus and crypt base cells using anti-RFC
(65 kDa) and anti-LAP (80 kDa) IgG. (B) Densitometric analysis rep-
resenting the relative change in RFC protein levels. Data shown are
the mean of four separate sets of experiments. Lanes 1, 4, villus
tip; lanes 2, 5, mid-villus; lanes 3, 6, crypt base (lanes
1–3, control; lanes 4–6, ethanol). **P < 0.01, ***P < 0.001 versus
the respective control. ###P < 0.001 versus villus tip of respective
group.
A. Hamid et al. Intestinal folate malabsorption in alcoholism
FEBS Journal 274 (2007) 6317–6328 ª 2007 The Authors Journal compilation ª 2007 FEBS 6321
group. Such results indicate a decrease in the
degree of methylation of DNA in chronic ethanol-
fed rats.
Discussion
Chronic alcoholism is often associated with folate defi-
ciency, which is mainly a result of malabsorption of
folate across the intestinal membrane [12,20]. In a rat
model of experimental alcoholism, we examined the
mechanism of the regulation of folate transport medi-
ated by RFC, the major folate transporter protein in
the intestine. It was observed that a significant concen-
tration of blood alcohol was maintained when deter-
mined 24 h after the last dose of ethanol of 1 gÆkg
)1
body weight per day at the end of a 3 month course.
Such a dose was chosen according to earlier studies
[21], which suggested that the ethanol concentration of
jejunal tissue should not exceed 6% in animal experi-
ments in order to be relevant to the human intestine.
In the present study, 1 gÆkg
)1
body weight of ethanol
AB
Fig. 7. Immunohistochemical analysis of rat
jejunal sections exposed to anti-RFC IgGs,
showing relative localization and distribution
pattern of RFC protein (as depicted by
brown counterstaining of haematoxylin)
along the intestinal absorptive axis. Figures
(· 450) shown are representative of each
group: (A) control; (B) ethanol.
AB
Fig. 8. Haematoxylin–eosin staining of jeju-
nal sections, showing no change in intesti-
nal architecture after chronic ethanol
ingestion. Figures (· 450) shown are repre-
sentative of each group: (A) control; (B) eth-
anol.
Control
80
60
40
20
SAM utilized
(µMx10
3
/µg DNA)
0
Ethanol
***
Fig. 9. [
3
H]-labelled SAM incorporated (lMÆlg
)1
jejunal DNA) as an
index of jejunal DNA methylation profile. Values are means ± stan-
dard deviation (n ¼ 8). ***P < 0.001 versus control.
Intestinal folate malabsorption in alcoholism A. Hamid et al.
6322 FEBS Journal 274 (2007) 6317–6328 ª 2007 The Authors Journal compilation ª 2007 FEBS
(20% solution) per day produced nontoxic blood alco-
hol concentrations, and rats showed no significant his-
tological alterations in the intestinal mucosa and no
clinical signs of intoxication [22].
A significant decrease in folic acid uptake by
BBMVs in the chronic ethanol-fed group, which
appeared even after 1.5 months of treatment, suggests
that ethanol feeding has a profound malabsorptive
effect on folate uptake, which may be of biological sig-
nificance. The decrease was associated with an increase
in K
m
and a decrease in V
max
, suggesting that both the
affinity of the transporter and the number of trans-
porter sites on BBMVs are reduced after chronic etha-
nol ingestion. The increase in K
m
may also suggest
that an alternative route of folate transport is opera-
tional after chronic ethanol feeding. These observa-
tions confirmed an earlier study which was carried out
at toxic blood alcohol levels in the micropig model of
chronic alcoholism [20]. In order to evaluate the mech-
anism of reduced folate uptake, the expression profile
of RFC was of prime importance, as RFC is believed
to be a major folate carrier responsible for intestinal
folate absorption [15,23], although recently a proton-
coupled folate transporter has been found to play an
essential role in folate absorption in the intestine [24].
The decreased V
max
value of intestinal folate uptake
observed in chronic ethanol-fed rats was found to be
associated with a marked decrease in the intestinal
mRNA level of RFC. In the present study, only jejunal
tissue was used for expression studies, as earlier inves-
tigations [25] have established that the jejunum is the
preferred site of absorption of exogenous folate. The
finding that transcripts were reduced by more than
three-fold, whereas transport, as V
max
, was reduced by
less than two-fold, might suggest that chronic ethanol
ingestion in rats has differential effects on the tran-
scriptional and post-transcriptional regulation of RFC,
or on the stability of the RFC mRNA and protein.
Alternatively, another route of folate transport may be
up-regulated in alcoholic conditions. In this regard, the
proton-coupled folate transporter may be suggested to
play an important role in intestinal folic acid trans-
port; however, its mechanism and specificity in
alcoholism need to be evaluated independently. Fur-
thermore, western blot analysis of BBMVs revealed
that the down-regulation of RFC at the protein level
paralleled that of mRNA analysis. The decreased RFC
protein molecules in BBMVs may reflect either greater
turnover or reduced synthesis of transporter molecules
during alcoholism. In addition, RFC was less promi-
nently expressed at the basolateral surface; moreover,
down-regulation was evident at the basolateral mem-
brane during alcoholism (A. Hamid et al., unpublished
data). Earlier studies carried out in models of dietary
folate deficiency support our findings that transcrip-
tional regulatory mechanisms operate in the folate
transport system via RFC [17,26].
The role of RFC regulation across the crypt–villus
axis during alcoholism was evaluated. It was observed
that the apical membrane folate transport activity was
greatest in differentiated upper villus cells, followed by
differentiating mid-villus cells, and lowest in proliferat-
ing cells, and the proportional distribution of the RFC
protein was found along the entire crypt–villus axis.
These results were in accordance with earlier studies
[27], where a similar RFC distribution was shown to
exist across the crypt–villus axis. Importantly, chronic
ethanol feeding decreased RFC protein expression
along the entire crypt–villus axis. In addition, the
higher level of RFC protein in villus tip cells suggests
that a larger number of folate transporters are
expressed at the villus tip and that the redistribution
of RFC occurs with the maturation of intestinal stem
cells. Such findings correlate with the observed higher
rate of folate uptake in villus tip cells relative to crypt
base cells. A similar distribution has been reported
previously for biotin uptake [28].
Consistent with immunoblot analysis, immunohisto-
chemical staining revealed RFC localization along the
entire crypt–villus axis; moreover, staining was signifi-
cantly more intense in epithelial cells lining the villus
tip and decreased towards the crypt–villus junction in
the control group. A stronger expression was observed
towards the enterocyte BBM. In the chronic ethanol-
fed group, RFC was evident at the villus tip, decreased
significantly in the mid-villus and was hardly notice-
able in the crypt base. However, only a few positive
cells along the villus tip and mid-villus could be seen
during immunohistochemical staining. Thus, chronic
ethanol feeding imparts its effect more strongly in pro-
liferating and differentiating cells in the context of
RFC recruitment in the intestine. Such a condition is
detrimental to the cell and represents the severe patho-
physiological condition in alcoholics, not only with
respect to body folate homeostasis, but also because
crypt cells form the intestinal stem cells and require
regulated RFC expression for the sustained supply of
folate to meet the burden of the high proliferation and
turnover of these cells. Importantly, there was no
change in the villus architecture during ethanol inges-
tion, suggesting that the observed reduced folate
uptake is a specific effect of ethanol, rather than a
secondary effect caused by a general loss of intestinal
epithelial architecture. Furthermore, the significant
decrease in serum and RBC folate levels in the etha-
nol-fed group in this study was an expected finding, as
A. Hamid et al. Intestinal folate malabsorption in alcoholism
FEBS Journal 274 (2007) 6317–6328 ª 2007 The Authors Journal compilation ª 2007 FEBS 6323
reduced intestinal folate uptake associated with
decreased expression of RFC will influence body folate
homeostasis. These results may explain indirectly the
observations in a recent study [8], where chronic alco-
hol ingestion for 4 weeks in rats was found to be asso-
ciated with hyperhomocysteinaemia and lower levels of
SAM. The low folate levels result in low SAM levels
which, in turn, may influence DNA methylation, as
reflected by the observed hypomethylated jejunal DNA
in alcohol-fed rats. Our study is in agreement with that
of Choi et al. [29], who observed hypomethylation of
colonic mucosal DNA in rats after chronic ethanol
ingestion, although no systemic folate reduction was
observed, by contrast with our study. Such a discrep-
ancy may be attributed to the different methods
employed for ethanol administration and the restric-
tion of the study to 4 weeks only, in comparison with
3 months in our investigation. Regardless of how
chronic ethanol ingestion produces genomic DNA
hypomethylation of jejunal tissue in rats, it may have
implications regarding the mechanism(s) by which
chronic alcohol exposure increases the risk of different
cancers in humans.
Taken together, the results show that chronic etha-
nol ingestion leads to decreased intestinal BBM folic
acid uptake and reduced jejunal mRNA levels encoded
by RFC, resulting in low RFC protein levels and
recruitment along the entire BBM of the crypt–villus
axis. The decreased transport efficiency of intestinal
BBM is reflected in reduced serum and RBC folate lev-
els, which may result in the observed hypomethylation
of jejunal DNA.
Experimental procedures
Chemicals
Radiolabelled [3¢,5¢,7,9-
3
H]folic acid, potassium salt
(specific activity, 24.0 CiÆ mmol
)1
) and S-adenosyl-
[methyl-
3
H]methionine (specific activity, 70.0 CiÆmmol
)1
)
were purchased from Amersham Pharmacia Biotech (Kwai
Chung, Hong Kong). d-[U-
14
C]Glucose (specific activity,
140 mCiÆmmol
)1
) was provided by Bhabha Atomic
Research Centre, Mumbai, India. Prokaryotic CpG DNA
methyl transferase was obtained from New England Biolabs
(Beverly, MA, USA). A Moloney murine leukaemia virus
reverse transcriptase kit (RevertAid
TM
M-MuLV RT) was
purchased from MBI Fermentas Life Sciences (Rockville,
MD, USA). RNAlater (RNA stabilization solution) and
diethylpyrocarbonate were obtained from Ambion, Inc.
(Austin, TX, USA) and Amresco (Solon, OH, USA)
respectively. Methotrexate, bovine serum albumin and
d,l-dithiothreitol or Cleland’s reagent were purchased from
Sigma-Aldrich Co. (St Louis, MO, USA). Cellulose nitrate
membrane filters (0.45 lm) were obtained from Millipore
Corporation (Bedford, MA, USA).
Animals
Young adult male albino rats (Wistar strain), weighing
100–150 g, were obtained from the Postgraduate Institute
of Medical Education and Research’s Central Animal
House (Chandigarh, India). The rats were housed in clean
wire mesh cages with controlled temperature (23 ± 1 °C)
and humidity (45–55%) and with a 12 h ⁄ 12 h dark ⁄ light
cycle throughout the study. The rats were randomized into
two groups of eight animals each, such that the mean body
weights and range of body weights for each group of ani-
mals were similar. The rats in group I were given 1 gÆkg
)1
body weight of ethanol (20% solution) per day for
3 months, and those in group II received an isocaloric
amount of sucrose (36% solution) orally by Ryle’s tube
daily for 3 months. Such a dose does not produce a toxic
blood alcohol concentration [21] and is therefore relevant
to human studies. The rats were fed a commercially avail-
able pellet diet (Ashirwad Industries, Chandigarh, India)
containing 2 mgÆkg
)1
folic acid and water ad libitum. The
body weights of the rats were recorded twice weekly.
Animals from both groups were killed under anaesthesia
using sodium pentothal, and blood was drawn from the tail
vein for alcohol and folate estimations. Starting from the
ligament of Treitz, two-thirds of the small intestine was
removed, flushed with ice-cold saline and processed for the
isolation of cells.
The protocol of the study was approved by the Institu-
tional Animal Ethical Committee (IAEC) and the Institu-
tional Biosafety Committee (IBC).
Estimation of blood alcohol levels
Alcohol was estimated from whole blood drawn from rats
24 h after the last dose of ethanol at the end of the treat-
ment period using the alcohol dehydrogenase method [30].
Isolation of intestinal epithelial cells
The intestinal epithelial cells were isolated following the
method of Weiser [31] with modifications. The upper two-
thirds of the small intestine was cut and flushed two to
three times with 0.9% saline. One end of the intestine was
tied with a thread and filled with rinsing buffer containing
1mmd,l-dithiothreitol in normal saline. The rinsing buffer
was then replaced with a solution consisting of 1.5 mm
KCl, 96 mm NaCl, 27 mm sodium citrate, 8 mm KH
2
PO
4
and 8 mm Na
2
HPO
4
, and kept at 37 °C for 15 min in a
beaker containing NaCl ⁄ P
i
. The intestine was then filled
with a solution containing 1.5 mm EDTA and 0.5 mm
Intestinal folate malabsorption in alcoholism A. Hamid et al.
6324 FEBS Journal 274 (2007) 6317–6328 ª 2007 The Authors Journal compilation ª 2007 FEBS
d,l-dithiothreitol in NaCl ⁄ P
i
, and kept at 37 °C in a shaker
at 100 r.p.m. for 30 min; the solution was then collected for
the isolation of total enterocytes. Furthermore, small intes-
tinal epithelial cells enriched in enterocytes of different ori-
gins along the crypt–villus axis were also isolated. In this
case, different cell fractions were collected after filling the
intestine for different time intervals. Fractions 1–3 were col-
lected at 4, 2 and 2 min intervals, fractions 4–6 at 3, 4 and
5 min intervals, and fractions 7–9 at 7, 10 and 15 min inter-
vals. Each consecutive three fractions were pooled and
represented the villus tip, mid-villus and crypt base cells,
respectively. The collected cells were centrifuged at 800 g
for 15 min. The pellet contents were mixed with a Pasteur
pipette and centrifuged at 800 g for 10 min after the addition
of 5 mL of cold NaCl ⁄ P
i
. Two more NaCl ⁄ P
i
washings were
performed. These cells were then used for BBM isolation.
Preparation of BBMVs from isolated intestinal
epithelial cells
BBMVs were prepared from isolated total intestinal cells
from control and ethanol-fed rats at different time intervals
during the course of treatment at 4 °C by the method of
Kessler et al. [32] with some modifications. The final pellet
containing cells was homogenized by adding 2 mm
Tris)50 mm mannitol buffer, and 10 m m MgCl
2
was added
to the homogenate followed by intermittent shaking for
10 min. The contents were centrifuged at 3000 g for 15 min
and the supernatant was then run at 27 000 g for 30 min.
The pellet thus obtained was suspended in a small amount
of loading buffer containing 280 mm mannitol and 20 mm
Hepes–Tris, pH 7.4, and centrifuged at 27 000 g for
30 min. The final pellet obtained was suspended in loading
buffer so as to obtain a protein concentration of approxi-
mately 5 mgÆmL
)1
. These BBMVs were used to study
[
3
H]folic acid uptake at 1.5, 2 and 3 months of ethanol
treatment. Experiments to determine kinetic constants and
western blot analysis were carried out using BBMV prepa-
rations from rats fed ethanol for 3 months.
BBMVs were also isolated from cells representing the vil-
lus tip, mid-villus and crypt base from rats sacrificed at the
end of treatment. The respective cell fractions from two
animals were pooled for this purpose to obtain sufficient
BBMVs. These BBMVs were used to determine [
3
H]folic
acid uptake across the crypt–villus axis and to analyse the
RFC protein levels in different cell types.
Assessment of morphological purity of
membrane vesicles by transmission electron
microscopy
The final BBMV preparations obtained were suspended in
NaCl ⁄ P
i
and centrifuged at 27 000 g for 30 min. Vesicular
suspensions were fixed at 4 °C in 3% buffered glutaralde-
hyde for 5–6 h and centrifuged at 10 000 g for 10 min.
Suspensions were gently rinsed twice with 0.2 m NaCl ⁄ P
i
at
4 °C and postfixed for 1 h at 4 °C with 1% buffered
osmium tetroxide. After dehydration in 70%, 90% and
absolute ethanol for 2 h, 20 min and 1 h, respectively, the
suspensions were treated with propylene oxide at room tem-
perature. The preparations were embedded in epoxy resin
TAAB-812 (TAAB Laboratories, Aldermaston, UK) and
polymerized for 24 h at 60 °C. Semi-thin sections were
placed on microslides, stained with 0.5% alkaline toluidine
blue and examined under a light microscope to verify the
areas of intensity. Ultrathin sections (60 nm) were cut,
placed on metal grids, stained on ultracut E (Reichert-Jung,
Nuslock, Germany) and double stained with uranyl acetate
and lead citrate. The microslides were then examined under
a Zeiss EM-906 transmission electron microscope (Carl
Zeiss, Dresden, Germany).
Transport of [
3
H]folic acid
Uptake studies were performed at 37 °C using incubation
buffer containing 100 mm NaCl, 80 mm mannitol, 10 mm
Hepes, 10 mm 2-morpholinoethanesulfonic acid, pH 5.5,
and 0.5 lm [
3
H]folic acid, unless otherwise noted. Isolated
BBMVs (10 lL; 50 lg protein) from control and ethanol-
fed rats were added to incubation buffer containing
[
3
H]folic acid of known concentration for different specific
assays. Reaction was stopped by the addition of ice-cold
stop solution containing 280 mm mannitol and 20 mm
Hepes–Tris, pH 7.4, followed by rapid vacuum filtration.
Nonspecific binding to the filters was determined by resid-
ual filter counts after filtration of the incubation buffer and
labelled substrate without vesicles [33,34]. The radioactivity
retained by the filters was determined by liquid scintillation
counting (Beckman Coulter LS 6500, Beckman Coulter,
Fullerton, CA, USA). For the determination of the kinetic
constants K
m
and V
max
, transport of [
3
H]folic acid was
measured by varying the concentration of [
3
H]folic acid
from 0.125 to 1.50 lm in the incubation buffer at pH 5.5.
RT-PCR analysis
Total RNA from all animals was isolated from the upper
1 cm of jejunal tissues following the method of Chomeczyn-
ski and Sacchi [35]. cDNA synthesis was carried out from
the purified and intact total RNA, according to the manu-
facturer’s instructions (MBI Life Sciences). Expression of
RFC and b-actin was evaluated using sequence-specific
primers corresponding to the sequence in the open reading
frame. A 20 lL PCR mixture was prepared in 1 · PCR
buffer consisting of 0.6 U of Taq polymerase, 2 lm of each
primer (for both b-actin and RFC) and 200 lm of each
dNTP. In optimized PCR, the initial denaturation step was
carried out for 2 min at 95 °C. The denaturation, annealing
A. Hamid et al. Intestinal folate malabsorption in alcoholism
FEBS Journal 274 (2007) 6317–6328 ª 2007 The Authors Journal compilation ª 2007 FEBS 6325
and elongation steps were carried out for 1 min at 94 °C,
1 min at 68 °C and 1 min at 72 °C, respectively, for 35
cycles. The final extension step was carried out for 10 min
at 72 °C. The primers designed using primer3 input
(version 0.3.0) were as follows: RFC: forward, 5¢GA-
ACGTCCGGCAACCACAG3¢; reverse, 5¢GATGGACTT-
GGAGGCCCAG3¢; b-actin: forward, 5¢CACTGTGCCCA-
TCTATGAGGG3¢; reverse, 5¢TCCACATCTGCTGGAA-
GGTGG3¢. The expected PCR products of 489 and 588 bp
were obtained for RFC and b-actin, respectively, when
electrophoresed on a 1.2% agarose gel. The densitometric
analyses of the products were determined using scion
image software (Scion Image Corporation, Frederick, MD,
USA).
Western blot analysis
For protein expression studies, BBMVs (100–150 lg)
isolated from epithelial cell preparations (either total cells
or different cell fractions) were resolved by 10%
SDS ⁄ PAGE and transferred to nitrocellulose membrane
for 4–5 h at 4 °C (transfer at 25 V and 300 mA). Western
blotting was performed using the procedure described by
Towbin et al. [36], employing polyclonal primary anti-
bodies (rabbit anti-rat RFC, 1 : 500 dilution) kindly
provided by H. M. Said (University of California, Irvine,
USA). These were raised against a specific region of rat
RFC synthetic peptide corresponding to amino acids 495–
512. The polyclonal antibodies against LAP, an intestinal
brush border peptidase, were rabbit anti-rat LAP (1 : 500
dilution). Secondary antibodies were goat anti-rabbit IgG
[horseradish peroxidase (HRP)-labelled] (1 : 2000 dilution).
Blot quantification was carried out using scion image
software.
Immunohistochemical analysis
Freshly cut intestinal jejunal sections were cut into 2 cm
pieces and slit open, followed by fixing in a sufficient
amount of 10% formalin [37] using primary antibodies
[rabbit polyclonal anti-rat RFC (1 : 100)] and secondary
antibodies [goat anti-rabbit IgG (HRP-labelled) (1 : 500)].
Haematoxylin was employed for counterstaining.
Haematoxylin–eosin staining
Haematoxylin–eosin staining was carried out following
the routine histological method described by Kayser and
Bubenzer [38]. The haematoxylin–eosin staining technique
employs haematoxylin, which is a basic dye and stains
acidic components, such as nucleoproteins and muco-
polysaccharides, and eosin, which is an acidic dye and
stains the basic components present in cytoplasmic
proteins.
Estimation of folate by microbiological assay
Folate estimations were determined by micotitre plate assay
using Lactobacillus casei [39]. All steps were carried out in
aseptic conditions.
Genomic DNA methylation studies
DNA isolation was performed by the conventional method
using a lysis buffer containing proteinase K, as described
previously [29]. The methylation status of CpG sites in
genomic DNA was determined by the in vitro methyl accep-
tance capacity of DNA using S-adenosyl-[methyl-
3
H]methi-
onine as a methyl donor and a prokaryotic CpG DNA
methyltransferase [40].
Statistics
Each uptake assay was performed three times with eight
independent preparations from each group. The data were
computed as the mean ± standard deviation. Group means
were compared using Student’s t-test, and analysis of
variance was used when necessary. The acceptable level of
significance was P < 0.05 for each analysis.
Acknowledgements
Financial assistance by the Council of Scientific and
Industrial Research (CSIR), New Delhi, India is grate-
fully acknowledged.
References
1 Suh JR, Herbig AK & Stover PJ (2001) New perspec-
tives on folate catabolism. Annu Rev Nutr 21, 255–282.
2 Balamurugan K & Said HM (2006) Role of reduced
folate carrier in intestinal folate uptake. Am J Physiol
Cell Physiol 291, C189–C193.
3 Zhao R & Goldman ID (2003) Resistance to antifolates.
Oncogene 22, 7431–7457.
4 Sabharanjak S & Mayor S (2004) Folate receptor endo-
cytosis and trafficking. Adv Drug Deliv Rev 56, 1099–
1109.
5 Kumar CK, Nguyen TT, Gonzales FB & Said HM
(1998) Comparison of intestinal folate carrier clone
expressed in IEC-6 cells and in Xenopus oocytes. Am J
Physiol Cell Physiol 274, C289–C294.
6 Zhang L, Wong SC & Matherly LH (1998) Transcript
heterogeneity of the human reduced folate carrier results
from the use of multiple promoters and variable splicing
of alternative upstream exons. Biochem J 332, 773–780.
7 Novakovic P, Stempak JM, Sohn KJ & Kim YI (2006)
Effects of folate deficiency on gene expression in the
Intestinal folate malabsorption in alcoholism A. Hamid et al.
6326 FEBS Journal 274 (2007) 6317–6328 ª 2007 The Authors Journal compilation ª 2007 FEBS
apoptosis and cancer pathways in colon cancer cells.
Carcinogenesis 27, 916–924.
8 Sakuta H & Suzuki T (2005) Alcohol consumption and
plasma homocysteine. Alcohol 37, 73–77.
9 Yi P, Melnyk S, Pogribna M, Pogribny IP, Hine RJ &
James SJ (2000) Increase in plasma homocysteine
associated with parallel increases in plasma S-adenosyl-
homocysteine and lymphocyte DNA hypomethylation.
J Biol Chem 275, 29318–29323.
10 Schalinske KL & Nieman KM (2005) Disruption of
methyl group metabolism by ethanol. Nutr Rev 63, 387–
391.
11 Villanueva J, Chandler CJ, Shimasaki N, Tang AB, Na-
kamura M, Phinney SD & Halsted CH (1994) Effects of
ethanol feeding on liver, kidney and jejunal membranes
of micropigs. Hepatology 19, 1229–1240.
12 Halsted CH, Robles EA & Mezey E (1971) Decreased
jejunal uptake of labeled folic acid (
3
H-PGA) in alco-
holic patients: roles of alcohol and nutrition. N Engl
J Med 285, 701–706.
13 Mason JB & Choi SW (2005) Effects of alcohol on
folate metabolism: implications for carcinogenesis.
Alcohol 35, 235–241.
14 Purohit V, Abdelmalek MF, Barve S, Benevenga NJ,
Halsted CH, Kaplowitz N, Kharbanda KK, Liu QY,
Lu SC, McClain CJ, et al. (2007) Role of S-adenosyl-
methionine, folate, and betaine in the treatment of alco-
holic liver disease: summary of a symposium. Am J Clin
Nutr 86, 14–24.
15 Hamid A, Kaur J & Mahmood A (2007) Evaluation
of the kinetic properties of the folate transport
system in intestinal absorptive epithelium during
experimental ethanol ingestion. Mol Cell Biochem 304,
265–271.
16 Kaushik S & Kaur J (2005) Effect of chronic cold stress
on intestinal epithelial cell proliferation and inflamma-
tion in rats. Stress 8, 191–197.
17 Said HM, Chatterjee N, Haq RU, Subramanian VS,
Ortiz A, Matherly LH, Sirotnak FM, Halsted C &
Rubin SA (2000) Adaptive regulation of intestinal folate
uptake: effect of dietary folate deficiency. Am J Physiol
Cell Physiol 179, C1889–C1895.
18 Kaur J, Virender Jaswal MS, Nagpaul JP & Mahmood
A (1992) Chronic ethanol feeding and microvillus mem-
brane glycosylation in normal and protein malnourished
rat intestine. Nutrition 8, 338–342.
19 Kaur J, Nagpaul JP & Mahmood A (1994) Expression
of brush border enzymes in ethanol fed rat intestine.
Indian J Med Res 100, 289–294.
20 Villanueva JA, Devlin AM & Halsted CH (2001)
Reduced folate carrier: tissue distribution and effects of
chronic ethanol intake in the micropig. Alcohol Clin
Exp Res 25, 415–420.
21 Persson J (1991) Alcohol and the small intestine. Scand
J Gastroenterol 26, 3–15.
22 Muldoon RT & McMartin KE (1994) Ethanol acutely
impairs the renal conservation of 5-methyltetrahydrofo-
late in the isolated perfused rat kidney. Alcohol Clin
Exp Res 18, 333–339.
23 Matherly LH, Hou Z & Deng Y (2007) Human
reduced folate carrier: translation of basic biology to
cancer etiology and therapy. Cancer Metastasis Rev 26,
111–128.
24 Qiu A, Jansen M, Sakaris A, Min SH, Chattopadhyay
S, Tsai E, Sandoval C, Zhao R, Akabas MH & Gold-
man ID (2006) Identification of an intestinal folate
transporter and the molecular basis for hereditary folate
malabsorption. Cell 127, 917–928.
25 Said HM (2004) Recent advances in carrier-mediated
intestinal absorption of water-soluble vitamins. Annu
Rev Physiol 66, 419–446.
26 Subramanian VS, Chatterjee N & Said HM (2003)
Folate uptake in the human intestine: promoter activity
and effect of folate deficiency. J Cell Physiol 196 , 403–
408.
27 Balamurugan K & Said HM (2003) Ontogenic regula-
tion of folate transport across rat jejunal brush-border
membrane. Am J Physiol Gastrointest Liver Physiol 285,
G1068–G1073.
28 Chatterjee NS, Kumar CK, Ortiz A, Rubin SA & Said
HM (1999) Molecular mechanism of the intestinal bio-
tin transport process. Am J Physiol Cell Physiol 277,
C605–C613.
29 Choi SW, Stickel F, Baik HW, Kim YI, Seitz HK &
Mason JB (1999) Chronic alcohol consumption induces
genomic but not p53-specific DNA hypomethylation in
rat colon. J Nutr 129, 1945–1950.
30 Burtis CA & Ashwood ER (1994) Textbook of Clinical
Chemistry, 2nd edn. W.B. Saunders Co, Philadelphia,
PA.
31 Weiser MM (1973) Intestinal epithelial cell surface
membrane glycoprotein synthesis. I. An indicator of
cellular differentiation. J Biol Chem 248, 2536–2541.
32 Kessler M, Acuto O, Storelli C, Murer H, Muller M
& Samenza G (1978) A modified procedure for the
rapid preparation of efficiently transporting vesicles
from small intestinal brush border membranes.
Their use in investigating some properties of d-glucose
and choline transport. Biochim Biophys Acta 506,
136–154.
33 Hamid A & Kaur J (2005) Kinetic characteristics of
folate binding to rat renal brush border membrane in
chronic alcoholism. Mol Cell Biochem 280, 219–225.
34 Hamid A & Kaur J (2006) Chronic alcoholism alters
the transport characteristics of folate in rat renal brush
border membrane. Alcohol 38, 59–66.
35 Chomeczynski P & Sacchi N (1987) Single-step method
of RNA isolation by acid guanidinium thiocyanate–
phenol–chloroform extraction. Anal Biochem 162,
156–159.
A. Hamid et al. Intestinal folate malabsorption in alcoholism
FEBS Journal 274 (2007) 6317–6328 ª 2007 The Authors Journal compilation ª 2007 FEBS 6327
36 Towbin H, Staehelin T & Gordon J (1979) Electropho-
retic transfer of proteins from polyacrylamide gels to
nitrocellulose sheets: procedure and some applications.
Proc Natl Acad Sci USA 76, 4350–4354.
37 Zhang Y, Shao JS, Xie QM & Alpers DH (1996) Immu-
nolocalization of alkaline phosphatase and surfactant-
like particle proteins in rat duodenum during fat
absorption. Gastroenterology 110, 478–488.
38 Kayser K & Bubenzer J (1990) Microwave-assisted
staining procedures in routine histopathology. Histo-
chemistry J22, 365–370.
39 Tamura T (1990) Microbiological assay of folates. In
Folic Acid Metabolism in Health and Disease (Picciano
MF, Stokstad ELR & Gregory JF, eds), pp. 121–137.
Wiley-Liss, New York.
40 Kim YI, Christman JK, Fleet JC, Cravo ML, Salomon
RN, Smith D, Ordovas J, Selhub J & Mason JB (1995)
Moderate folate deficiency does not cause global hypo-
methylation of hepatic and colonic DNA or c-myc-spe-
cific hypomethylation of colonic DNA in rats. Am
J Clin Nutr 61, 1083–1090.
Intestinal folate malabsorption in alcoholism A. Hamid et al.
6328 FEBS Journal 274 (2007) 6317–6328 ª 2007 The Authors Journal compilation ª 2007 FEBS