Tài liệu Báo cáo khoa học: Analysis of the molecular dynamics of medaka nuage proteins by fluorescence correlation spectroscopy and fluorescence recovery after photobleaching doc
Bạn đang xem bản rút gọn của tài liệu. Xem và tải ngay bản đầy đủ của tài liệu tại đây (496.6 KB, 9 trang )
Analysis of the molecular dynamics of medaka nuage
proteins by fluorescence correlation spectroscopy and
fluorescence recovery after photobleaching
Issei Nagao
1,
*, Yumiko Aoki
2
, Minoru Tanaka
2
and Masataka Kinjo
1
1 Laboratory of Molecular Cell Dynamics, Faculty of Advanced Life Science, Hokkaido University, Sapporo, Japan
2 Laboratory of Molecular Genetics for Reproduction, National Institute for Basic Biology, Okazaki, Japan
In most animals, primordial germ cells (PGCs) develop
distinctly from other cell lineages at a very early
embryonic stage, migrate towards the prospective
gonadal area, and then differentiate into gametes in
the gonads. Formation of the PGC requires germ
plasm, which contains electron-dense structures called
nuages that are believed to contain the determinants of
germ cells [1,2]. Although the nuage was reported half
Keywords
fluorescence correlation spectroscopy;
fluorescence recovery after photobleaching;
medaka; primordial germ cell; vasa
Correspondence
M. Kinjo, Laboratory of Molecular Cell
Dynamics, Faculty of Advanced Life
Science, Hokkaido University, Kita 21
Nishi 11, Kita-ku, Sapporo 001-0021, Japan
Fax: +81 1 706 9006
Tel: +81 1 706 9005
E-mail:
*Present address
Biological Information Research Center,
National Institute of Advanced Industrial
Science and Technology (AIST) and Japan
Biological Informatics Consortium (JBIC),
Tokyo, Japan
Database
DNA data bank of Japan accession
numbers: olvas, AB063484; nanos3,
AB306931; tudor, AB306932
(Received 27 June 2007, revised 13
November 2007, accepted 21 November
2007)
doi:10.1111/j.1742-4658.2007.06204.x
The nuage is a unique organelle in animal germ cells that is known as an
electron-dense amorphous structure in the perinuclear region. Although the
nuage is essential for primordial germ cell (PGC) determination and devel-
opment, its roles and functions are poorly understood. Herein, we report
an analysis of the diffusion properties of the olvas gene product of the
medaka fish (Oryzias lapites) in PGCs prepared from embryos, using fluo-
rescence correlation spectroscopy and fluorescence recovery after photo-
bleaching. Olvas–green fluorescent protein (GFP) localized in granules
thought to be nuages, and exhibited a constraint movement with two-com-
ponent diffusion constants of 0.15 and 0.01 lm
2
Æs
)1
. On the other hand,
cytosolic Olvas–GFP was also observed to have a diffusion movement of
7.0 lm
2
Æs
)1
. Interestingly, Olvas–GFP could be expressed in HeLa cells,
and formed granules that were similar to nuages in medaka PGCs. Olvas–
GFP also exhibited a constraint movement in the granules and diffused in
the cytosol of HeLa cells, just as in the medaka embryo. The other two
gene products, Nanos and Tudor of the medaka, which are known as con-
stituents of the nuage, could also be expressed in HeLa cells and formed
granules that colocalized with Olvas–GFP. Nanos–GFP and Tudor–GFP
exhibited constraint movement in the granules and diffused in the cytosol
of HeLa cells. These results suggest that these granules in the HeLa cell are
not simple aggregations or rigid complexes, but dynamic structures consist-
ing of several proteins that shuttle back and forth between the cytosol and
the granules.
Abbreviations
CMV, cytomegalovirus; EGFP, enhanced green fluorescent protein; FAF, fluorescence autocorrelation function; FCS, fluorescence correlation
spectroscopy; FRAP, fluorescence recovery after photobleaching; GFP, green fluorescent protein; LSM, laser scanning microscopy;
PGC, primordial germ cell; RFP, red fluorescent protein.
FEBS Journal 275 (2008) 341–349 ª 2007 The Authors Journal compilation ª 2007 FEBS 341
a century ago, its roles and functions in animal germ
lines are poorly understood. Recently, it was reported
that, in Drosophila, the function of the nuage might be
related to the protection of the genome via repression
of the selfish genetic elements in the female germ line
[3]. The nuage is known to be an electron-dense struc-
ture; however, little is known about its dynamic prop-
erties of morphological change or component exchange
in the cytosol in the living cell. The nuage is composed
of large riboprotein complexes, and several proteins,
such as Vasa, Nanos and Tudor, have been identified
as important components. In Drosophila, these compo-
nents are essential for formation of the PGC [4], and
are thought to be involved in some aspect of transla-
tion in germ cells [5–7]. In the teleost fish medaka
(Oryzias latipes), Nanos and Olvas (Vasa homologs),
are expressed in PGCs in the early embryonic stages
[8–11], and are localized in granule-like structures
in the cytoplasm of the PGC (Y. Aoki, I. Nagao,
D. Saito, Y. Ebe, M. Kinjo & M. Tanaka, unpub-
lished results).
As a result of the recent progress in fluorescence
imaging methods and microscope technology, it has
become easy to visualize the localization of fluorescent-
ly tagged proteins, to quantitate their abundance, and
to investigate their dynamic properties such as mobility
and interactions. Fluorescence correlation spectroscopy
(FCS) and fluorescence recovery after photobleaching
(FRAP) are often used to assess the dynamics and
kinetic properties of proteins in living cells [12–19].
FCS detects the fluctuations of fluorescent intensity
derived from the movement of a single fluorescent
molecule in a very tiny observation area, which is
defined by the diffraction limit of a laser beam and the
volume of which is about 0.25 · 10
)15
L. The fluores-
cence autocorrelation function (FAF) calculated from
fluctuations of probes provides the diffusional proper-
ties of proteins [13] and binding interactions [14].
FRAP is a conventional technique used to study the
kinetic properties of proteins in a cell by measuring
the fluorescence recovery rate in a bleached area [20].
Unbleached molecules enter into the bleached area
from the outside, and the fluorescence intensity is
recorded by time-lapse microscopy. The recovery curve
provides qualitative and quantitative information such
as the diffusion constant and the amount of the mobile
fraction. Although FCS and FRAP also provide diffu-
sion properties of fluorescent molecules, these methods
can be taken to be complementary, because FCS is
well suited to fast processes occurring in microseconds
to milliseconds in the observation area, whereas FRAP
is preferable for slower processes that take from milli-
seconds to seconds [18,21,22].
Herein we report dynamic properties of proteins in
the PGC determined by FCS and FRAP. A fusion
protein consisting of Olvas and green fluorescent pro-
tein (GFP) (Olvas–GFP) expressed in the PGC forms
granules that exhibit an amorphous shape and time-
dependent morphological changes. The movements of
Olvas–GFP in the nuage and the cytosol were quite
different, suggesting that this protein interacted with a
cellular matrix such as the cytoskeleton or assembled
itself to form larger complexes. When the protein was
expressed in HeLa cells, Olvas–GFP formed distinct
granules that colocalized with Nanos or Tudor. In the
granules, these three proteins exhibit very characteristic
movements, suggesting that the formation of the gran-
ules is not merely an artificial phenomenon, but that it
could be used for investigation of the features of
PGCs.
Results
Time-lapse laser scanning microscopy (LSM)
image analysis of Olvas reveals the dynamic
nature of the nuage
Previous studies showed that the 3¢-UTR of genes for
nuage components was essential for germ cell-specific
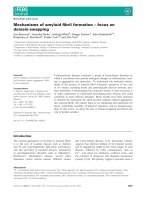
expression of the components [10,11]. Figure 1 shows
a schematic diagram of the Olvas–GFP fusion con-
structs used in this study. RNA transcribed from these
constructs in vitro was injected into medaka eggs in the
one-cell stage to visualize the localization and to mea-
sure the mobility of the components in the PGCs. The
medaka embryo was peeled off the chorion, and the
segment containing the part of PGCs was excised for
observation by microscopy and FCS measurements
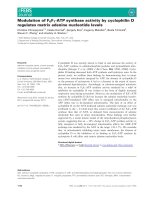
(Fig. 2A). We performed time-lapse 3D LSM analysis
of Olvas–GFP in migrating PGCs. Olvas–GFP was
observed at 0, 1, 2, 3, 4 and 9 min in the migrating
PGCs at stage 24 (Fig. 2B). It was localized as
differently sized granules in the cytoplasm, and the
granules occupied a large volume in the cell, as seen in
the zebrafish [23]. Time-lapse LSM observation
revealed the morphological changes of nuage structure,
such as one granule combining with another and one
dividing into two or more parts (arrowhead in
Fig. 2B).
Olvas–GFP shuttles between the nuage
and cytosol
Next, we analyzed the diffusion of Olvas–GFP in the
PGCs prepared from the embryo, using FCS and
FRAP (Fig. 3). Movement of Olvas–GFP was
Dynamic nature of medaka nuage proteins I. Nagao et al.
342 FEBS Journal 275 (2008) 341–349 ª 2007 The Authors Journal compilation ª 2007 FEBS
measured outside of the nuage in the cytoplasm of the
migrating PGC. FCS analysis revealed that Olvas–
GFP diffused with a diffusion constant of 7.0 lm
2
Æs
)1
(Fig. 3A). During the measurement of the PGC, the
olvas
3'UTR
GFP/RFP 3'UTR
nanos
3'UTR
GFP-3'UTR
GFP/RFP-
olvas
tudor
3'UTR
GFP/RFP
GFP/RFP
GFP/RFP
GFP/RFP-
nanos
GFP/RFP-
tudor
Fig. 1. Schematic diagram of the constructs microinjected into the medaka eggs and transfected into HeLa cells. The olvas, nanos and tudor
coding sequences were joined to the C-terminal region of the GFP or RFP coding sequence in an in-frame manner. These fusion genes were
derived from the T7 promoter and CMV promoter in the case of in vitro transcription and in the case of HeLa cells, respectively.
Glass-bottom plate
Medaka embryo
Lateral plate mesoderm
0 min 1 min 2 min
3 min 4 min 9 min
B
A
Fig. 2. Time-lapse LSM analysis of Olvas–GFP reveals the dynamic
nature of the nuage. Schematic diagram of the preparation of PGCs
of medaka specimen (A). Olvas–GFP was expressed in the medaka
PGC at stage 24 and localized in the nuage. 3D imaging of Olvas–
GFP was performed at the indicated times (B). The nuage was
seen around the nucleus and came together and apart in this time
scale. Arrowheads show the assembly and dissociation points.
0
0.2
0.4
0.6
0.8
1
1.2
0 5 10 15 20
0
0.4
0.8
1.2
1.6
2A
B
1 10 100 1000 10000 100000
Time (s)
Time (µs)
Normalized G(τ)
Relative intensity
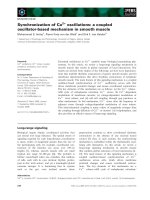
Fig. 3. FCS and FRAP analyses of Olvas–GFP in the PGC. FCS was
used to measure the movement of Olvas–GFP into the cytosol out of
the nuage region of the PGC. Representative correlation curves are
shown (A). The measurement point is indicated by the cross-hair (+)
in the LSM image of Olvas–GFP transiently expressed in PGCs
(inset). The correlation curve of Olvas–GFP (squares) shifted to a
slower part as compared to GFP (diamonds) only. In the cytosol,
Olvas–GFP diffused at D = 7.0 lm
2
Æs
)1
. FRAP analysis was per-
formed in the nuage region (B). The curve is the mean of three inde-
pendent measurements. The bleached position is indicated by the
white circle (inset). FRAP curve analysis shows that Olvas–GFP
moves slowly at D = 0.15 lm
2
Æs
)1
and D = 0.01 lm
2
Æs
)1
.
I. Nagao et al. Dynamic nature of medaka nuage proteins
FEBS Journal 275 (2008) 341–349 ª 2007 The Authors Journal compilation ª 2007 FEBS 343
specimen was alive and moved slowly; the FCS mea-
surement was done in 3 s, which is a short time as
compared to usual FCS measurement. Such a short
period of FCS measurement caused the correlation
curve to be noisy. This diffusion constant was smaller
than that calculated, as the molecules moved com-
pletely free from cellular interactions, such as mono-
mer and ⁄ or oligomer tandem GFP, thought to be a
noninteractive protein in the HeLa cell [24], suggesting
the existence of some interactive cellular partner.
FRAP analysis of the nuage revealed the slow recovery
of Olvas–GFP (Fig. 3B). When the whole part of the
single compartment of nuage was bleached, slow
recovery of the fluorescence was observed, indicating
that Olvas–GFP was provided from the cytosol. The
obtained curve indicated that Olvas–GFP has two dif-
fusion constant components, 0.15 and 0.01 lm
2
Æs
)1
.
These results indicate that Olvas–GFP shuttles between
the nuage and the cytosol.
GFP and red fluorescent protein (RFP) fusion
proteins of Olvas, Nanos and Tudor form
granules in transfected HeLa cells
To investigate the mobility of Olvas–GFP in detail,
we performed in vitro analysis using HeLa cells. A
fusion gene was constructed with the cytomegalovirus
(CMV) promoter and simian virus 40 poly(A) signal.
Surprisingly, Olvas–GFP formed granules in the
cytoplasm (Fig. 4). To verify that these granules were
not merely the simple aggregates often seen in trans-
fected cultured cells, a nanos–RFP or tudor–GFP
fusion gene was cotransfected with the olvas–GFP or
olvas–RFP fusion gene, and diffusion analysis by
FCS and FRAP was performed. As shown in
Fig. 4A, Olvas–GFP and Nanos–RFP colocalized on
the granules in the cytoplasm, and similarly, Olvas–
RFP shared the granules with Tudor–GFP (Fig. 4B).
Next, we carried out FCS and FRAP analyses to
determine the mobility of Olvas–GFP, Nanos–GFP
and Tudor–GFP in HeLa cells (Fig. 5). FCS
measurement revealed that these three proteins dif-
fused with diffusion constants of 11.7, 12.9 and
5.4 lm
2
Æs
)1
, respectively, in the part of the cytoplasm
outside of the granules. FRAP analysis in the gran-
ules provided typical recovery curves of these fusion
proteins: a diffusion constant with two components
of 0.9 and 0.03 lm
2
Æs
)1
in Olvas–GFP, a diffusion
constant of 1.7 lm
2
Æs
)1
in Nanos–GFP, and a diffu-
sion constant of 0.16 lm
2
Æs
)1
in Tudor–GFP. These
results suggest that these granules are not simply
artificial aggregations, but might have some features
of the nuage in the PGC.
Deletion analysis of Olvas–GFP indicates that the
DEAD-box motif might play a role in dynamic
properties
The vasa gene is known to encode a putative RNA
helicase and to have a DEAD-box motif [25]. To
examine the involvement of the DEAD-box motif in
protein mobility, we constructed Olvas–GFP deletion
mutants (Fig. 6A), and transfected these constructs
Olvas-GFP / Nanos-RFP
Merge
A
Tudor-GFP / Olvas-RFP
Mer
g
e
B
Fig. 4. Olvas, Nanos and Tudor fusion proteins expressed in the
HeLa cell form granules. olvas–GFP and nanos–RFP (A), and olvas–
RFP and tudor–GFP (B), were cotransfected into HeLa cells. LSM
images of the HeLa cells are presented. These proteins formed
granules in the cytoplasm. Olvas–GFP and Nanos–RFP, and Olvas–
RFP and Tudor–GFP, are colocalized in the granules.
Dynamic nature of medaka nuage proteins I. Nagao et al.
344 FEBS Journal 275 (2008) 341–349 ª 2007 The Authors Journal compilation ª 2007 FEBS
into HeLa cells. Eight conserved motifs of the olvas
gene [18] are depicted in black boxes in Fig. 6B. The
del1, del2 and del3 mutants lack the two N-terminal
motifs, six N-terminal motifs, and two C-terminal
motifs, respectively. All three deletion series of proteins
were uniformly present in the cytoplasm in large popu-
lations of transfected cells (Fig. 6B, upper panels).
However, in a small number of transfected cells, fluo-
rescent granules were found in the cytoplasm (Fig. 6B,
lower panels). FCS analysis revealed that all deletion
mutants had diffusion constants ranging from 10.5 to
11.3 lm
2
Æs
)1
in the cytosol (Fig. 7A). In contrast,
FRAP analysis revealed that Olvas–GFP deletion pro-
teins were almost all immobilized in the granules
(Fig. 7B), clearly indicating that these granules could
be discriminated from the granules observed in
Fig. 4B. These granules containing Olvas deletion
mutants might have been artificial aggregations, which
are sometimes seen with overexpression in cultured
cells. Once freely moving Olvas deletion molecules
formed such an aggregation, they would be fixed in it,
and not have a functioning shuttle mechanism, like
native Olvas. This result indicates that the domains
including a complete set of DEAD-box motifs are
important in localizing the granules and in dynamic
protein mobility.
Discussion
Herein we report the dynamic nature of Olvas–GFP
expressed in medaka embryos and HeLa cells. Time-
lapse LSM image analysis of the Olvas–GFP distribu-
tion reveals that the shape of the nuage changes in a
matter of minutes in migrating PGCs. Moreover, diffu-
sion analysis reveals that Olvas–GFP remains in the
nuage for seconds, and that Olvas–GFP in the cytosol
diffuses rather freely. Although the nuage has been
analyzed as an important structure for the formation
and maintenance of germ cells [1,2], this is the first
report that rapid protein exchange occurs in the cyto-
sol and nuage in the germ cell. This may imply that
the constituents of the nuage are changed and replaced
during the developmental stages.
We observed that Olvas–GFP expressed in HeLa
cells also formed granules that were similar to nuages
in medaka PGCs. Furthermore, the colocalization of
Nanos–RFP or Tudor–GFP with the Olvas fusion
gene strongly suggests that molecular interaction with
each protein occurred in the granules.
Olvas–GFP shows characteristic movement in both
the nuages of PGCs of medaka embryos and the gran-
ules in HeLa cells. FRAP revealed that it moved with
two diffusion components in both PGCs and HeLa
cells: 0.15 and 0.01 lm
2
Æs
)1
in PGCs, and 0.9 and
0.03 lm
2
Æs
)1
in HeLa cells. The observation of two
components here indicates that more than two compo-
nents or architectures are involved in the formation
of the granules. Such multicomponents have been
observed in the P-body and stress granule [26]. In the
cytosol of both PGCs and HeLa cells, diffusing protein
was observed. The other two components of the nuage,
Nanos and Tudor, exhibit diffusion constants of 1.7
0
0.2
0.4
0.6
0.8
1
1.2
0 10203040
0
0.2
0.4
0.6
0.8
1
1.2
1.4
A
B
1 10 100 1000 10000 100 000
Time (s)
Normalized G(τ)
Relative intensity
Time (µs)
Fig. 5. FCS and FRAP analyses of Olvas–GFP, Nanos–GFP and
Tudor–GFP in HeLa cells. Diffusion of Olvas–GFP, Nanos–GFP and
Tudor–GFP was measured by FCS in the cytosol outside the region
of the granule. Representative correlation curves are shown (A).
Measurement points are indicated by the cross-hair (+) in the LSM
image of Olvas–GFP transiently expressed in a HeLa cell (inset).
These curves for Olvas–GFP (diamonds), Nanos–GFP (squares) and
Tudor–GFP (triangles) exhibit diffusion constants D = 11.7 lm
2
Æs
)1
,
D = 12.9 lm
2
Æs
)1
and D = 5.4 lm
2
Æs
)1
, respectively. FRAP analy-
ses of Olvas–GFP, Nanos–GFP and Tudor–GFP were performed for
the granule (B). Each curve is the mean of 10 independent mea-
surements. The bleached position is indicated by the white circle
(inset). These recovery curves show diffusion constants
D = 0.9 lm
2
Æs
)1
and D = 0.03 lm
2
Æs
)1
for Olvas–GFP (diamonds),
D = 1.7 lm
2
Æs
)1
for Nanos–GFP (squares), and D = 0.16 lm
2
Æs
)1
for Tudor–GFP (triangles).
I. Nagao et al. Dynamic nature of medaka nuage proteins
FEBS Journal 275 (2008) 341–349 ª 2007 The Authors Journal compilation ª 2007 FEBS 345
and 0.16 lm
2
Æs
)1
, respectively, in granules of HeLa
cells when observed using FRAP. In the cytosol of
HeLa cells, diffusing Nanos and Tudor proteins were
also observed by FCS. Their diffusion constants were
12.9 and 5.4 lm
2
Æs
)1
, respectively. FCS and FRAP can
be considered as complementary techniques, as FRAP
can be employed to examine slow processes of replace-
ment of molecules in granules from other parts of the
same granules or from the cytosol. We performed a
bleaching experiment in a whole part of a single com-
partment of the granule, followed by fluorescence
recovery. The fluorescence recovery suggests that the
nonbleached GFP fusion proteins in the granule are
replaced from the cytosol. These results show that
Olvas–GFP, Nanos–GFP and Tudor–GFP shuttle
between the granules and the cytosol, and that
exchange within the granule might also occur; however,
we cannot discriminate between the two possible modes
of recovery, replacement from the cytosol, and replace-
ment through the cytosol from other granules.
Deletion analyses of Olvas–GFP show that all dele-
tion mutants are defective in formation of the
functional granules, indicating that their formation is
dependent on the complete set of the DEAD-box
motifs in olvas. These results indicate that the granules
are not merely artificial aggregates, thought to be the
result of protein misfolding, but might reflect the nat-
ure of the nuage in the PGC.
Recently, there have been some reports that germline-
specified microRNAs are essential in germ cell develop-
ment [27]. Vasa is also thought to interact with Piwi and
Aubergine, which are members of the AGO protein
family [28,29], suggesting that the nuage is implicated in
the Piwi-interacting RNA pathway. It has been shown
that the nuage contains RNAs and proteins that may
have important roles in the development of PGCs [1–3].
It is interesting that rapid exchange of nuage compo-
nents occurred, because such exchange suggests that the
nuage is not only a static storage site, but also a
dynamic RNA- and protein-processing particle. In this
sense, our finding that cultured HeLa cells expressed
Olvas, Nanos and Tudor provides a very attractive
system with which to investigate the features of PGCs.
Although these tests were carried out in HeLa cells
only, they could potentially be applied to other types of
cultured cells.
del1 del2 del3
GFP
Olvas-GFP
GFP
GFP
del1
del2
385
278
6171
del3
GFP
489
1
B
A
Fig. 6. Expression of Olvas deletion series
in HeLa cells. Schematic diagrams of Olvas
deletion series constructs are shown (A).
The numbers of amino acid sequences are
presented above each drawing. These cod-
ing sequences were derived from the CMV
promoter. Eight conserved regions are indi-
cated in black boxes. (B) LSM image of
Olvas deletion series in HeLa cells. The
deletion series constructs were transfected
into HeLa cells, and the LSM images
observed are presented. In some cells,
there are granules that are thought to be
aggregations.
Dynamic nature of medaka nuage proteins I. Nagao et al.
346 FEBS Journal 275 (2008) 341–349 ª 2007 The Authors Journal compilation ª 2007 FEBS
Experimental procedures
Plasmid construction
cDNA cloning by RT-PCR amplification of olvas, nanos
and tudor coding sequences from Oryzias latipes was
described elsewhere [8,10] (Aoki et al., unpublished results).
The coding sequences of olvas, nanos and tudor were
modified by PCR with BglII and EcoRI, using primers
5¢-GGAGATCTAAAATGGACGACTGGGAGGAAGA-3¢
and 5¢-GCGAATTCGTTGAAAACTTTTAATTATCA
GGAGAAAAC-3¢,5¢-CGAGATCTAGCATGTCAGACG
TGGAGTCTGGA-3¢ and 5¢-GCGAATTCGCAACCAAA
GACAACCTGGTTTTAATGTTTTGA-3¢, and 5¢-CGAG
ATCTGAAATGAACGAGCTGCGTATGCCGAA-3¢ and
5¢-GCG AATTCAAC ACAAGAG TTGT TTTATAT TGAA
CCCA-3¢, respectively. The PCR product was digested
and ligated into the multiple cloning site of pEGFP-Cl
(Clontech, Palo Alto, CA, USA) or mRFP [30]. This plas-
mid encoded fluorescent protein and Olvas, Nanos or
Tudor fusion proteins [enhanced GFP (EGFP)–Olvas,
mRFP–Olvas, EGFP–Nanos, mRFP–Nanos, EGFP–
Tudor, and mRFP–Tudor chimera], and was transcribed
from the CMV promoter.
In vitro RNA synthesis and microinjection
The olvas–GFP described above was employed as a
template for PCR, using primers 5¢-GCGCTAGCTAAT
ACGACTCACT ATAG GGA GATC TAAA ATGG AC GAC
TGGGAGGAAGA-3¢ and 5¢-GCGAATTCGTTGAAA
ACTTTTAATTATCAGGAGAAAAC-3¢. This PCR frag-
ment has a T7 promoter for RNA synthesis. Capped RNA
was synthesized by T7 RNA polymerase, using an mMes-
sage mMachine T7 Kit (Ambion, Inc., Austin, TX, USA).
No poly(A) tail was added. Finally, 100 ngÆlL
)1
RNA was
injected into a one-cell embryo.
Cell culture and transfection with plasmid DNA
HeLa cells were grown in a 5% CO
2
humidified atmosphere
at 37 °C in DMEM supplemented with 10% fetal bovine
serum, 2 · 10
5
UÆL
)1
penicillin G, and 200 mgÆL
)1
strepto-
mycin sulfate. Cells were propagated every 1 or 2 days. For
transient expression, cells were plated at a confluence of
10–20% on LAB-TEK chambered coverslips with eight
wells (Nalge Nunc International, Naperville, IL, USA) for
12 h before transfection. DMEM (20 lL) and FuGENE 6
(1.2 lL; Roche Molecular Biochemicals, Mannheim, Ger-
many) were mixed. Five minutes after mixing, 0.4 lg of the
Olvas–GFP, Nanos–GFP and Tudor–GFP or Olvas–RFP,
Nanos–RFP and Tudor–RFP fusion protein-encoding plas-
mid DNAs was added to the prediluted FuGENE 6 solu-
tion. The DNA solution was left for 15 min, and added to
one well 12 h before FCS measurement.
Microscopy
Live-cell fluorescence microscopy was performed using an
LSM510 inverted confocal laser scanning microscope (LSM;
Carl Zeiss, Jena, Germany). EGFP was excited at the 488 nm
laser line of a CW Ar+ laser, and mRFP was excited at the
0
0.5
1
1.5
2
1 10 100 1000 10 000 100 000
0
0.2
0.4
0.6
0.8
1
1.2
B
A
0 10203040
Normalized G(τ)Relative intensity
Time (μs)
Time (s)
Fig. 7. FCS and FRAP analyses of Olvas deletion series in HeLa
cells. Deletion series diffusion was measured by FCS in the cytosol
outside the region of the granule. Representative correlation curves
are shown (A). FCS analysis of Olvas deletion series revealed that
all these proteins diffused in the cytosol at D = 11.3 lm
2
Æs
)1
(del1;
diamonds), D = 10.5 lm
2
Æs
)1
(del2; squares), and D = 10.9 lm
2
Æs
)1
(del3; triangles), respectively. FRAP analyses of Olvas deletion ser-
ies were performed in the granule structure (B). The analyses of
the FRAP recovery curves indicated that most of these proteins
were immobile.
I. Nagao et al. Dynamic nature of medaka nuage proteins
FEBS Journal 275 (2008) 341–349 ª 2007 The Authors Journal compilation ª 2007 FEBS 347
543 nm laser line of a CW He–Ne laser through a water
immersion objective (C-Apochromat, 40·, 1.2 NA; Carl Ze-
iss). Emission signals were detected at > 505 nm for EGFP
and > 560 nm for mRFP by single or sequential scanning.
FCS setup
FCS measurements were carried out with a ConfoCor2
(Carl Zeiss), which consisted of a CW Ar+ laser, a water
immersion objective (C-Apochromat, 40·, 1.2 NA; Carl
Zeiss), and an avalanche photodiode (SPCM-200-PQ;
EG&G, Quebec, Canada). The confocal pinhole diameter
was adjusted to 70 lm. Samples were excited with about
10 kWÆcm
)2
of laser power at 488 nm, and the fluorescence
signal was detected through a dichroic mirror (> 510 nm)
and a bandpass filter (515–560 nm).
FCS measurement and analysis
To remove the chorion, the embryo was peeled with tweezers
and put on LAB-TEK chambered coverslips in 1· Yamam-
oto’s Ringer solution containing 3.5 mm 1-heptanol (3.5 m
stock solution; Wako, Osaka, Japan). Cultured cells were
washed with phenol red-free Opti-MEM I reduced-serum
medium (Invitrogen, Carlsbad, NM, USA) twice to remove
phenol red dye; then the medium was replaced by Opti-
MEM I. Immediately thereafter, FCS measurements were
carried out. The obtained FAF was fitted by a one-compo-
nent, two-component or three-component model (i = 2 or 3
in the following equation) as follows:
G sðÞ¼
ItðÞItþ sðÞ
hi
I
hi
2
¼ 1 þ
1
N
X
i
Fi 1 þ
s
si
À1
1 þ
s
s
2
si
À1=2
where F
i
and s
i
are the fraction and diffusion time of compo-
nent i, respectively, N is the number of fluorescent molecules
in the detection volume element defined by radius w
0
and
length 2z
0
, and s is the structure parameter representing the
ratio, s = z
0
⁄ w
0
. FAFs of rhodamine 6G (Rh6G) solution
were measured for 30 s three times at 10 s intervals; then the
diffusion time (s
Rh6G
) and s were obtained by one-component
fitting of the measured FAFs. Diffusion constants of samples
(D
sample
) were calculated from the ratio with the diffusion
constant of Rh6G, D
Rh6G
(2.8 · 10
)6
cm
2
Æs
)1
), and diffusion
times s
Rh6G
and s
sample
were obtained as the following
equation:
D
sample
D
Rh6G
¼
s
Rh6G
s
sample
FRAP analysis
FRAP measurements were performed on the same setup of
the laser scanning microscope as used for FCS analysis.
The detection gain was adjusted to the fluorescence of the
GFP fusion proteins almost at the saturation level of the
detector, and the pinhole was opened widely enough to
acquire fluorescence from the cell. Ten single scans were
acquired, followed by four bleach pulses without scanning.
Single section images were collected at 0.2 s intervals.
FRAP curves were created using the following equation:
F
t
¼ðT
0
À B
t
Þ=ðT
t
À B
0
Þ
in which F
t
is the normalized fluorescence at time point t,
T
0
and T
t
represent the fluorescence in the whole cell at
time points 0 and t, respectively, and B
0
and B
t
represent
the fluorescence in the bleached region at time points 0 and
t. Diffusion constants were determined by classic FRAP
analysis [20].
Acknowledgements
The authors thank Professor Hiroshi Kimura (Kyoto
University, Japan) for technical advice on the FRAP
experiment. This research was supported by the 21st
Century COE Program for ‘Advanced Life Science on
the Base of Bioscience and Nanotechnology’ in Hok-
kaido University. This research was partly supported
by Grands-in-Aid for Scientific Research (A) 18207010
from JSPS, and Grants-In-Aid for Scientific Research
(Kakenhi) ‘Nuclear Dynamics (17050001)’ by the
Ministry of Education, Culture, Sports, Science and
Technology of Japan (to M. Kinjo).
References
1 Wylie C (2000) Germ cells. Curr Opin Genet Dev 10,
410–413.
2 Ikenishi K (1998) Germ plasm in Caenorhabditis elegans,
Drosophila and Xenopus. Dev Growth Differ 40, 1–10.
3 Lim AK & Kai T (2007) Unique germ-line organelle,
nuage, functions to repress selfish genetic elements in
Drosophila melanogaster. Proc Natl Acad Sci USA 104,
6714–6719.
4 Rongo C & Lehmann R (1996) Regulated synthesis,
transport and assembly of the Drosophila germ plasm.
Trends Genet 12, 102–109.
5 Raz E (2000) The function and regulation of vasa-like
genes in germ-cell development. Genome Biol 1,
doi:1017.1-1017.6.
6 Parisi M & Lin H (2000) Translational repression: a
duet of Nanos and Pumilio. Curr Biol 10, 81–83.
7 Thomson T & Lasko P (2005) Tudor and its domains:
germ cell formation from a Tudor perspective. Cell Res
15, 281–291.
8 Shinomiya A, Tanaka M, Kobayashi T, Nagahama Y
& Hamaguchi S (2000) The vasa-like gene, olvas,
identifies the migration path of primordial germ cells
during embryonic body formation stage in the
Dynamic nature of medaka nuage proteins I. Nagao et al.
348 FEBS Journal 275 (2008) 341–349 ª 2007 The Authors Journal compilation ª 2007 FEBS
medaka, Oryzias latipes. Dev Growth Differ 42, 317–
326.
9 Tanaka M, Kinoshita M, Kobayashi D & Nagahama Y
(2001) Establishment of medaka (Oryzias latipes) trans-
genic lines with the expression of green fluorescent pro-
tein fluorescence exclusively in germ cells: a useful
model to monitor germ cells in a live vertebrate. Proc
Natl Acad Sci USA 98, 2544–2549.
10 Kurokawa H, Aoki Y, Nakamura S, Ebe Y,
Kobayashi D & Tanaka M (2006) Time-lapse analysis
reveals different modes of primordial germ cell migra-
tion in the medaka Oryzias latipes. Dev Growth Differ
48, 209–221.
11 Herpin A, Rohr S, Riedel D, Kluever N, Raz E &
Schartl M (2007) Specification of primordial germ cells
in medaka ( Oryzias latipes). BMC Dev Biol 7,3,
doi:10.1186/1471-213X-7-3.
12 Schwille P, Haupts U, Maiti S & Webb WW (1999)
Molecular dynamics in living cells observed by fluores-
cence correlation spectroscopy with one- and two-
photon excitation. Biophys J 77, 2251–2265.
13 Terada S, Kinjo M & Hirokawa N (2000) Oligomeric
tubulin in large transporting complex is transported via
kinesin in squid giant axons. Cell 103, 141–155.
14 Saito K, Ito E, Takakuwa Y, Tamura M & Kinjo M
(2003) In situ observation of mobility and anchoring
of PKCbI in plasma membrane. FEBS Lett 541,
126–131.
15 Phair RD & Misteli T (2000) High mobility of proteins
in the mammalian cell nucleus. Nature 404, 604–609.
16 Shav-Tal Y, Darzacq X, Shenoy SM, Fusco D, Janick
SM, Spector DL & Singer RH (2004) Dynamics of
single mRNPs in nuclei of living cells. Science 304,
1797–1800.
17 Kitamura A, Kubota H, Pack CG, Matsumoto G,
Hirayama S, Takahashi Y, Kimura H, Kinjo M, Mori-
moto RI & Nagata K (2006) Cytosolic chaperonin
prevents polyglutamine toxicity with altering the aggre-
gation state. Nat Cell Biol 8, 1163–1170.
18 Lippincott-Schwartz J, Snapp E & Kenworthy A (2001)
Studying protein dynamics in living cells. Nat Rev Mol
Cell Biol 2 , 444–456.
19 Phair RD & Misteli T (2001) Kinetic modelling
approaches to in vivo imaging. Nat Rev Mol Cell Biol 2,
898–907.
20 Axelrod D, Koppel DE, Schlessinger J, Elson E &
Webb WW (1976) Mobility measurement by analysis of
fluorescence photobleaching recovery kinetics. Biophys J
16, 1055–1069.
21 Politz JC, Browne ES, Wolf DE & Pederson T (1998)
Intranuclear diffusion and hybridization state of oligo-
nucleotides measured by fluorescence correlation spec-
troscopy in living cells. Proc Natl Acad Sci USA 95,
6043–6048.
22 Wachsmuth M, Weidemann T, Muller G, Hoffmann-
Rohrer UW, Knoch TA, Waldeck W & Langowski J.
(2003) Analyzing intracellular binding and diffusion
with continuous fluorescence photobleaching. Biophys J
84, 3353–3363.
23 Wolke Uta, Weidinger G, Koprunner M & Raz E
(2002) Multiple levels of posttranscriptional control lead
to germ line-specific gene expression in the zebrafish.
Curr Biol 12 , 289–294.
24 Pack C, Saito K, Tamura M & Kinjo M (2006) Micro-
environment: an effect of energy depletion in the
nucleus analyzed by mobility of multiple oligomeric
EGFPs. Biophys J 91, 3921–3936.
25 Sengoku T, Nureki O, Nakamura A, Kobayashi S &
Yokoyama S (2006) Structural basis for RNA unwind-
ing by the DEAD-box protein Drosophila Vasa. Cell
125, 287–300.
26 Anderson P & Kedersha N (2006) RNA granules. J Cell
Biol 172, 803–808.
27 Girard A, Sachidanandam R, Hannon GJ & Carmell
MA (2006) A germline-specific class of small RNAs
binds mammalian Piwi proteins. Nature 442, 199–
202.
28 Megosh HB, Cox DN, Campbell C & Lin H (2006)
The role of PIWI and the miRNA machinery in
Drosophila germline determination. Curr Biol 16,
1884–1894.
29 Findley SD, Tamanaha M, Clegg NJ & Ruohola-Baker
H (2003) Maelstrom,aDrosophila spindle-class gene,
encodes a protein that colocalizes with Vasa and
RDE1 ⁄ AGO1 homolog, Aubergine, in nuage. Develop-
ment 130, 859–871.
30 Campbell RE, Tour O, Palmer AE, Steinbach PA,
Baird GS, Zacharias DA & Tsien RY (2002) A mono-
meric red fluorescent protein. Proc Natl Acad Sci USA
99, 7877–7882.
I. Nagao et al. Dynamic nature of medaka nuage proteins
FEBS Journal 275 (2008) 341–349 ª 2007 The Authors Journal compilation ª 2007 FEBS 349