Tài liệu Báo cáo khoa học: Helix mobility and recognition function of the rat thyroid transcription factor 1 homeodomain – hints from 15N-NMR relaxation studies pdf
Bạn đang xem bản rút gọn của tài liệu. Xem và tải ngay bản đầy đủ của tài liệu tại đây (365.94 KB, 14 trang )
Helix mobility and recognition function of the rat thyroid
transcription factor 1 homeodomain – hints from 15N-NMR
relaxation studies
Devrim Gumral, Luana Nadalin, Alessandra Corazza, Federico Fogolari, Giuseppe Damante,
ă
Paolo Viglino and Gennaro Esposito
`
Dipartimento di Scienze e Tecnologie Biomediche, Universita di Udine, Italy
Keywords
backbone dynamics; model-free approach;
NMR 15N relaxation; spectral density
mapping; thyroid transcription factor 1
homeodomain
Correspondence
G. Esposito, Dipartimento di Scienze e
`
Tecnologie Biomediche, Universita di Udine,
P.le Kolbe, 4, 33100 Udine, Italy
Fax: +39 0432494301
Tel: +39 0432494321
E-mail:
(Received 20 October 2007, revised 25
November 2007, accepted 28 November
2007)
doi:10.1111/j.1742-4658.2007.06208.x
The backbone dynamics of the 15N-labeled homeodomain of the rat thyroid transcription factor 1 has been studied by 2D NMR spectroscopy.
Longitudinal (R1) and transverse (R2) 15N relaxation rate constants and
steady-state {1H}–15N NOEs were measured at 11.7 T. These data were
analyzed by both the model-free formalism and the reduced spectral density mapping (RSDM) approaches. The global rotational correlation time,
sm, of the thyroid transcription factor 1 homeodomain in aqueous solution
at 286 K was found to be 10.51 ± 0.05 ns by model-free formalism and
9.85 ± 1.79 ns by RSDM calculation. The homogeneity of the values of
the overall correlation time calculated from the individual (R2 ⁄ R1) ratios
suggested a good degree of isotropy of the global molecular motion, consistent with the similar global sm results obtained with the two different methods. Tyr25 was found to undergo slow conformational exchange by both
methods, whereas this contribution was identified also for Lys21, Gln22,
Ile38 and His52 only by RSDM. With both methods, the C-terminal fragment of helix III was found to be more flexible than the preceding N-terminal portion, with slightly different limits between rigid and mobile moieties.
Additionally, Arg53 appeared to be characterized by an intermediate
motional freedom between the very flexible N-terminal and C-terminal residues and the structured core of the molecule, suggesting the occurrence of
a hinge point. Finally, slow-time-scale motions observed at the end of
helix I, at the end of helix II and within helix III appear to be consistent
with typical fraying transitions at helical C-termini.
Homeodomains (HDs) comprise a very well-known
class of DNA-binding domains occurring in a large
family of transcription activators involved in the
determination of cell development [1–3]. The tertiary
structure of the HD of rat thyroid transcription factor 1 (TTF-1), a 67-residue domain, was determined
by NMR spectroscopy [4] (Brookhaven Protein Data
Bank ID code 1FTT). The whole TTF-1 protein
(378 residues) is responsible for transcriptional activa-
tion of genes expressed only in follicular thyroid cells
[5] and lung epithelial cells [6]. The structural features of the TTF-1 HD are the typical ones observed
in HDs, i.e. three helices (Gln10–Gln22, Ala28–Ile38,
Thr43–Gln59) connected by a loose loop (Gln23–
Ser27) between helix I and helix II and by a tight
turn (His39–Pro42) between helix II and helix III
(helix–turn–helix motif; Fig. 1). The DNA recognition helix (helix III) is fairly ordered also in the
Abbreviations
Antp, Antennapedia; HD, homeodomain; MD, molecular dynamics; MF, model-free; RSDM, reduced spectral density mapping; TTF-1, thyroid
transcription factor 1.
FEBS Journal 275 (2008) 435–448 ª 2007 The Authors Journal compilation ª 2007 FEBS
435
Backbone dynamics of the rat TTF-1 homeodomain
D. Gumral et al.
ă
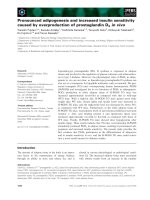
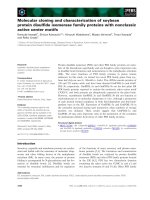
Fig. 1. Cartoon of the TTF-1 HD backbone (Protein Data Bank code
1FTT) [4] with helix I (brown), helix II (magenta), and the DNA recognition helix, helix III (green). The side chains of the residues
whose 15N–1H vectors undergo slow motions, i.e. ls-to-ms (Lys21
and Gln22 in helix I, Tyr25 in the large loop, Ile38 in helix II, and
His52 in helix III), are in blue, whereas, for Leu26, the red color
indicates the coupling of low-frequency and high-frequency dynamics. With the exception of His52, all the mentioned residues are
located in the hydrophobic core of the molecule (i.e. Ile38) or close
to residues of this core (i.e. Lys21 and Gln22, neighboring Phe20;
Tyr25, neighboring Leu26). The drawing was prepared using OpenSource PYMOL (DeLano Scientific LLC, South San Francisco, CA,
USA).
absence of DNA, as first reported for Antennapedia
(Antp) HD [7]. For the TTF-1 HD, a discontinuity
of the hydrogen bond network between N-terminal
and C-terminal moieties of the recognition helix was
observed at the highly conserved fragment Asn51–
His52–Arg53 [4], suggesting the occurrence of either
a kinking or tightening of the local geometry. A
similar discontinuity had been noted in solution also
in the Antp HD [8,9] and the Antp (C39S) HD [10],
and indeed, originally, the C-terminal extension of
helix III, i.e. residues 53–59, was proposed to form
helix IV. However, in the absence of direct evidence
supporting a structural interruption of the geometry
of the recognition helix for either Antp or the TTF-1
HD, the anomalous amide exchange pattern and the
NOE connectivity data of the C-terminal portion of
helix III had to be ascribed to local mobility effects
[4,10]. Subsequently, a quantitative analysis of
1
H–2H exchange rates of the TTF-1 HD revealed
opposite effects to helix III stability within the fragment 51–53 that may be relevant to the conformational dynamics of the HD recognition helix upon
DNA binding [11].
436
In the following, we present a 15N-NMR relaxation
study of the rat TTF-1 HD to address the backbone
dynamics in solution. 15N-NMR as well as 13C-NMR
relaxation studies can be usefully applied to determine
the dynamics of proteins [12,13]. In high magnetic
fields, the relaxation of these nuclei is mainly governed
by dipole–dipole and chemical shift anisotropy mechanisms. For globular proteins, the analysis of the experimental relaxation data by means of the model-free
(MF) approach [14,15] provides a description of the
motions in terms of global overall rotational correlation time, sm, a generalized order parameter, S2, and
an effective internal correlation time, se. For 15N relaxation data, the generalized order parameter reflects the
amplitude of the internal motion of the 15N–1H vectors
in the fast ps-to-ns time range. An alternative method
established to examine 15N–1H vector mobility is based
on the estimation and interpretation of the spectral
density values from the individual relaxation rates
[16–22], an approach most commonly applied in a
restricted version referred to as reduced spectral density mapping (RSDM). This method provides an analysis of protein dynamics that requires no model
assumptions. It gives spectral density values at J(0),
J(xN) and J(<xH>), directly calculated from the
measured relaxation parameters, that contain contributions from the overall as well as the local dynamics.
Graphical analysis of the spectral density values provides a qualitative picture of the internal motions with
no bias, as the whole approach does not make any
assumption about the motions to be investigated.
Results
Relaxation parameters
The individual R1, R2 and NOE values of the backbone amide 15N nuclei of the TTF-1 HD at 286 K are
given in supplementary Table S1, Table S2 and
Fig. S1. Side-chain nitrogens were not considered for
analysis, except for the indole nitrogen of Trp48,
which represents a convenient probe with which to
monitor the dynamics of the HD hydrophobic core
(supplementary Table S1).
The longitudinal relaxation rates range between 1.15
and 1.97 s)1. The lowest R1 values are observed for
Lys24 and Met37 and the residues of the flexible terminal segments, with a characteristic pattern of decreasing values on approaching these latter segments from
the respective adjacent helices. The highest R1 values
are observed for Ser27, Arg31, Glu32, Ser36, Ile38,
Val45, and Trp48. The transverse relaxation rate values, higher than the corresponding R1 constants by
FEBS Journal 275 (2008) 435–448 ª 2007 The Authors Journal compilation ª 2007 FEBS
D. Gumral et al.
ă
one order of magnitude, fall in the range 8.41–
16.53 s)1. The lowest R2 values are shown by the
N-terminal and C-terminal residues and by Leu34,
Gln44, Arg53, Arg58 and Gln59. A unique value of
26.39 s)1, by far the highest one, is observed for
Tyr25, which strongly suggests the presence of a local,
low-frequency conformational exchange contribution.
The steady-state {1H}–15N NOEs span the interval
)1.70 ⁄ +0.89. Negative values are observed for the terminal fragments, i.e. Arg1–Leu7 and Lys61–Gln67,
reflecting the local dynamics characterized by fast
motions. In particular, the sign inversion transitions of
NOEs, seen on approaching the helical tracts from
flexible terminal residues, parallel the similar trends
observed for relaxation rates, and reflect consistently
the changes in local motional properties. In the recognition helix, lower NOE values are obtained for the
C-terminal moiety, confirming that it is more flexible
than the N-terminal one. The highest {1H}–15N NOEs
were measured for Glu17 in helix I, Ser27 and Leu34
in helix II, and Lys46 and Gln50 in the N-terminal
portion of helix III. For an isotropically tumbling
globular molecule, in the absence of internal motions
and with relaxation due to dipole–dipole and chemical
shift anisotropy mechanisms, {1H}–15N NOEs can be
<1,
shown to span values between )3.6, for xNsm <
>1, where sm is the global overand +0.82, for xNsm>
all rotational correlation time [13]. Within the estimated uncertainty, the residues that show a {1H}–15N
NOE higher than the theoretically estimated maximum
are Glu17, Leu34 and Lys46. This is conceivably a
consequence of the overlap affecting the corresponding
resonance. Therefore, the experimental data of these
three residues were not further considered for subsequent MF and RSDM analysis calculations. However,
the qualitative implication of a high {1H}–15N NOE
for Glu17, Leu34 and Lys46, i.e. low specific mobility,
is consistent with the NOE trend of the corresponding
adjacent residues and hence does not conflict with the
global interpretation of the data. With the exclusion of
the N-terminal octapeptidyl and C-terminal nonapeptidyl fragments of Glu17, Leu34 and Lys46, the average
of the {1H}–15N NOEs is 0.68 ± 0.10 (supplementary
Table S2). This value can be reliably considered to be
the average NOE over the structured core of the investigated TTF-1 HD molecule.
Backbone dynamics of the rat TTF-1 homeodomain
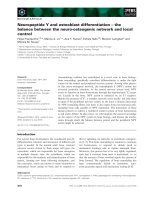
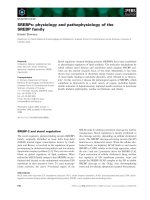
Fig. 2. Bar graphs of overall rotational correlation time, smi (ns),
generalized order parameter, S2 and effective internal correlation
time, se (ps) values as a function of the TTF-1 HD sequence. The
parameters were obtained from measurements at 11.7 T and
286 K. se and S2 values were not calculated for Glu17, Leu34 and
Lys46, as their NOE signals exhibited almost 100% overlap. Additional blank slots in the correspondence of residues 29 and 42 are
for prolines. The se values of Ser27 and Gln50 are not reported,
because they were not optimized by MF analysis. The extension of
TTF-1 HD helical segments is depicted above the graphs.
MF motional parameters
Figure 2 shows the individual overall rotational correlation time, smi, calculated from the individual residue
R2 ⁄ R1 ratios, the generalized order parameters, S2, and
the effective correlation times, se, of the TFF-1 HD
from MF analysis of the 15N relaxation parameters at
11.7 T and 286 K with the corresponding uncertainties
(the actual values are listed in supplementary
Table S3). No other exchanging contributions, Rex, but
FEBS Journal 275 (2008) 435–448 ª 2007 The Authors Journal compilation ª 2007 FEBS
437
Backbone dynamics of the rat TTF-1 homeodomain
D. Gumral et al.
ă
that expected for Tyr25 (14.67 ± 2.35 ns) were found
from MF formalism calculations.
Rotational correlation time
From the estimates of smi based on the individual
relaxation rate ratios (Fig. 2), an average value of
9.7 ± 0.4 ns is extracted for the overall tumbling by
considering only the parameters from the best defined
(and conceivably most rigid) regions of the TTF-1 HD
(Gln10–Gln22, Ala28–Ile38, Thr43–Gln50) as determined from the NMR structure of the molecule [4].
When averaging is extended over the whole smi
dataset, only a slight difference is obtained, i.e.
Ỉsmiỉ = 9.5 ± 0.9 ns. The excellent agreement between
the averages shows that the local segmental mobility
differences, albeit remarkable as inferred from the
NOE data, have little effect on the value of the Ỉsmiỉ
estimate, and adds confidence to the assumption of
isotropic motion adopted by the equation of the relaxation rate ratio [13]. All the individual smi values lie
within 2r from average (95% confidence level), except
for Tyr25, due to the high value of the corresponding
R2 constant, which is affected by a slow exchange contribution. A more accurate estimate of the global sm,
obtained by unbiased grid search optimization over the
experimental parameters and subsequent Brent minimization [23], in the context of MF calculations, gave a
value of 10.51 ± 0.05 ns, i.e. slightly higher but not
far from the value computed from relaxation rate
ratios.
Local generalized order parameters and internal
effective correlation times
Besides the optimization of the molecular tumbling
rate, MF analysis of relaxation data provides a set of
optimized parameters describing local motions. Except
for Tyr25, all the 15N relaxation data of the TTF-1
HD were satisfactorily fitted by means of a dualmotion model entailing a single-frequency local fluctuation superimposed on the global motion. The quality
of the fitting was statistically validated by v2 test
against the corresponding parameter distribution of
Monte Carlo simulations. The individual generalized
order parameters and internal effective correlation
times are plotted in Fig. 2. Their values reflect, respectively, the specific amplitude and the frequency of the
local fluctuations for the motion of each considered internuclear 15N–1H vector. The lowest S2 values and,
correspondingly, the shortest se values are obtained
at the N-terminal and C-terminal fragments 1–7 and
60–67 of the TTF-1 HD. This pattern suggests wide
438
motional freedom of the 15N–1H vectors, which is in
line with the disordered NMR structure observed for
the same regions [4]. The N-terminal flexibility starts
to quench before reaching helix I, at Phe8 and Ser9,
where both parameters of local backbone dynamics
increase. This progressive transition pattern is attributed to the involvement of Ser9 in the N-capping motif
of helix I [4]. The trend of the effective internal correlation time, se (referred to as local correlation time),
along helix I features a behavior that appears typical
within the whole set of MF-based parameters obtained
for the TTF-1 HD, namely an increase of local correlation time with increasing generalized order parameter. This behavior is intriguing when compared to the
established expectation that associates limited local
motional amplitudes, i.e. S2 between 0.8 and 1, with
fast local motions, i.e. small se, and, conversely, wide
local motional amplitude, i.e. S2 < 0.8, with slow local
motion, i.e. large se. In other words, most often for
the TTF-1 HD, S2 and se exhibit an opposite correlation from what is expected. This casts substantial
doubts on the reliability of the picture emerging from
the application of MF formalism to TTF-1 HD relaxation data. In detail, the highest S2 values are obtained
for Gln50 and Tyr54, two residues that are essential
for the DNA recognition specificity of the TTF-1 HD
[24,25]. The restriction in local motion amplitude,
implied by the values of S2, seems consistent with the
role of Gln50 and Tyr54, but the corresponding se values are not easily rationalized. For Gln50, the optimization procedure fails to fit the experimental data with
se £ 11 000 ps. A low frequency of the internal
motions could be considered to match the above-mentioned correlation between high S2 and large se values.
In contrast, for Tyr54 a very low value of the optimized se (296 ± 192 ps) is obtained, which is difficult
to reconcile with the pattern most commonly observed
in the dataset, when S2 is close to 1. The physical
picture for Tyr54 becomes consistent with local fluctuations with remarkably limited amplitude and high frequency. The high level of uncertainty affecting se of
Tyr54 may suggest that the result should be considered
as a numeric artefact of the optimization. However, a
decreasing trend of the internal se coupled with a similar behavior of the generalized order parameter
unequivocally emerges on examination of segment 50–55 of the TTF-1 HD (Fig. 2). Besides Gln50,
optimization fails to retrieve a se £ 11 000 ps also for
the data of Ser27, a residue of the loop between helix I
and helix II. In this case, however, the generalized
order parameter is, within the estimated error, lower
(0.755 ± 0.072) than the average value observed in the
structured molecular core (0.86–0.87). Although the
FEBS Journal 275 (2008) 435–448 ª 2007 The Authors Journal compilation ª 2007 FEBS
D. Gumral et al.
ă
Backbone dynamics of the rat TTF-1 homeodomain
Table 1. Mean values and corresponding standard deviations (in
parentheses) of S2 (dimensionless) and se (ps) parameters for the
secondary structure elements of the TTF-1 HD at 286 K.
Structural unit
ỈS2ỉ
Helix I (10–22)
Helix II (28–38)
Helix III (43–59)
Helix III (43–52)
Helix III (53–59)
Helix III (42–56)
Helix III (51–56)
Loop (23–27)
Tight turn (39–42)
N-terminus (1–9)
C-terminus (60–67)
0.87
0.86
0.85
0.87
0.82
0.87
0.86
0.84
0.92
0.63
0.58
Ỉswa
Ỉs
(0.04)
(0.04)
(0.08)
(0.06)
(0.09)
(0.06)
(0.06)
(0.08)
(0.04)
(0.19)
(0.09)
1983
2493
1486
1885
1030
1630
1345
1038
1960
805
514
(406)
(1374)
(780)
(710)
(613)
(809)
(740)
(542)
(1047)
(752)
(277)
1964
1561
1008
1596
905
1297
1142
468
1403
276
206
(37)
(57)
(19)
(51)
(21)
(37)
(47)
(47)
(106)
(3)
(3)
a
Weighted average calculated using the individual se uncertainties
(ri) as weighting factors (1 ⁄ ri2).
large error in S2 may reflect some problems with the
available data quality, a reduced motional rate for the
Ser27 backbone appears to be plausible, considering its
involvement in the defective capping of helix II [4]. At
this stage, the results are better described by considering the average values observed in the different secondary structure elements as reported in Table 1.
The local dynamics of the three helical regions of
the TTF-1 HD look very similar when only the average generalized order parameters are considered. A
clear difference emerges, however, if the internal correlation times are taken into account. Only the motion
of helix I appears quite uniform, as inferred from the
similar values of the mean and weighed mean se.
Helix II shows the largest variability in local fluctuation frequency, despite the fact that the relative mean
generalized order parameter and the standard deviation are very close to the corresponding counterparts
of helix I. This result can be rationalized on a structural basis. Helix II, in fact, should be the least stable
among the TTF-1 HD helices, because of its incomplete hydrogen bond network, which is due to defective N-capping and distortions introduced by Pro29.
At the same time, the side chains of residues 34, 35
and 38 are tightly anchored in the hydrophobic core of
the molecule, whereas the Glu30 side chain is involved
in a salt bridge [4]. The restricted mobility of four side
chains, out of 10 in helix II, appears to be coupled to
a lower motional frequency of the corresponding
or adjacent backbone amide bond vectors, which
accounts for the inhomogeneity of the local correlation
times. For helix III, the inhomogeneity can be easily
appreciated by inspecting Fig. 2, where the well-known
difference between the N-terminal and C-terminal
moieties of the recognition helix can be seen. If the
MF parameter averages of Table 1 are accordingly
split into average values for segments 43–52 and 53–
59, some internal motion inhomogeneity of helix III is
seen to occur also within the single fragments. The
N-terminal portion exhibits slightly higher <S2> and
standard deviation than helix I and helix II, and a
broad distribution of se, with a weighted average
around 1.5 ns, like helix II. Again as with helix II,
some side chains in this part of the recognition helix
(residues 45, 48 and 49) contribute to the hydrophobic
core of the molecule. Thus, hydrophobic core anchoring has similar results for internal fluctuations in
helix II and the N-terminal moiety of helix III.
Overall, it seems that the whole motional regime of
the TTF-1 HD, in the experimental conditions chosen
for obtaining the relaxation data (286 K), matches
only poorly (and qualitatively) the behavior needed to
comply with the implicit conditions imposed by the
MF approach. In most cases, an increase ⁄ decrease in
the generalized order parameter corresponds to an
increased ⁄ decreased se, which calls for a motional
regime that appears to be inconsistent within the MF
framework. However, all attempts to fit the experimental data with the extended MF approach [26], which
uses a double-timescale model for internal motions,
were also unsuccessful. It is tempting to speculate that
the physically puzzling picture emerging from the MFbased fitting of the majority of the TTF-1 HD relaxation data could be attributed to correlated local
dynamics that occur on a timescale similar to that of
the overall tumbling.
Graphical analysis of spectral densities
Spectral densities at three frequencies [J(0), J(xN) and
J(0.87xH)] were calculated according to the matrix
equation given in supplementary Doc. S1. The individual spectral density values along the sequence of the
TTF-1 HD are displayed in the bar graphs of Fig. 3,
and the corresponding numerical values are given in
supplementary Table S4. Linear correlations between
J(0) and J(xN) and between J(0) and J(0.87xH) for the
`
TTF-1 HD were then examined as proposed by Lefevre et al. [21]. The fit was obtained by linear
regression, and only the corresponding J(0)–J(xN)
correlation plot is shown in Fig. 4.
The localization of the experimental points in Fig. 4
along the correlation line is directly related to the distribution of the energy between the overall tumbling
and the internal mobility, and is indicative of the
degree of internal restraint of each 15N–1H vector
motion. In Fig. 4, most of the points cluster in the
same region. The dashed curve, called the theoretical
FEBS Journal 275 (2008) 435–448 ª 2007 The Authors Journal compilation ª 2007 FEBS
439
Backbone dynamics of the rat TTF-1 homeodomain
D. Gumral et al.
ă
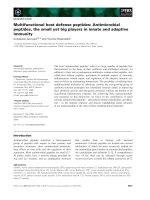
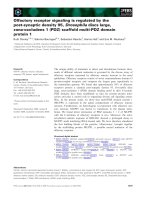
Fig. 3. Bar graphs of spectral density function values (ns) at the
zero, xN and 0.87xH frequencies, versus the sequence of the
TTF-1 HD. Measurements were done at 11.7 T and 286 K. Blank
slots are for residues 29 and 42 (prolines) and Glu17, Leu34 and
Lys46, which were excluded because of the extensive overlap
affecting the corresponding signals. Correlations were calculated by
means of MATHEMATICA 5.2 software, using the relaxation dataset
given in supplementary Table S2. Relaxation data obtained from linear prediction were used for calculation only when the error introduced by the procedure was acceptable, as discussed in
supplementary Doc. S1. The extension of TTF-1 HD helical segments is depicted above the graphs.
curve, indicates the spectral density values expected for
a simple Lorentzian model of J(x) calculated over a
very wide range of correlation times, s. Most of the
440
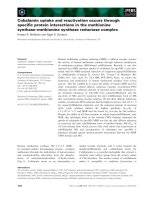
Fig. 4. J(xN)–J(0) correlation for the individual residues of the TTF1 HD from 15N relaxation measurements. Different colors are used
to indicate the distinct groups of residues along the sequence, i.e.
N-terminal (orange), C-terminal (violet), helix I (yellow), helix II
(pink), helix III (green), loop (cyan), tight turn (brown), and residues
that undergo conformational exchange motions (blue). The fit (dark
solid line) was obtained by linear regression with the exclusion of
Arg1 and Gln67 (which exhibit strong negative NOE values) and
Lys21, Gln22, Tyr25, Ile38 and His52 [which make conformational
exchange contributions to J(0)]. The dashed curve (theoretical
curve) was calculated for J(0) and J(xN) as a function of s, using a
simple Lorentzian function. The left-hand inset shows an overview
of the theoretical curve and the fitting line to highlight the two
intercept points. The right-hand inset shows Tyr25 correlation,
which occurs outside the plotted area. Analytically, J(0.87xH)
depends only on the cross-relaxation rate; that is, it is largely determined by the heteronuclear NOE and thus it is most sensitive to
high-frequency motions of the protein backbone. On the other
hand, the value of J(xN) is extracted also from R1, whereas J(0) is
determined also by both R1 and R2. Therefore, J(0) is sensitive to
both nanosecond timescale motions and contributions from ls-toms slow exchange processes. For this reason, the main information on dynamics can be derived from analysis of J(0). A plot of the
correlation J(0.87xH)–J(0) is given in supplementary Fig. S2.
experimental points accumulate rather close to the
upper intercept of the theoretical curve and the fitting
(solid) line, where the motion of a unique 15N–1H vector is defined by a single Lorentzian function with a
global overall rotational correlation time, sm. The
points from N-terminal and C-terminal residues
(Arg1–Leu7 and Ala60–Gln67), together with those
from Arg58 and Gln59 in the C-terminal end of
helix III, are located apart from the major cluster,
towards the lower intercept of the theoretical curve
and fitting line (Fig. 4, left inset), where the motion of
FEBS Journal 275 (2008) 435–448 ª 2007 The Authors Journal compilation ª 2007 FEBS
D. Gumral et al.
ă
a unique 15N1H vector is dened by a single Lorentzian function with a fast s that is interpreted as generalized internal correlation time, sgi. For any point
between the upper and lower intercepts of the theoretical curve with the fitting line, the spectral density function can be expressed as a linear combination of the
two Lorentzian functions defined by sm and sgi, respectively. The proximity to one of the intercepts between
the theoretical and fitting curves reflects the relative
contribution of each component Lorentzian function
to the specific spectral density of each experimental
point. Therefore, according to the RSDM analysis
[21], most of the 15N–1H vectors of the TTF-1 HD
core move at the rate of the overall rotational correlation frequency, and relaxation mainly occurs as a
result of overall rotational diffusion. Among all the
TTF-1 HD backbone 15N–1H vectors, those from disordered N-terminal and C-terminal residues, together
with Arg58 and Gln59, are the most mobile ones and
exhibit fast-timescale (ps-to-ns) motion.
In Fig. 4, the points corresponding to residues
Lys21, Gln22, Tyr25, Ile38 and His52 are shifted to
the right above the theoretical line, which is a typical pattern for the occurrence of a slow (ls-to-ms)
exchange process. The data relative to Lys24 and
Met37, together with those of several terminal residues (Arg1, Arg2, Ala64, Gln66 and Gln67), fall
outside the major cluster of points and feature a distinct dynamic behavior as compared to the remaining 15N–1H vectors of the core. Their spectral
density functions cannot be expressed with only two
Lorentzian functions.
In the tightening ⁄ kink of the recognition helix
introduced by the Asn51–His52–Arg53 tripeptide,
His52 and Arg53 show rather different dynamic
behaviors. Arg53 appears to possess an intermediate
motional freedom between those of the N-terminal
and C-terminal residues and the core; that is, it
undergoes ps-to-ns timescale motion. On the other
hand, His52 shows slow conformational exchange
contributions in the ls-to-ms timescale, as mentioned
above. A similar situation is observed for the pairs
Glu30–Arg31 and Gln44–Val45, with the first residues
exibiting faster motions (ps-to-ns timescale), and the
latter residues slower motions on the nanosecond
timescale.
Detailed analysis of the spectral density functions
can be performed using the bar charts of Fig. 3 to
obtain the individual dynamic properties of each
15
N–1H vector. It can be seen that the 15N–1H vectors
of the N-terminal and C-terminal residues undergo the
most rapid motions as compared to the rest of the
TTF-1 HD backbone. This is highlighted by low J(0)
Backbone dynamics of the rat TTF-1 homeodomain
and J(xN) values and correspondingly high J(0.87xH)
values, a pattern that is typically expected when the
considered internuclear vectors reorient on a fast (psto-ns) timescale.
In the loop between helix I and helix II, Tyr25
shows a J(0) value that is much higher than that of
any other 15N–1H vector of the backbone. This pattern
suggests that a slow exchange process in the ls-to-ms
range occurs at Tyr25, because such processes increase
the value of the spectral density function in the lowfrequency range, i.e. from zero to a few kilohertz, but
have no influence at high frequencies, i.e. in the megahertz range. On the other hand, the significant
J(0.87xH) value of Tyr25 indicates mobility. Within
the residue group with increased J(0), however,
Tyr25 N–H and, to a lesser extent, His52 N–H appear
to undergo some additional fast motions, as shown by
higher J(0.87xH) values.
In general, flexibility is observed at the loop residues, but not in the tight turn. For helix I and helix II,
J(0) values show a quite regular distribution along the
sequence if residues undergoing exchange are excluded
(Fig. 3). J(xN) and J(0.87xH) values are fairly constant
along helix I [except for the higher value of J(0.87xH)
for Leu16] and are more dispersed along helix II. For
the latter, this indicates segmental mobility being
adopted with a less defined secondary sturucture, probably resulting from the lack of a complete hydrogen
bond network [4]. The dynamics of helix III can be
divided into two different regions, with a border occuring at His52–Arg53 for all spectral density values. The
C-terminal segment of helix III (Arg53–Gln59) has
lower J(0) values than the adjacent N-terminal moiety
and the whole core of the TTF-1 HD, reflecting mobility related to poorly defined secondary structure [4].
Conversely, at the N-terminal segment of helix III,
higher J(0) values are inferred from analysis, consistent
with the better defined and more stable secondary
structure.
Overall, apart from the singularity at His52 that
results from an exchange contribution due to slow aromatic ring motion, as previously described, J(0) values
are seen to vary along helix III with some regularity
within the two identified moieties, i.e. a slight decrease
along segment 47–53, followed by a slight increase
in segment 53–55. The J(0) minimum is reached at
Arg53, where the low-frequency motion profile shows
similar characteristics as found at Arg58 for Gln59,
the frayed extremity of the recognition helix. The pattern described for J(0) is observed also for J(xN) along
helix III, again with a minimum at Arg53. In a quite
complementary fashion, J(0.87xH) reaches a maximum
at Arg53, with a subsequent abrupt decrease at Tyr54
FEBS Journal 275 (2008) 435–448 ª 2007 The Authors Journal compilation ª 2007 FEBS
441
Backbone dynamics of the rat TTF-1 homeodomain
D. Gumral et al.
ă
[in correspondence with the increases in J(0) and
J(xN)] and then a progressive increase on moving
towards the end of the recognition helix. The whole
picture outlines the peculiar dynamic profile of a hinge
point at Arg53 that exhibits conspicuous minima
of J(0) and J(xN) and a significant maximum of
J(0.87xH), and that emerges not only within helix III,
but also over a large portion of the protein, from Phe8
to Met56, including the loop and the tight turn. At the
same time, in the vicinity of the Arg53 hinge point,
precisely at Glu50, a minimum of J(0.87xH) occurs,
along with correspondingly high values of J(0) and
J(xN), an indication of slow local motion consistent
with the presence of a hydrogen bond network that
restricts the excursion of the Glu50 backbone. Other
relevant details of the spectral density analysis are seen
for Lys24 and Met37 amides, where increased values
of J(0) are coupled to low J(xN) values. Although
significantly low values of J(xN) are considered to be
evidence for fast motions, the corresponding J(0.87xH)
of the same residues rather suggests more complex
dynamics, i.e. other than the dual low-frequency and
high-frequency motional regime that appears to govern
local dynamics elsewhere, e.g. Leu26.
Table 2 lists the mean J(x) values together with
the corresponding standard deviations for the different secondary structure elements of the TTF-1 HD.
It is readily seen that the 15N–1H vectors of helix I,
helix II and the N-terminal segment of helix III do
not show major differences in the J(x) values. Conversely, the C-terminal fragment of helix III has
lower mean values for both J(0) and J(xN), and a
significantly higher mean value for J(0.87xH), which
further stresses the different dynamic behaviors of
the N-terminal and C-terminal segments of the recognition helix.
Table 2. Mean spectral density values (ns) and corresponding
standard deviations (in parentheses) for the secondary structure
elements of the TTF-1 HD at 286 K.
Structural unit
J(0)
Helix I (10–22)
Helix II (28–38)
Helix III (43–59)
Helix III (43–52)
Helix III (53–59)
Loop (23–27)
Tight turn (39–42)
N-terminus (1–9)
C-terminus (60–67)
3.78
3.84
3.63
3.83
3.38
3.79
3.69
2.83
2.62
a
J(xN)
(0.30)
(0.37)
(0.34)
(0.26)
(0.25)
(0.12)a
(0.11)
(0.52)
(0.30)
0.354
0.355
0.343
0.354
0.329
0.340
0.342
0.271
0.262
J(0.87xH)
(0.008)
(0.029)
(0.020)
(0.017)
(0.014)
(0.024)
(0.010)
(0.065)
(0.052)
0.008
0.008
0.011
0.008
0.014
0.010
0.008
0.027
0.030
(0.001)
(0.001)
(0.005)
(0.002)
(0.006)
(0.003)
(0.001)
(0.013)
(0.006)
Tyr25 was excluded to avoid a significant bias on the average
from the slow exchange contribution (see text).
442
Global overall and generalized internal
correlation times
The roots of the third-order polynomial proposed by
`
Lefevre [21] were calculated for both linear correlations of J(xN) and J(0.87xH) versus J(0) (see supplementary Fig. S2) to evaluate sm and sgi. From J(xN)–
J(0) correlation, only two physically meaningful
solutions were obtained, i.e. sm = 9.85 ± 1.79 ns and
J(0.87xH)–J(0)
correlation
sgi = 0.28 ± 0.11 ns.
yielded three roots, one for sm (9.84 ± 0.20 ns) and
two for sgi (0.26 ± 0.03 ns and 0.55 ± 0.06 ns) (supplementary Doc. S1 and Fig. S2).
Comparison of results from MF and RSDM
The results for sm obtained by the MF and RSDM
approaches are in fairly good agreement, especially if
the comparison is drawn using the average value estimated from R2 ⁄ R1 ratios. Therefore, the assumption of
isotropic overall rotational diffusion for the TTF-1
HD proves to be convincingly appropriate.
The generalized order parameter values obtained
from the MF approach are consistent with the results
of RSDM. Lower generalized order parameters are
obtained for N-terminal and C-terminal residues, for
the loop, and partially for helix III, pointing to largeamplitude motions. Higher generalized order parameters are obtained for the structured regions as well as
the tight turn, indicating restricted mobility, in agreement with the RSDM results. Most of the effective
internal correlation times obtained by the MF
approach appear to be unreliable within the framework
of the theory. This could arise from the very wellknown limitations of MF formalism for the case of
internal motions occurring on a timescale similar to
that of the overall tumbling [27]. In this case, such slow
motions would superimpose faster internal motions,
leading to a situation that would not match the regime
supporting the assumption of MF formalism. This is
also assumed to be the reason why we were not able to
fit our data using an extended MF formalism [26,27].
Although anomalously high se values were often
obtained, it is worth noting that MF calculations gave
high S2 and correspondingly relatively low se values for
Lys24, Glu30, Gln44 and Tyr54, indicative of restricted
amplitude and fast-timescale motions that are consistent with the corresponding results from RSDM. Also,
the relatively decreased S2 and the corresponding relatively low se values (sub-nanoseconds) for Arg53,
Arg58 and Gln59 suggest less restrictive and faster local
motions that are consistent with the reduced spectral
density results. In the ls-to-ms timescale, only Tyr25
FEBS Journal 275 (2008) 435–448 ª 2007 The Authors Journal compilation ª 2007 FEBS
D. Gumral et al.
ă
was found to have exchange contributions using MF
analysis, whereas by RSDM, Lys21, Gln22, Ile38 and
His52 were also identified.
Molecular dynamics (MD) simulation results
Snapshots were taken at 500 ps intervals in order to
obtain a statistical ensemble for the system studied.
The overall flexibility of the molecule was assessed by
the average rmsd of the backbone atoms when the core
region spanning residues Gln10–Arg58 was superimposed between all snapshot pairs. From this analysis,
the conformational freedom of the N-terminal and
C-terminal regions was apparent, with average rmsd
˚
values up to 10 A. The average rmsd values for the
rest of the molecule spanning residues Gln10–Arg58
˚
were mostly < 1.0 A. The analysis of the correlation
function of the N–H vectors was more informative,
although less straightforward. The short simulation
time precludes a direct spectral density analysis. In
order to highlight local motions, the global rotational
motion of the molecule must first be assessed. This
was done by superimposing the core of all snapshots,
taken at 100 ps intervals, on the snapshot with the
smaller average rmsd. The correlation function C(i,m)
was defined as the average of the position vector scalar
r
product ~NH tị ~NH t ỵ mDtị over the trajectory for
r
residue i. The root mean square of the quantity
[1 ) C(i,m)] was thus indicative of the deviation of the
vector N–H of residue i from the global behaviour.
This procedure is solely motivated by the inadequate
time sampling provided by a 10 ns MD simulation.
The largest deviations from global behavior are
observed at the N-terminus and C-terminus, with a
transition from disordered to more ordered vectors
between Phe8 and Ser9, and between Gln59 and
Arg58. Interestingly, this analysis highlights local
motions at Gln10–Val13, Gln22–Ser27 and Met37–
Leu40 and in the second part of helix III. As could be
expected, the analysis does not reproduce exactly the
experimental findings, but it is consistent with them
overall. In particular, the long loop involving Gln22–
Ser27 appears to be rather unconstrained, resulting in
large conformational motions in its central part. Similarly, the second part of helix III appears to be less
restrained than the first part, starting from Tyr54.
Arg53 appears to be more mobile than the preceding
residues, but less free than the second part of the helix.
The pattern of hydrogen bonds is consistent with
a regular a-helix throughout the simulation only for
the first part of helix III. Starting from Tyr54, the
hydrogen bond with residue i-4 is not well conserved,
and for Arg53 and Tyr54, hydrogen bonds with resi-
Backbone dynamics of the rat TTF-1 homeodomain
due i-3 are also observed, in good agreement with the
helix tightening suggested by NMR.
Thus, the picture emerging from MD simulation is
not as detailed as that provided by relaxation analysis,
but it is consistent overall with the local motions
observed by MF and ⁄ or RSDM analysis and with previous NMR structural findings.
Discussion
The detailed description of the results obtained by the
MF and RSDM approaches has highlighted a crucial
limitation of the MF treatment. When the motions of
a protein in isotropic solution do not match the regime
of slow overall tumbling (nanoseconds) and fast local
fluctuations (at most, hundreds of picoseconds), the
MF-based fitting of the NMR relaxation data fails to
retrieve a correct description of the dynamics. As previously pointed out [27], there may be three major patterns of deviation from the basic MF assumption that
can be hardly recognized when NMR relaxation is
measured with a single magnetic field. MF-based
fitting does not apply properly when: (a) the overall
rotation is anisotropic; (b) collective motions with correlation time longer than 1.5–2.0 ns are present; and
(c) uniform conformational exchange occurs that may
be masked by an overestimated sm. For the experimental data of the TTF-1 HD presented here, it was concluded that only the two latter causes of deviation may
contribute to the erroneous estimates obtained from
MF analysis, although the possible uniform conformational exchange does not involve the whole molecule,
but rather specific regions. We could infer this conclusion from the simultaneous analysis of the data
obtained using the RSDM approach. The fitting
obtained from the correlation plots among the different spectral densities ensures that the assumption of
isotropic overall tumbling is correct within the experimental error. This is consistent with previous evidence
obtained for the vnd ⁄ NK-2 HD [28], which is very closely related to the TTF-1 HD, as well as with explicit
anisotropy calculations that rule out anisotropic
motion (supplementary Doc. S1). The increase in the
refined overall correlation time with respect to the
average value obtained from relaxation rate ratios of
single residues, within the MF context, most likely
arose from inclusion in the dataset of the relaxation
rates with slow exchange contributions (namely those
from Lys21, Gln22, Ile38, and His52). The ensuing
overestimated sm, in turn, obscured the detection of
exchange contributions other than those of Tyr25
(which, in fact, was excluded from the dataset for
refined sm calculation). Also, the sm value of
FEBS Journal 275 (2008) 435–448 ª 2007 The Authors Journal compilation ª 2007 FEBS
443
Backbone dynamics of the rat TTF-1 homeodomain
D. Gumral et al.
ă
9.85 ± 1.79 ns obtained from RSDM appears to be
too large for a 68-residue polypeptide, and suggests
the possibility of dimerization or higher-level association. An estimate of the expected sm for a compact,
globular protein, of the same molecular mass as the
domain addressed here, gives values within 6.6 and
7.6 ns [29]. Although aggregation into a stable dimer
cannot be ruled out, in spite of the absence of structural evidence [4,11], the occurrence of association
equilibria also cannot be excluded a priori, although
the strong net charge of the molecule (+15) should
prevent significant association. Addressing this issue
adequately, however, is beyond the scope of the current work, and should be done in detail elsewhere.
Besides the difficulty of demonstrating that the formation of a stable dimer or a labile, transient oligomer is
capable of substantially affecting the internal dynamics
of the monomers, so as to reject totally the conclusions
of this study, it is worth considering the actual molecular dimensions to account for the large sm value. In
addition to the details that are discussed in supplementary Doc. S1, one could mention that, as some 20 residues of the TTF-1 HD appear to be statistically
disordered, the increment of the average hydrodynamic
radius is well beyond 0.05 nm, which is expected to
increase by 10% the overall sm [30]. In fact, the
Stokes–Einstein relationship gives a hydrodynamic
radius of 1.98 nm for the TTF-1 HD under the conditions of this study, i.e. very close to the mean radius of
the NMR structure of the molecule (1.94 nm) [4]. The
conclusions inferred here may be much more intriguingly challenged if one wonders whether the dynamic
properties of an isolated HD at 286 K can be extended
to the whole TTF-1 molecule under physiological conditions. The temperature increase at 310 K and the
molecular size of the entire transcription factor should
lead to an overall tumbling rate of 20–22 ns)1. Besides
noting that the selected experimental conditions for
characterizing the dynamics of the TTF-1 HD are not
completely unrelated to the dynamic regime within the
whole protein, it is clear that the local mobility trends
that may influence HD function should still apply, and
may possibly be elicited, under physiological conditions.
The most serious problem in MF interpretation of
the TTF-1 HD data can be considered to be the coupling of restricted amplitudes and slow rates and, conversely, large amplitudes and faster rates, for the
internal motions along most of the structured core of
the molecule. This picture is physically inconsistent,
and follows from the failure to account for collective
motions with correlation times > 1.5–2.0 ns [27]. The
possibility that the inconsistency is due to reliability
444
problems with measurements at a single field rather
than inherent limits of the MF framework is in contrast to the results of interpretation of the same data
obtained using the RSDM approach.
Despite the limitations, even with MF analysis,
peculiar local fluctuation states were recognized at
Lys24, Glu30, Gln44 and Tyr54, in agreement with the
corresponding spectral density mapping interpretation.
In particular, it is instructive to consider the MF
results obtained for Glu30. The arrangement of the
helix II N-capping [4] seems to be paralleled by an
increase in S2 and a decrease in se for Glu30 and, conversely, a decrease in S2 and an increase in se for the
Arg31 15N–1H vector. Thus, the result for individual
se > smi obtained for Ser27, which is involved in
N-capping with Arg31 N–H and Glu30 N–H is, at least
qualitatively, justified, and suggests an interpretation
based on the compensation between the amplitude and
frequency of local fluctuations. In other words, a wider
motion amplitude is accompanied by a slower motion
rate because of the increased mechanical inertia.
In the context of RSDM, the detailed analysis of the
three spectral densities J(0), J(xN) and J(0.87xH)
allowed us to obtain a rather complete description of
the dynamics of the TTF-1 HD over a large range of
timescales. The current observations are in agreement
with our previously published structural characterization of the TTF-1 HD [4]. As we concluded before, the
C-terminal segment of helix III, which is involved in
the DNA recognition process, displays higher mobility
than the preceding moiety, and Arg53 within the recognition helix appears to be a hinge point. Additionally, slow conformational exchange contributions were
observed for the His52 backbone, in a ls-to-ms timescale. The high J(0) and J(xN) values obtained for the
N-terminal moiety of helix III further stress its stability. Within this first stretch of the recognition helix,
Gln50 has a pivotal function. High values of J(0) and
J(xN) with a corresponding very low J(0.87xH) for the
amide vector dynamics of this residue indicate local
motions occurring essentially over the nanosecond
timescale. The lack of fast internal motions reflects the
crucial role of Gln50, which behaves as mechanical
point of support, needed for the hinging of the C-terminal part of helix III. This relative rigidity of residue 50 is also relevant to biological function, and has
been long recognized as one of the DNA recognition
determinants of HD motifs [1,2].
Slow motion contributions are seen to occur for
Ile38 in the hydrophobic core or for residues close to
this core (i.e. Lys21 and Gln22, neighboring Phe20;
Tyr25, neighboring Leu26), as well as for His52
(Fig. 1), because of slow conformational exchange of
FEBS Journal 275 (2008) 435–448 ª 2007 The Authors Journal compilation ª 2007 FEBS
D. Gumral et al.
ă
an aromatic side chain from the same or a nearby residue. Slow motion of aromatic side chains creates local
field gradients at the neighboring residues, which may
provide very efficient relaxation pathways, because of
the well-known effects of ring currents on chemical
shifts. These contributions could be recognized as the
collective slow motions that appear to occur along the
helical backbone, as inferred from MF analysis failure.
The process seems particularly effective at the C-end
of the helices, and could be regarded as helix–coil transition on a slow timescale [29]. For the recognition
helix, this behavior appears to correspond with the
kink at Asn51–His52–Arg53; residues 51 and 53 are
nearly invariant in all eukaryotic HDs, i.e. are an early
feature in HD evolution, and thus could represent a
conserved determinant for the local dynamics [11]. The
resulting abrupt change of the recognition helix register introduced by the 51–53 kink, as confirmed by
NMR evidence [4,11], should affect the amide bond
vector dynamics of Tyr54, an important recognition
determinant for the NK-2 HD subfamily [31], within
the flexible joint between the N-terminal and C-terminal moieties of the recognition helix. The implication
for DNA binding that may be envisaged from the
available conformational options within the recognition helix [2–4,7–9] is that the latter helix, firmly oriented within the helix–turn–helix motif, may undergo a
transition, approximately in the middle of its extension, that alternates the local conformation between
two limiting geometries involving either an extension
or a break of the recognition helix. This picture, first
inferred for the TTF-1 HD from structural determination [4], proved consistent with the opposite stabilization pattern observed within the Asn51–His52–Arg53
segment through 1H–2H exchange measurements [11].
The present relaxation study confirms our early interpretation [4] and provides support for our previous
proposal. The link between the nearly absolute invariance of Asn51 and Arg53 and the conformational
dynamics of the recognition helix suggests that a double-bind is universally present in eukaryotic HDs, i.e.
an invariant termination signal for the first part of the
recognition helix, and a likewise invariant resumption
signal for the second part of the same helix at Asn51
and Arg53, respectively. In behavioral science, doublebind designates two messages with conflicting meanings that are simultaneously submitted through two
different communication channels. The alternative
arrangements and the conformational dynamics
thereof are fully consistent with the hinging at Arg53
and can provide an important contribution to DNA
recognition and binding. These local collective transitions elicited at low temperature should still emerge
Backbone dynamics of the rat TTF-1 homeodomain
under physiological conditions, when the HD is part
of a much larger transcription factor, and determine
the extent of the conformational changes and, hence,
the energetics of the interaction with DNA
[2,3,8,11,32].
Experimental procedures
Sample preparation
Uniformly 15N-labeled (U-15N) TTF-1 HD (68 residues
including the segment 160–226 of the whole rat thyroid
transcription factor, plus an extra methionyl residue at the
N-terminus, numbered Met0) was obtained from overexpression in Escherichia coli strain BL21, by growth in a
minimal medium containing 15NH4Cl as a source of nitrogen. Expression and subsequent purification were performed as described previously [5,33]. NMR samples were
prepared by dissolving the lyophilized powder in H2O ⁄ D2O
(95 : 5, v ⁄ v) and adjusting the pH (uncorrected pHmeter
reading) to 4.3 by microadditions of 1 m HCl. The labeled
protein concentration was about 0.8 mm.
NMR measurements
The 2D NMR spectra were recorded at 286 ± 0.5 K and
at 11.7 T on a Bruker (Karlsruhe, Germany) Avance500
spectrometer, operating at 500.13 MHz and 50.68 MHz for
1
H and 15N, respectively. The longitudinal (R1) and transverse (R2) 15N relaxation rate constants and steady-state
{1H}–15N NOEs were measured from proton detection
1
H–15N correlation spectra, according to schemes reported
by Stone et al. [34]. All relevant chemical shift and
relaxation rate data were deposited at BMRB (accession
number 15521). Additional details can be found in supplementary Doc. S1.
15
N relaxation data analysis
The longitudinal and transverse rate constants were calculated from peak heights of the 1H–15N correlation data series. Under the typical conditions employed for protein
NMR relaxation studies, peak heights have been proven to
be more accurate than the corresponding volumes [35]. To
determine the R1 and R2 values, a three-parameter and
two-parameter, respectively, nonlinear least-square t of the
equations
I sị ẳ I1 I1 I0 Þ expðÀR1 sÞ
ð1Þ
I ðsÞ ¼ I0 expðÀR2 sÞ
ð2Þ
and
were applied, where s is the experimental relaxation delay,
and I0 and I¥ are the initial and final steady-state intensities
FEBS Journal 275 (2008) 435–448 ª 2007 The Authors Journal compilation ª 2007 FEBS
445
Backbone dynamics of the rat TTF-1 homeodomain
D. Gumral et al.
ă
[35]. Curve fitting was performed by means of the
Marquardt–Levenburg algorithm implemented in the
axum 5.0 package (MathSoft Inc., Cambridge, MA, USA)
based on v2 optimization [35]. The steady-state {1H}–15N
NOE values were calculated from the height ratio of the
peaks of 2D correlation spectra obtained with and without
proton saturation, whereas the cross-relaxation rates, RNOE,
were calculated according to the equation
RNOE ẳ NOE 1ị
cN
R1
cH
3ị
The details concerning the relaxation data analysis performed with the MF approach [14,15] and the RSDM
approach [18–22] are given in supplementary Doc. S1.
Error estimations
In order to establish the errors on individual peak height
values, the reproducibility of the experimental R1 and R2
data was assessed by measurement duplication over a series
of arbitrarily selected relaxation delays (at least three;
see supplementary Doc. S1). The average uncertainties
obtained for R1 constants were 1.4% for resolved resonances and 1.0% for partially overlapping ones, whereas
the corresponding quantities for R2 were 14% and 17%.
This difference reflects the inherent accuracy limit diversity
of R1 and R2 estimations for a dilute sample at low temperature. Analogously to the relaxation rates, the NOE data
errors were also estimated by duplicated measurements and
were analyzed only for a number of selected (resolved) resonances. The estimation of the uncertainties affecting the
dynamics parameters sm, S2, se and Rex was provided by
covariance matrix analysis of the optimized model carried
out by modelfree 4.1 software [23,35] and validated by
comparison with the Monte Carlo simulation results
obtained with the same package. The uncertainties in spectral density functions were calculated according to standard
error propagation equations using mathematica 5.2 software.
MD simulations
MD simulations were performed starting from the deposited NMR structures (Protein Data Bank code: 1FTT),
using the CHARMM forcefield [36]. Overall, a 10 ns trajectory was simulated. All the details are reported in supplementary Doc. S1.
Acknowledgements
This work was financially supported by AIRC, MIUR
(2006058958, RBNE03PX83) and EU (LSHM-CT2005-037525). The suggestions of Dr A. Makek are
acknowledged.
446
References
1 Gehring WJ (1987) Homeo boxes in the study of development. Science 236, 1245–1252.
2 Pabo CO & Sauer RT (1992) Transcription factors:
structural families and principles of DNA recognition.
Annu Rev Biochem 61, 1053–1095.
3 Gehring WJ, Qian YQ, Billeter M, Furukubo-Tokunaga K, Schier AF, Resendez-Perez D, Affolter M, Otting
G & Wuthrich K (1994) HomeodomainDNA recogniă
tion. Cell 78, 211223.
4 Esposito G, Fogolari F, Damante G, Formisano S, Tell
G, Leonardi A, Di Lauro R & Viglino P (1996) Analysis of the solution structure of the homeodomain of rat
thyroid transcription factor 1 by 1H-NMR spectroscopy
and restrained molecular mechanics. Eur J Biochem
241, 101–113.
5 Guazzi S, Price M, De Felice M, Damante G, Mattei
MG & Di Lauro R (1990) Thyroid nuclear factor 1
(TTF-1) contains a homeodomain and displays a novel
DNA binding specificity. EMBO J 9, 3631–3639.
6 Bohinski RJ, Di Lauro R & Whitsett JA (1994) The
lung-specific surfactant protein B gene promoter is a
target for thyroid transcription factor 1 and hepatocyte
nuclear factor 3, indicating common factors for organspecific gene expression along the foregut axis. Mol Cell
Biol 14, 5671–5681.
7 Otting G, Qian YQ, Billeter M, Muller M, Affolter M,
ă
Gehring WJ & Wuthrich K (1988) Secondary structure
ă
determination for the Antennapedia homeodomain by
nuclear magnetic resonance and evidence for a helix–
turn–helix motif. EMBO J 7, 4305–4309.
8 Qian YQ, Billeter M, Otting G, Muller M, Gehring WJ
ă
& Wuthrich K (1989) The structure of the Antennapedia
ă
homeodomain determined by NMR spectroscopy in
solution: comparison with prokaryotic repressors. Cell
59, 573–580.
9 Billeter M, Qian YQ, Otting G, Muller M, Gehring WJ
ă
& Wuthrich K (1990) Determination of the threeă
dimensional structure of the Antennapedia homeodomain from Drosophila in solution by 1H nuclear magnetic resonance spectroscopy. J Mol Biol 214, 183–197.
10 Guntert P, Qian YQ, Otting G, Muller M, Gehring W
ă
ă
& Wuthrich K (1991) Structure determination of the
ă
Antp (C39-S) homeodomain from nuclear magnetic
resonance data in solution using a novel strategy for the
structure calculation with the programs DIANA, CALIBA, HABAS and GLOMSA. J Mol Biol 217, 531–540.
11 Esposito G, Fogolari F, Damante G, Formisano S, Tell
G, Leonardi A, Di Lauro R & Viglino P (1997) Hydrogen–deuterium exchange studies of rat thyroid transcription factor 1 homeodomain. J Biomol NMR 9,
397–407.
12 Nirmala NR & Wagner G (1988) Measurement of 13C
relaxation times in proteins by two-dimensional hetero-
FEBS Journal 275 (2008) 435–448 ª 2007 The Authors Journal compilation ª 2007 FEBS
D. Gumral et al.
ă
13
14
15
16
17
18
19
20
21
22
23
24
25
26
nuclear 1H13C correlation spectroscopy. J Am Chem
Soc 110, 7557–7558.
Kay LE, Torchia DA & Bax A (1989) Backbone
dynamics of proteins as studied by 15N inverse detected
heteronuclear NMR spectroscopy: application to staphylococcal nuclease. Biochemistry 28, 8972–8979.
Lipari G & Szabo A (1982) Model-free approach to the
interpretation of nuclear magnetic resonance relaxation
in macromolecules: 1. Theory and range of validity.
J Am Chem Soc 104, 4546–4559.
Lipari G & Szabo A (1982) Model-free approach to the
interpretation of nuclear magnetic resonance relaxation
in macromolecules: 2. Analysis of experimental results.
J Am Chem Soc 104, 4559–4570.
Peng JW & Wagner G (1992) Mapping of spectral density functions using heteronuclear NMR relaxation
measurements. J Magn Reson 98, 308–332.
Peng JW & Wagner G (1992) Mapping of the spectral
densities of N–H bond motions in Eglin c using heteronuclear relaxation experiments. Biochemistry 31, 8571–
8586.
Farrow NA, Zhang O, Szabo A, Torchia DA & Kay
LE (1995) Spectral density function mapping using 15N
relaxation data exclusively. J Biol NMR 6, 153–162.
Ishima R & Nagayama K (1995) Quasi-spectral density
function analysis for nitrogen-15 nuclei in proteins.
J Magn Reson B 108, 73–76.
Ishima R & Nagayama K (1995) Protein backbone
dynamics revealed by quasi spectral density function
analysis of amide N-15 nuclei. Biochemistry 34, 3162–
3171.
`
Lefevre JF, Dayie KT, Peng JW & Wagner G (1996)
Internal mobility in the partially folded DNA binding
and dimerization domains of GAL4: NMR analysis of
the N–H spectral density functions. Biochemistry 35,
2674–2686.
`
Dayie KT, Wagner G & Lefevre JF (1996) Theory and
practice of nuclear spin relaxation in proteins. Annu
Rev Phys Chem 47, 243–282.
Mandel AM, Akke M & Palmer AG (1995) Backbone
dynamics of Escherichia coli ribonuclease HI: correlations with structure and function in an active enzyme.
J Mol Biol 246, 144–163.
Fogolari F, Esposito G, Viglino P, Damante G &
Pastore A (1993) Homology model building of the
thyroid transcription factor 1 homeodomain. Protein
Eng 6, 513–519.
Damante G, Pellizzari L, Esposito G, Fogolari F,
Viglino P, Fabbro D, Tell G, Formisano S & Di Lauro
R (1996) A molecular code dictates sequence-specific
DNA recognition by homeodomains. EMBO J 15,
4992–5000.
Clore GM, Szabo A, Bax A, Kay LE, Driscoll PC &
Gronenborn AM (1990) Deviations from the simple
two parameter model free approach to the interpreta-
Backbone dynamics of the rat TTF-1 homeodomain
27
28
29
30
31
32
33
34
35
36
tion of 15N nuclear magnetic relaxation of proteins.
J Am Chem Soc 112, 4989–4991.
Korzhnev DM, Billeter M, Arseniev AS & Orekhov
VY (2001) NMR studies of Brownian tumbling and
internal motions in proteins. Prog NMR Spectrosc 38,
197–266.
Fausti S, Wieler S, Cuniberti C, Hwang KJ, No KT,
Gruschus JM, Perico A, Nirenberg M & Ferretti JA
(2001) Backbone dynamics for the wild type and a double H52R ⁄ T56W mutant of the vnd ⁄ NK-2 homeodomain from Drosophila melanogaster. Biochemistry 40,
12004–12012.
Maciejewski MW, Liu D, Prasad R, Wilson SH & Mullen GP (2000) Backbone dynamics and refined solution
structure of the N-terminal domain of DNA polymerase
beta. Correlation with DNA binding and dRP lyase
activity. J Mol Biol 296, 229–253.
Garcı´ a de la Torre J, Huertas ML & Carrasco B (2000)
HYDRONMR: Prediction of globular proteins from
atomic-level structures and hydrodynamic calculations.
J Magn Reson 147, 138–146.
Kim Y & Nirenberg M (1989) Drosophila NK-homeobox genes. Proc Natl Acad Sci USA 86, 7717–7720.
Dragan AI, Li Z, Makeyeva EN, Milgotino EI, Liu Y,
Crane-Robinson C & Privalov PL (2006) Forces driving
the binding of homeodomains to DNA. Biochemistry
45, 141–151.
Viglino P, Fogolari F, Formisano S, Bortolotti N,
Damante G, Di Lauro R & Esposito G (1993)
Structural study of rat thyroid transcription factor 1
homeodomain (TTF-1 HD) by nuclear magnetic
resonance. FEBS Lett 336, 397–402.
Stone JM, Fairbrother WJ, Palmer AG III, Reizer J,
Saier MH Jr & Wright PE (1992) Backbone dynamics
of the Bacillus subtilis glucose permease IIA domain
determined from 15N NMR relaxation measurements.
Biochemistry 31, 4394–4406.
Palmer AG, Rance M & Wright PE (1991) Intramolecular motions of a zinc finger DNA-binding domain from
Xfin characterized by proton-detected natural abundance 13C heteronuclear NMR spectroscopy. J Am
Chem Soc 113, 4371–4380.
MacKerell AD Jr, Bashford D, Bellott M, Dunbrack
RL Jr, Evanseck JD, Field MJ, Fischer S, Gao J, Guo
H, Ha S et al. (1998) All-atom empirical potential for
molecular modeling and dynamics studies of proteins.
J Phys Chem B 102, 3586–3616.
Supplementary material
The following supplementary material is available
online:
Doc. S1. Experimental details (NMR data acquisition
and processing).
FEBS Journal 275 (2008) 435–448 ª 2007 The Authors Journal compilation ª 2007 FEBS
447
Backbone dynamics of the rat TTF-1 homeodomain
D. Gumral et al.
ă
Table S1. Assignment procedures and 1H and 15N
chemical shift values.
Table S2. 15N Relaxation rate, and {1H}–15N NOE
values.
Table S3. Model-free smi, S2, se and Rex values.
Table S4. Spectral density function values.
Fig. S1. Bar graph of R1, R2 and {1H}–15N NOE values along the sequence of the TTF1 HD at 11.7 T and
286 K.
448
Fig. S2. Plot of J(0.87xN)–J(0) correlation from 15N
relaxation measurements of the TTF-1 HD.
This material is available as part of the online article
from
Please note: Blackwell Publishing are not responsible
for the content or functionality of any supplementary
materials supplied by the authors. Any queries (other
than missing material) should be directed to the corresponding author for the article.
FEBS Journal 275 (2008) 435–448 ª 2007 The Authors Journal compilation ª 2007 FEBS