Tài liệu Báo cáo khoa học: DNA adenine methylation changes dramatically during establishment of symbiosis pdf
Bạn đang xem bản rút gọn của tài liệu. Xem và tải ngay bản đầy đủ của tài liệu tại đây (685.99 KB, 12 trang )
DNA adenine methylation changes dramatically during
establishment of symbiosis
Hiroyuki Ichida
1,2
, Tomoki Matsuyama
3
, Tomoko Abe
2
and Takato Koba
1
1 Graduate School of Science and Technology, Chiba University, Matsudo, Japan
2 Accelerator Application Research Group, Nishina Center for Accelerator-Based Science, RIKEN, Hirosawa, Wako, Saitama, Japan
3 Cellular Biochemistry Laboratory, Discovery Research Institute, RIKEN, Hirosawa, Wako, Saitama, Japan
Restriction landmark genome scanning (RLGS) is a
method for the two dimensional display of end-labeled
DNA restriction fragments and is an unbiased method
for DNA methylation scanning in higher eukaryotes
[1]. Virtual image (Vi-) RLGS software simulates two
dimensional DNA electrophoresis patterns based on
whole-genome sequence data, allowing the rapid
matching of DNA spots to their sequences without the
time and effort of cloning [2]. Recent advances in
DNA sequencing technology have enabled the sequen-
cing of entire genomes in various organisms, and the
resulting data allow a comprehensive analysis of gen-
ome dynamics during host–microbe interactions.
Bradyrhizobium japonicum and Mesorhizobium loti
are symbiotic bacteria that perform nitrogen fixation
in host plant roots. Their principal hosts are soybean
and Lotus japonicus, which are an important grain
crop and a model legume, respectively. Biological
nitrogen fixation is an important source of nitrogen in
agricultural production, particularly for fabaceae
crops, including soybean; for example, 90% of
nitrogen is biologically fixed in well-nodulated soybean
plants [3]. Agrobacterium tumefaciens was originally
isolated as a causal agent of crown gall disease in
plants. It infects more than 90 families of dicotyledo-
nous plants, resulting in major agronomic losses
worldwide [4].
DNA methylation regulates critical functions in
prokaryotic and eukaryotic cells. C5-methyl-cytosine,
N4-methyl-cytosine, and N6-methyl-adenine are found
Keywords
cell cycle-regulated methyltransferase; DNA
adenine methylation; in silico restriction
landmark genome scanning; plant–microbe
interactions; specifically unmethylated
region
Correspondence
H. Ichida, Accelerator Application Research
Group, Nishina Center for Accelerator-Based
Science, RIKEN, 2-1,
Hirosawa, Wako, Saitama 351-0198, Japan
Fax: +81 48 4624674
Tel: +81 48 4621111 Ext. 5432
E-mail:
(Received 31 October 2006, revised 7
December 2006, accepted 11 December
2006)
doi:10.1111/j.1742-4658.2007.05643.x
The DNA adenine methylation status on specific 5¢-GANTC-3¢ sites and
its change during the establishment of plant–microbe interactions was
demonstrated in several species of a-proteobacteria. Restriction landmark
genome scanning (RLGS), which is a high-resolution two dimensional
DNA electrophoresis method, was used to monitor the genomewide change
in methylation. In the case of Mesorhizobium loti MAFF303099, real
RLGS images obtained with the restriction enzyme MboI, which digests at
GATC sites, almost perfectly matched the virtual RLGS images generated
based on genome sequences. However, only a few spots were observed
when the restriction enzyme HinfI was used, suggesting that most GANTC
(HinfI) sites were tightly methylated and specific sites were unmethylated.
DNA gel blot analysis with the cloned specifically unmethylated regions
(SUMs) showed that some SUMs were methylated differentially in bacter-
oids compared to free-living bacteria. SUMs have also been identified in
other symbiotic and parasitic bacteria. These results suggest that DNA
adenine methylation may contribute to the establishment and ⁄ or mainten-
ance of symbiotic and parasitic relationships.
Abbreviations
CcrM, cell cycle-regulated methyltransferase; Dam, deoxyadenosine methyltransferase; RLGS, restriction landmark genome scanning; SUM,
specifically unmethylated region; Vi, virtual image.
FEBS Journal 274 (2007) 951–962 ª 2007 The Authors Journal compilation ª 2007 FEBS 951
in microbial genomes. In bacteria, these methylated
bases are best known as important agents for restric-
tion-modification systems, which distinguish self and
nonself DNA to protect bacteria from invaders. In this
system, the host DNA is methylated and only unmeth-
ylated DNA is digested by cognate restriction endo-
nucleases [5]. In mammalian genomes, DNA is
methylated at the C5 position of cytosine within CpG
dinucleotide sequences. In the human genome, almost
half of the genes have short CpG-rich regions, which
are called CpG islands. A significant proportion of all
CpG islands become methylated during development;
when this happens, the associated promoter is stably
silent. Aberrant CpG hypermethylation and resulting
transcriptional silencing is sometimes observed in can-
cer [6,7]. CpG methylation is also known to participate
in genomic imprinting and X-chromosome inactivation
[8,9].
Cell-cycle-regulated methyltransferase (CcrM), ori-
ginally cloned from Caulobacter crescentus [10], is
the best-characterized solitary methyltransferase that
is not associated with restriction-modification sys-
tems, aside from deoxyadenosine methyltransferase
(Dam). CcrM is thought to be a common regulatory
component of a-proteobacteria [11]. Both CcrM and
Dam catalyze the transfer of a methyl group from
S-adenosylmethionine to the N6 position of adenine.
However, they are classified in different methyltrans-
ferase groups due to their domain structures and tar-
get sequences. CcrM transfers a methyl group to
adenine embedded in 5¢-GANTC-3¢ sites and its
homologues are considered essential for cell viability
because of their involvement in the regulation of cell
division, gene expression, and virulence [10,12,13].
Robertson et al . [14] showed that the replication
ability of Brucella abortus, which infects many mam-
mals, including humans, was slightly reduced when bac-
terial strains over-expressing CcrM were inoculated
into murine macrophages. The necessity for CcrM
methylation in diverse bacteria suggests its import-
ance in the regulation of gene expression. However,
the genomewide methylation status has not yet been
elucidated due to the lack of an appropriate analysis
tool.
We used in silico RLGS analysis to achieve genome-
wide monitoring of bacterial DNA methylation
status, successfully demonstrated the existence of
stably unmethlyated regions on several bacterial
genomes, and demonstrated a dramatic change in
methylation during plant–microbe interactions. This
approach may provide novel insights into a variety of
symbiotic and parasitic relationships, including human
diseases.
Results
In silico RLGS visualized the genomes efficiently
We obtained RLGS patterns of A. tumefaciens C58,
B. japonicum NBRC14792, and M. loti MAFF303099
with several enzyme combinations. The most import-
ant step in RLGS analysis is selecting landmark
enzymes that produce well-focused and informative
spot patterns. We used AscI, BspEI, MluI, and NotIas
landmark enzymes. These four enzymes cleave specific
GC-rich sequences and therefore gave satisfactory
resolution of a sufficient number of spots because the
genomes of all three bacterial strains have high GC
content (data not shown). For example, approximately
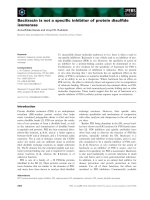
1071, 979, and 1025 spots were visualized in the RLGS
analysis of M. loti MAFF303099 with AscI, BspEI,
and NotI as landmark enzymes, respectively, in combi-
nation with MboI as a second dimension fragmenta-
tion enzyme (Fig. 1A and data not shown). The
reproducibility of spots was confirmed with at least
triplicate analyses.
The RLGS patterns obtained experimentally (real
RLGS patterns) and those simulated by computer ana-
lysis of whole-genome sequences (virtual RLGS pat-
terns) matched almost perfectly (Fig. 1). The validity
of spot assignments was confirmed by PCR and
sequencing with eluted spot DNA and its assigned
sequence-specific primers (data not shown). If genome
changes such as length mutations, point mutations at
the restriction enzyme recognition sequences, and a
change of methylation status occurred, the spots cor-
responding to the changed region would be in different
locations or absent on the real RLGS pattern com-
pared to the virtual RLGS pattern. Thus, we can
obtain their sequences by comparing the real and vir-
tual RLGS patterns, without cloning.
The ability of in silico RLGS analysis to comprehen-
sively visualize genome changes was examined (Fig. 2
and Table 1). We found that the spots located between
500 and 15 000 bp in the first dimension and between
100 and 1000 bp in the second dimension always
showed sufficient resolution and reproducibility with
every enzyme combination used (data not shown). The
first dimension coverage of M. loti MAFF303099 with
the enzyme combinations of AscI–MboI, BspEI–MboI,
and NotI–MboI was 42.3, 61.8, and 49.2%, respect-
ively. Overall, the first dimension coverage of the three
enzyme combinations without duplication was 87.3%.
This result clearly demonstrates that RLGS analysis
combined with in silico profiling enables efficient and
high density scanning for mutations over the entire
genome with good resolution.
Genomewide analysis of DNA adenine methylation H. Ichida et al.
952 FEBS Journal 274 (2007) 951–962 ª 2007 The Authors Journal compilation ª 2007 FEBS
Adenine methylation status in M. loti
MAFF303099
We scanned for the adenine methylation status of
M. loti MAFF303099 using in silico RLGS profiling.
The a-proteobacteria, including M. loti MAFF303099,
are thought to have CcrM, which transfers a methyl
group from S-adenosylmethionine to the amino group
of the adenine moiety embedded in the sequence
5¢-GANTC-3¢. The restriction endonuclease HinfI
cleaves unmethylated GANTC sites, but not methyl-
ated sites. The cleavage by the landmark enzymes
(AscI, MluI, and NotI) is not affected by CcrM
methylation because of the lack of GANTC sequences
on their recognition sequences; therefore, the spot
intensity directly reflected the CcrM methylation status
at the HinfI site of the corresponding genome region.
The deduced total coverage with these three enzyme
combinations was 91.0% (Table 1).
The real and virtual RLGS patterns of M. loti
MAFF303099 obtained with NotI–HinfI are shown in
Fig. 3. Similar results were obtained with AscI–HinfI
and MluI–HinfI (data not shown). Most of spots on
the real RLGS patterns clustered on the top (Fig. 3A;
arrowhead); this feature was never observed with
MboI. Clustered spots were formed when the fragment
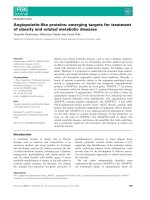
Fig. 1. Comparison between real and virtual restriction landmark genome scanning (RLGS) patterns of M. loti MAFF303099. (A) Real RLGS
pattern of M. loti MAFF303099 with NotI as the landmark enzyme and MboI as the second dimension fragmentation enzyme. There are
1071 informative spots in the pattern. (B) Virtual RLGS pattern calculated based on the whole-genome sequence. The numbers to the
right of the spots correspond to the sequence numbers listed separately. The supplemental material contains a high-resolution version of
the real and virtual RLGS patterns and the sequence list. (C) Spot sequence identification by in silico RLGS profiling. Boxed regions in (A)
and (B) were compared, and the information was merged onto the real RLGS pattern. Using this profile, the sequence of the mutated spots
can be obtained immediately. The colors of spots (B) and numbers (C) indicate their replication origin (blue, main chromosome; red, pMLa;
green, pMLb).
H. Ichida et al. Genomewide analysis of DNA adenine methylation
FEBS Journal 274 (2007) 951–962 ª 2007 The Authors Journal compilation ª 2007 FEBS 953
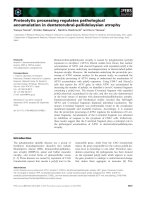
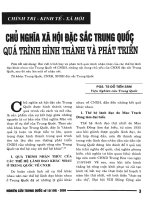
Fig. 2. Map of visualized regions on the
RLGS patterns and specifically unmethyl-
ated regions (SUMs) of M. loti
MAFF303099. The innermost yellow line
indicates the average GC content of the
corresponding region. The window size is
10 kb and is plotted for each 1-kb shift. The
white lines on the next three concentric
circles indicate the positions of the landmark
enzyme recognition sites, and the green
lines indicate visualized genome regions in
the RLGS pattern. The enzyme combina-
tions are AscI–MboI, BspEI–MboI, and
NotI–MboI, from inner to outer, respect-
ively. The magenta lines indicate the
genome regions visualized with at least one
enzyme combination. The blue bars indicate
SUMs identified by adapter-mediated PCR.
The large divisions on the scale indicate
1 Mb.
Table 1. RLGS coverage (%) in the three bacteria. 1D, Percentage of genome regions that visualize in first dimensional (agarose gel) electro-
phoresis. 2D, Percentage of genome regions that visualize in second dimensional (polyacrylamide gel) electrophoresis.
Enzyme combination
and dimension
Agrobacterium
tumefaciens C58
Circular chr.
Agrobacterium
tumefaciens C58
Linear chr.
Bradyrhizobium
japonicum
USDA110
Mesorhizobium
loti MAFF303099
1D 2D 1D 2D 1D 2D 1D 2D
AscI-Mbol 27.4 1.3 23.8 1.0 39.3 2.0 42.4 2.4
BspEl-Mbol 70.0 5.8 68.2 5.8 56.4 4.4 61.8 4.5
Notl-Mbol 34.2 2.0 41.8 2.2 48.8 3.2 49.2 3.2
Total coverage 85.9 8.7 86.7 8.6 86.1 8.9 87.3 9.5
Ascl-Hinfl 26.9 2.7 21.6 2.0 58.5 7.8 52.6 7.2
Mlul-Hinfl 51.3 6.5 48.9 6.2 68.5 9.2 55.9 7.0
Notl-Hinfl 36.5 4.1 42.6 4.5 70.8 12.1 61.0 8.9
Total coverage 77.0 12.5 80.0 12.3 95.6 20.1 91.0 21.0
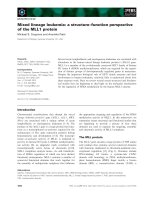
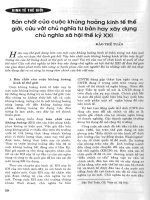
Fig. 3. Real and virtual RLGS patterns obtained using NotI–HinfI. (A) Real RLGS pattern of M. loti MAFF303099. The image was obtained
using NotI as the landmark enzyme and HinfI as the second dimension fragmentation enzyme. Although most of the spots are located on
the top left (short in the first dimension and long in the second dimension), 104 apparent spots are visualized below the cluster. (B) Virtual
RLGS pattern calculated based on the whole-genome sequence and conditions corresponding to those in (A). Unlike in the real RLGS pat-
tern, these spots are randomly dispersed, suggesting that specific genome regions of M. loti MAFF303099 are unmethylated and that
methylation status is stably heritable. (C, D) Real (C) and virtual (D) RLGS patterns of P. syringae DC3000. This strain does not have CcrM
homologues; therefore, most of the spots are randomly dispersed on the image and are well matched with the virtual RLGS pattern. (E, F)
Real RLGS patterns of free-living M. loti MAFF303099 (E) and bacteroids (F) obtained using AscI–HinfI. Although these patterns were
obtained under the same procedural conditions, the signal intensity of the spots that were located outside of the clustered region was
slightly reduced in the bacteroids. (G, H) Real RLGS patterns of B. japonicum NBRC14792 (G) and A. tumefaciens C58 (H) obtained using
NotI–HinfI. As observed in (A), most of the spots are located on the top, but some apparent spots appear below the cluster. These results
demonstrate the generality of SUMs in a variety of bacteria.
Genomewide analysis of DNA adenine methylation H. Ichida et al.
954 FEBS Journal 274 (2007) 951–962 ª 2007 The Authors Journal compilation ª 2007 FEBS
A
B
C
D
E
F
HG
H. Ichida et al. Genomewide analysis of DNA adenine methylation
FEBS Journal 274 (2007) 951–962 ª 2007 The Authors Journal compilation ª 2007 FEBS 955
lengths were the same in the first and second dimen-
sions. To clarify whether the formation of clustered
spots was due to insufficient cleavage activity of HinfI,
we obtained real and virtual RLGS images of Pseudo-
monas syringae pv. tomato DC3000 DNA, which is
classified as a c -proteobacteria and does not have
CcrM homologues. The real and virtual images of
P. syringae pv. tomato DC3000 with MluI–HinfI
matched almost perfectly (Fig. 3C,D). These results
clearly showed that most of the GANTC sites in the
M. loti MAFF303099 genome were strictly methylated,
and cleavage by HinfI was blocked due to methylation
on adenine and ⁄ or cytosine residues on the GANTC
sites. Bisulfite sequencing, which is a widely used tech-
nique to determine cytosine methylation levels in base
pair resolution, demonstrated that the cytosine nucleo-
tides, including HinfI sites, were completely unmethyl-
ated (data not shown). Therefore, the blocking of
HinfI cleavage was caused by DNA adenine methyla-
tion at GANTC sites. Interestingly, 82, 94, and 104
spots were observed in the correct second dimension
position in the images obtained with AscI–HinfI,
MluI–HinfI, and NotI–HinfI, respectively (Fig. 3A,B,
and data not shown). These spots suggest that the
M. loti MAFF303099 genome was partly unmethyl-
ated, and the methylation status had been inherited
stably. We refer to these regions as specifically un-
methylated regions (SUMs).
Comprehensive catalog of specifically
unmethylated regions
Real and virtual RLGS images obtained with HinfI
clearly demonstrated the occurrence of SUMs; how-
ever, their nucleotide sequences could not be obtained
by in silico RLGS profiling because most of the spots
were methylated and the number of informative land-
mark spots was insufficient for matching the real and
virtual RLGS patterns. There were 104 spots on the
real NotI–HinfI RLGS pattern and its coverage was
61.0% (Fig. 3A and Table 1). Therefore, we estimated
that there were 170 nonredundant SUMs in the
free-living M. loti MAFF303099 genome.
Adapter-mediated PCR was used to amplify the
SUMs in the genome. Approximately 30 major bands
were observed on 5% polyacrylamide gels when NotI
and HinfI adapter-mediated amplification were per-
formed (data not shown). We obtained 339 clones
amplified with AscI, MluI, or NotI and HinfI.
Sequence analysis showed that these clones originated
from 145 individual genome regions (Table S2). The
number of times a sequence appeared in the 339 clones
ranged from 1 to 15; this reflects, at least partly, the
levels of unmethylation in the genome. The distribu-
tion of SUMs on the main chromosome (50 sequences
in total) is shown in Fig. 2 (blue bars). Fourteen of the
SUMs (28%) were located in the symbiosis island,
which is the best-characterized extraneous region on
rhizobium genomes. The average GC content of the 50
sequences was 56.8%, which is much lower than that
of the main chromosome (62.7%). The overall average
GC content of the 145 individual SUM sequences was
also lower (57.3%) than that of the main chromosome.
Although the two plasmids, designated pMLa and
pMLb, have a lower GC content than the main chro-
mosome, the GC content of the SUMs was lower.
These results suggest that the formation of SUMs may
be correlated with GC content.
Adenine methylation changes during nodule
development
To investigate the biological significance of SUMs, we
monitored the change in adenine methylation status
before and after establishing nodules (Fig. 3E,F). Nod-
ules consist of a mixture of plant and bacterial cells;
therefore, uninfected plant root DNA was used as a
negative control for the nodule pattern (data not
shown). Comparisons between free-living M. loti
MAFF303099 and bacteroids with
AscI–HinfI, MluI–
HinfI, and NotI–HinfI revealed that the signal intensi-
ties derived from SUMs were decreased distinctly in
bacteroids (Fig. 3E,F, and data not shown; arrow-
heads indicate some examples of spots that disap-
peared); these patterns were obtained under the same
conditions, i.e., the amount of DNA, reagent lots, elec-
trophoresis, autoradiography, and film development
and digitization. These results suggest that the bacter-
ial DNA adenine methylation status changes during
the establishment of the symbiotic relationship and
may contribute to the regulation of plant–microbe
interactions.
To confirm the change in methylation during nodule
development, DNA from free-living bacteria and nod-
ules was probed with the cloned SUMs described
above (Table 2). Although we collected 145 individual
SUMs, fragments less than 200 bp in length did not
provide sufficient sensitivity. Therefore, the 29 SUMs
that were longer than 200 bp in length and appeared
twice or more were chosen as probes. Of these, 27
(93.1%) gave significant signals in the NotI–HinfI
digestion, but not in the NotI digestion. The signal
intensity of 20 loci was decreased in nodules; therefore,
these loci are methylated during nodule development
(Fig. 4 and Table 2). The other nine loci were un-
methylated in both nodules and free-living bacteria.
Genomewide analysis of DNA adenine methylation H. Ichida et al.
956 FEBS Journal 274 (2007) 951–962 ª 2007 The Authors Journal compilation ª 2007 FEBS
These results clearly demonstrate that the CcrM
methylation status changes during the establishment of
plant–microbe interactions. It is possible that the dif-
ference in signal intensity between free-living cells and
bacteroids is attributable to changes in the number of
plasmid copies. DNA gel blot and real-time PCR ana-
lysis demonstrates that the number of copies of the
pMLa and pMLb plasmids did not differ between
before and after establishing symbiosis (Table S3).
Therefore, the reduction in SUMs in nodules origin-
ated from a change in the DNA methylation state
during the establishment of symbiosis.
SUMs are ubiquitous in a variety of
plant-associated bacteria
To investigate whether the formation of SUMs is a
common phenomenon in bacteria, we obtained real
and virtual RLGS patterns of B. japonicum
NBRC14792 (genetically equivalent to USDA110) and
A. tumefaciens C58, which establish symbiotic and
parasitic relationships with plants, respectively. As in
M. loti MAFF303099, the spots were randomly dis-
persed in the virtual RLGS patterns; however, most of
the spots were localized on the top, and only 67 and
32 spots were detected at the predicted positions in
B. japonicum NBRC14792 (Fig. 3G) and A. tumefac-
iens C58 (Fig. 3H), respectively, with the NotI–HinfI
combination. These results suggest that SUMs are
widely distributed in a variety of bacteria and may
play a significant role in regulatory mechanisms.
Discussion
We showed that in silico RLGS profiling, which is
based on a comparison between real RLGS patterns
Table 2. DNA methylation levels at the SUMs in free-living and bacteroids, determined by DNA gel blot analysis. The unmethylated HinfI is
underlined. Unmethylated band intensity was expressed as – (unmethylated signal not detected) and + to +++++(weakest to strongest
signal). Asterisks indicate two or more unmethylated bands were detected.
Identifier
Length
(bp) GC (%)
Corresponding genome region Unmethylated band intensity
Replicon Position HinfI flanking sequence Free-living Nodule
ARM-AH1-A01 747 52.0 Chr 4 832 908–4 833 663
a
CCATTTCA GAGTC GATGGGAC ++
ARM-AH1-A05 310 63.6 Chr 6 203 593–6 203 911 TTTCGCGG
GATTC TATGGTGA +++ –
ARM-AH1-B07
b
600 54.5 Chr 5 243 365–5 243 973
a
GCCAAGAA GATTC TGTGGTCG ++++ +++
ARM-AH1-B09
b
315 53.1 Chr 5 028 568–5 028 891
a
CAAATTGC GACTC AGGACGTT + –
ARM-AH1-C07
b
613 55.8 Chr 6 575 187–6 575 776 ACAGGTTC GAATC CTGTCGGG +++ +++
ARM-AH1-D02 578 63.4 Chr 5 949 372–5 949 958 GGTTAGGG
GACTC GAAGGAGA ++
ARM-AH1-G03 278 59.9 Chr 3 263 864–3 264 150 CCATTTGT
GAATC TATTTCAC ++++ +++
ARM-MH1-B05
c
265 50.4 Chr 6 514 690–6 514 955 TTAATCAT GATTC GCTGGGCA +++++ +++
ARM-MH2-A05 400 63.3 Chr 3 201 209–3 201 614 TCGTTAAC
GAATC ATTAACCA +++ +++
ARM-MH2-A12 224 60.4 Chr 3 568 019–3 568 443 TAGGTGAC
GATTC AGCCTTGT +–
ARM-MH2-B02 226 59.4 Chr 3 263 864–3 264 093 CCATTTGT
GAATC TATTTCAC + +, * +, *
ARM-MH2-B04 268 55.6 Chr 4 833 387–4 833 663
a
TGTCGACG GAATC GAGCATAT ++++,* +,*
ARM-NH1-A08 222 64.9 Chr 4 854 311–4 854 541
a
ACCCAGTC GAGTC CGGGCGGA +, * –
ARM-NH1-A11 563 60.1 Chr 6 473 862–6 474 433 TCTTAATT
GAGTC AAAAAAAT ++++ +++
ARM-NH1-B09 405 53.1 Chr 1 515 191–1 515 604 CTGAAAAG
GATTC CGGACTCT +++++ +
ARM-NH1-B10 226 54.5 Chr 2 597 327–2 597 561 TTCTCCAA
GATTC AAATCTCC ++,* –
ARM-NH1-C09 528 61.6 Chr 6 735 980–6 736 516 ATATAGTT
GACTC CGTCAAGT ++++,* ++++,*
ARM-NH1-D07 314 60.4 Chr 5 011 098–5 011 420
a
AGAGAATA GAGTC GTGTATTA +++ –
ARM-NH1-F05 246 54.9 Chr 3 720 571–3 720 825 AGGACCAT
GATTC GGACTTGG ++,* ++,*
ARM-NH1-H12 288 51.2 Chr 4 916 344–4 916 637
a
ATAATGAA GAGTC GTTCATCC ++,* +
ARM-NH2-B02 393 53.0 Chr 5 334 423–5 334 780 TCAGTCAT
GAGTC ACTCCGAA ++,* ++,*
ARM-NH2-D07 586 57.1 Chr 5 443 356–5 443 950 CGTCGAGC
GATTC CCAAGTTT ++++ ++
ARM-MH1-D03 246 55.3 pMLa 153 845–154 098 GTCCCCTA
GATTC CACTTTAT +++ +
ARM-MH1-D05 297 54.6 pMLa 56 482–56 786 TTCCCGGA
GAATC GTCAAATT ++ ++
ARM-NH1-A10 528 55.3 pMLa 105 514–106 050 TTTATATC
GAGTC TGTTACGG +++++ +++
ARM-NH1-E12
b
555 57.6 pMLa 310 685–311 238 TACGTTTT GAGTC TGCAACAT +++++ +
ARM-NH1-F08 583 58.1 pMLa 154 241–154 803 GCTTGTAG
GATTC ACTTCAAA +++++,* +,*
ARM-AH1-A06 434 57.6 pMLb 113 426–113 868 AATTCCCT
GACTC CCGTCGAA + + + + +, * + +, *
ARM-NH1-B05
b
566 56.2 pMLb 184 911–185 482 GTCTGTTC GAGTC AGCAAACC ++++ ++,*
ARM-NH1-F06 261 58.1 pMLb 46 255–46 524 TTGATTAA
GATTC CTAATTTA ++++,* +
a
Located in symbiosis island.
b
Contained repeat core unit of nod box.
c
Contained CtrA binding motif.
H. Ichida et al. Genomewide analysis of DNA adenine methylation
FEBS Journal 274 (2007) 951–962 ª 2007 The Authors Journal compilation ª 2007 FEBS 957
obtained experimentally and virtual RLGS patterns
obtained by computer simulation of whole-genome
sequences, is an effective method for monitoring
genomic dynamism in bacteria (Fig. 3 and Table 1).
The average first dimension coverage of the main chro-
mosome using three enzyme combinations was 86.5%
for the three bacterial strains examined. These results
clearly demonstrate that in silico RLGS profiling can
provide rapid and accurate scanning for genomic chan-
ges in bacteria.
In silico RLGS analysis was used to monitor
genomewide CcrM methylation during plant–microbe
interactions. CcrM, which is a member of the b group
of methyltransferases, was originally discovered as a
cell-cycle-regulated methyltransferase [10] and is essen-
tial for cell viability in a variety of a-proteobacteria
[15]. It is a global regulator of gene expression, in
which the transcription of the ccrM gene itself is inhi-
bited by CcrM methylation [13]. Over-expression of
CcrM decreases the replication ability of B. abortus
[14]; thus, this methylase might contribute to the regu-
lation of host–parasite interactions. We demonstrated
that most of the GANTC sites, which correspond to
CcrM target sequences, are usually methylated in the
M. loti MAFF303099, B. japonicum NBRC14792, and
A. tumefaciens C58 genomes (Fig. 3). However, some
GANTC sites in these genomes are specifically
unmethylated, and the methylation status is heritable.
We obtained 145 nonredundant SUMs from 339 indi-
vidual clones using adapter-mediated PCR (Table S2),
which may comprise 85% of all SUMs in the gen-
ome of free-living M. loti MAFF303099. Sequencing
and mapping results suggest that the SUMs are loca-
lized in low-GC regions on the genome, and their aver-
age GC content was much lower than those of the
main chromosome and two plasmids (Fig. 2 and
Table 2). Horizontal gene transfer is thought to be a
major force in genome plasticity and may play a cru-
cial role in evolution [16]. Historically, fitness-enhan-
cing traits such as antibiotic resistance, virulence,
organic solvent degradability, and symbiotic nitrogen
fixation ability were transmitted by this mechanism.
Now, many gene candidates transferred among pro-
karyotes and from prokaryotes to eukaryotes are iden-
tified via comparative genomic analysis [17]. The
relationship between SUMs and the GC content indi-
cates an association with genome evolution.
Why and how are some genome regions specifically
unmethylated? The pioneering work conducted with
Dam of Escherichia coli hints at the answers to these
questions. Dam belongs to the a group of methyl-
transferases and transfers a methyl group to the N6
position of the adenine in 5¢-GATC-3¢ sites. Tavazoie
and Church [18] found that the Escherichia coli chro-
mosome contains 23 stably unmethylated GATC sites
and that all of them are located in the 5¢ noncoding
AB
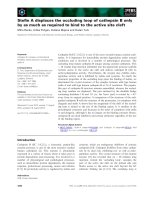
Fig. 4. DNA methylation status before and after establishing symbiosis. (A) Hybridization pattern of ARM-AH1-B07. The ratio of methylated
and unmethylated signals differed before (free-living bacteria) and after (nodule) the symbiotic relationship was established. Lane 1, free-
living M. loti MAFFF303099 DNA digested with NotI and HinfI; lane 2, nodule DNA digested with NotI and HinfI; lane 3, free-living M. loti
MAFFF303099 DNA digested with NotI; lane 4, nodule DNA digested with NotI. (B) Signal quantification results. Methylated and unmethylat-
ed signal intensities were normalized by NotI-derived signals (lanes 3 and 4). The data were calculated from three individual hybridization
experiments.
Genomewide analysis of DNA adenine methylation H. Ichida et al.
958 FEBS Journal 274 (2007) 951–962 ª 2007 The Authors Journal compilation ª 2007 FEBS
region of putative open reading frames. They also des-
cribed several independent lines of evidence supporting
protein binding at these sites [18]. Therefore, competi-
tion between methyltransferase and these proteins may
be the mechanism behind stable unmethylation. In this
manner, SUMs in a-proteobacteria may be formed by
competition between DNA-binding proteins and
CcrM. Our preliminary search found two protein-bind-
ing motifs in the cloned SUM sequences. The binding
motif for CtrA, a global response regulator (TTAA-
N
7
-TTAA [19]), was identified in the SUM clone
ARM-MH1-B05. The motif was located 5 bp upstream
of the unmethylated HinfI site. The unmethylated
HinfI site of ARM-MH1-B05 was located between
positions 6 514 955 and 6 514 959 on the main chro-
mosome. This region is 149 and 298 bp upstream of
mll7872 (position 6 514 807–6 513 713; encodes an
unknown protein) and mlr7873 (position 6 515 256–
6 517 130; encodes a cellulose synthase-like protein),
respectively. The other motif was a repeat core unit of
nod box (ATC-N
9
-GAT [20]), which is the binding site
of NodD, a LysR-type transcriptional regulator that
directs specific flavonoid-dependent nodulation gene
expression [21]. Of the 145 nonredundant SUM
sequences, 16 contained this core motif and seven of
these were located on the symbiosis island (Table 2
and S2). The number of nucleotides between the nod
repeat core unit and the unmethylated Hin fI site varied
from 1 to 681, and averaged 283. Although most
NodD proteins bind to the promoter when specific
flavonoids are present, some are activated independ-
ently of flavonoids and have greater transcriptional
activity than the flavonoid-dependent proteins [22]. In
addition, the flavonoid-dependent NodD proteins also
exhibit relatively weaker, but detectable, DNA-binding
activity in the absence of inducers [23]. Therefore,
at least some type of NodD protein can competi-
tively inhibit CcrM methylation, even in the free-living
condition. It is likely that SUMs are formed by
competition between CcrM and DNA-binding
proteins. Biochemical analysis with purified CcrM and
various DNA-binding proteins will be a key for further
analysis.
This is the first report of specific unmethylation of
GANTC sites and of methylation status changes in
response to environmental conditions. We also demon-
strated that in silico RLGS analysis is an effective
methodology for bacterial genomes. We used it to visu-
alize the dramatic change in DNA adenine methylation,
but it is also applicable for genomewide scanning of
insertions and deletions. The dramatic change in the
CcrM methylation state may reflect the cell status, par-
ticularly for protein–DNA interactions. Although we
focused on plant–microbe symbiotic interactions, para-
sitic interactions between plants or animals and
microbes are also important for further studies. DNA
adenine methylation may provide novel insights into
the regulation of bacterial gene expression.
Experimental procedures
Bacterial strains, growth conditions, and plant
inoculation
Mesorhizobium loti MAFF303099 was obtained from the
NIAS GenBank (Ibaraki, Japan). Bradyrhizobium japoni-
cum NBRC14792 (genetically equivalent to USDA110) was
obtained from the NITE Biological Resource Center
(Chiba, Japan). Agrobacterium tumefaciens C58 was from
our laboratory stock. M. loti and B. japonicum were
cultured in YEM medium (0.5 g dipotassium hydrogen-
phosphate, 0.2 g magnesium sulfate, 0.1 g sodium chloride,
5 g mannitol, 5 g sodium gluconate, and 0.5 g yeast extract
per litre, pH 6.9) at 30 °C [24]. A. tumefaciens was cultured
in YEP medium (10 g yeast extract, 10 g peptone, and 5 g
sodium chloride per litre, pH 7.0) at 28 °C. Genomic DNA
of Pseudomonas syringae pv. tomato DC3000 was pur-
chased from ATCC via an official local distributor (Summit
Pharmaceuticals International, Tokyo, Japan).
Lotus japonicus MG-20 seeds were a gift from the
National Bio Resource Project (Miyazaki University,
Miyazaki, Japan). Surface-sterilized L. japonicus MG-20
seeds were germinated on B & D nitrogen-free plates [25]
under a photoperiod of 16 h light ⁄ 8 h dark at 22 °C. A
log-phase culture of M. loti MAFF303099 (optical density
at 600 nm, 0.4–0.6) was washed three times with sterilized
distilled water. L. japonicus MG-20 seedlings with roots 15–
20 mm long were soaked in the washed bacterial cell sus-
pension for 1 min. The inoculated plants were placed on
new B & D nitrogen-free plates and grown for 45 days.
Using this method, one to three nodules usually developed
on each plant. The nodules on green plants with elongated
shoots were harvested as nitrogen-fixing nodules and used
for the following experiments.
DNA protocols
General molecular manipulations were carried out accord-
ing to standard procedures, unless otherwise specified. Bac-
terial DNA was extracted from fresh log-phase cultures
(optical density at 600 nm, 0.4–0.6) using the cetyltrimethyl-
ammonium bromide procedure [26]. Nodule DNA and
plant root DNA were extracted from 100 mg of tissue using
a Nucleon PhytoPure DNA extraction kit according to the
manufacturer’s instructions (GE Healthcare Bio-Sciences,
Piscataway, NJ, USA). All oligonucleotide sequences used
are listed in Table S1.
H. Ichida et al. Genomewide analysis of DNA adenine methylation
FEBS Journal 274 (2007) 951–962 ª 2007 The Authors Journal compilation ª 2007 FEBS 959
Restriction landmark genome scanning
RLGS was performed according to published protocols
with minor modifications [27]. Briefly, DNA was digested
with a cohesive end-producing (landmark) enzyme. Sequen-
ase version 2.0 (USB, Cleveland, OH, USA) was used to fill
in the cohesive ends with [
32
P]dGTP[aP] and [
32
P]dCTP[aP]
(GE Healthcare Bio-Sciences) by incubating for 30 min at
37 °C. The labeled DNA was separated by electrophoresis
through a 60 cm, 0.8% agarose tube gel (first dimension
separation). The agarose tube gel was treated with a second
enzyme at 37 °C for 2 h. Second dimension separation was
performed using nondenaturing 4% (w ⁄ v) polyacrylamide
gels. After overnight electrophoresis, the gels were dried
and exposed to X-ray film in the presence of intensifying
screens (Hi-SCREEN B-2, Fuji Film Medical, Tokyo,
Japan) for 12–48 h. All developed films were digitized using
a laser film digitizer (Model 2905; Array Corp., Tokyo,
Japan). Comparisons between two or more patterns were
made using pdquest basic version 8.0 (Bio-Rad Laborator-
ies, Tokyo, Japan). The reproducibility of real RLGS ima-
ges was confirmed by at least three individual experiments.
The restriction enzyme combinations for each RLGS pat-
tern are specified in the Results and figure legends.
In silico identification of the visualized spots was per-
formed using a modified version of vi-rlgs software [2]
with the whole-genome sequences of A. tumefaciens C58,
B. japonicum USDA110, and M. loti MAFF303099 repor-
ted previously [28–30]. ‘Coverage’ was defined as the
percentage of the total length of visualized spots in the
RLGS images relative to the genome size. For example,
‘first dimension coverage’ of an RLGS image of M. loti
MAFF303099 was calculated as (sum of first dimension
length on the image ⁄ size of the main chromosome:
7 036 071) · 100. The first and second dimension coverages
were calculated computationally from the in silico simula-
tion of RLGS reactions using the genome sequences. The
spots located between 500 and 15 000 bp in the first dimen-
sion and 100 and 1000 bp in the second dimension were
counted as ‘visualized’ spots. Genome regions visualized
with two or more combinations of enzymes were counted
only once when calculating the total coverage from plural
RLGS images.
Methylation profiling
SUMs of the M. loti MAFF303099 genome were amplified
using adapter-mediated PCR. The adapter was synthesized
as two individual oligonucleotides and annealed by boiling
for 3 min, followed by gradual cooling to room tempera-
ture (Table S1). One microgram of M. loti MAFF303099
DNA was digested with 10 units (U) of a landmark enzyme
(NotI, AscI, or MluI) and HinfI for 3 h and recovered by
ethanol precipitation. The precipitated DNA was dissolved
in 3 lL of water and added into the ligation mixture
[100 ng each of landmark- and HinfI-adapter and 5 lLof
Ligation High solution (Toyobo, Tokyo, Japan) in 8.5 lL].
The mixture was incubated at 16 °C for 16 h and subjected
to PCR amplification without purification. PCR was per-
formed in a 50-lL reaction volume containing 5 lLof
10· PCR buffer (Takara, Tokyo, Japan), 4 lL of 2.5 mm
each dNTP mixture, 10 pmol each of CasA- and CasB-
specific primers, 1 lL of ligation solution, and 1.25 U of
Taq DNA polymerase (Takara). Amplification was per-
formed with 30 cycles of 94 °C for 30 s, 55 °C for 60 s, and
72 °C for 90 s. Successful amplification was confirmed by
separation of the products in a 7% nondenaturing poly-
acrylamide gel with appropriate size markers, and the
PCR products were cloned using a TOPO TA cloning kit
(Invitrogen, Carlsbad, CA, USA). The insert of each clone
was sequenced using a BigDye Terminator version 3.1 cycle
sequencing kit and a 3730xl DNA analyzer (Applied Bio-
systems, Foster City, CA, USA) at the Research Resource
Center, RIKEN-BSI. Base identification, assembly, and
mapping to whole-genome sequences were performed auto-
matically by an in-house integrated analysis environment
based on phred ⁄ phrap [31] and A ⁄ G BLAST 2.2.10 (Apple
Computer, Cupertino, CA, USA). All DNA sequences were
submitted to the DNA Data Bank of Japan (DDBJ), with
accession numbers AB264801 to AB265139.
DNA methylation levels at the cloned putative SUMs
were determined by DNA gel blot analysis. Nodule DNA
(5 lg) was digested overnight with or without 10 U of
HinfI in a 30-lL reaction volume, which consisted of
50 mm Tris ⁄ HCl (pH 7.5), 10 mm magnesium chloride,
1mm dithiothreitol, 100 mm sodium chloride, 0.01%
bovine serum albumin, 0.01% Triton X-100, and 10 U of
NotI (Takara). The digested DNA was separated in 1%
(w ⁄ v) agarose gels and transferred to Hybond N
+
mem-
branes (GE Healthcare Bio-Sciences). Probes were prepared
by PCR amplification of the insert regions of each clone
using the primers CasA-specific and CasB-specific. Labeling
and detection were performed using an ECL direct nucleic
acid labeling and detection system (GE Healthcare Bio-
Sciences) according to the manufacturer’s instructions.
Hybridization was performed overnight in the supplied
hybridization buffer containing 0.1 m sodium chloride at
42 °C.
Quantification of plasmid copy numbers
Copy numbers of the two plasmids, pMLa and pMLb, of
M. loti MAFF303099 under free-living and bacteroid con-
ditions were determined by real-time PCR. Three primer
pairs, which amplify evenly distributed regions on the tar-
get, were designed for each replicon. The reaction mixture
consisted of 25 lL of SYBR premix Ex Taq (Takara),
10 pmol of primers, and 10 lL of diluted template DNA in
50 lL. Amplification and real-time quantification were per-
formed with 40 cycles of 94 °C for 30 s, 60 °C for 30 s, and
Genomewide analysis of DNA adenine methylation H. Ichida et al.
960 FEBS Journal 274 (2007) 951–962 ª 2007 The Authors Journal compilation ª 2007 FEBS
72 °C for 20 s using an ABI 7900HT (Applied Biosystems).
Specific amplification of the targets was confirmed by
melting curve analysis and 10% (w ⁄ v) polyacrylamide gel
electrophoresis.
Acknowledgements
The authors thank Sumie Ohbu (Nishina Center for
Accelerator-Based Science, RIKEN) for her technical
assistance. H.I. was supported by the Junior Research
Associate Program of RIKEN. This work was partially
supported by a research grant for the study on genesis
of matter from Ministry of Education, Culture, Sports,
Science and Technology of Japan.
References
1 Akama TO, Okazaki Y, Ito M, Okuizumi H, Konno H,
Muramatsu M, Plass C, Held WA & Hayashizaki Y
(1997) Restriction landmark genomic scanning (RLGS-
M)-based genome-wide scanning of mouse liver tumors
for alterations in DNA methylation status. Cancer Res
57, 3294–3299.
2 Matsuyama T, Kimura MT, Koike K, Abe T, Nakano T,
Asami T, Ebisuzaki T, Held WA, Yoshida S & Nagase H
(2003) Global methylation screening in the Arabidopsis
thaliana and Mus musculus genome: applications of
virtual image restriction landmark genomic scanning
(Vi-RLGS). Nucleic Acids Res 31, 4490–4496.
3 Bergersen FJ, Turner GL, Gault RR, Chase DL &
Brockwell J (1985) The natural abundance of
15
Ninan
irrigated soybean crop and its use for the calculation of
nitrogen fixation. Aust J Agric Res 36, 411–423.
4 DeCleene M & DeLay J (1976) The host range of crown
gall. Bot Gaz 42, 389–466.
5 Wion D & Casadesu´ s J (2006) N6-methyl-adenine: an
epigenetic signal for DNA–protein interactions. Nat Rev
Microbiol 4, 183–192.
6 Bird A (2002) DNA methylation patterns and epigenetic
memory. Genes Dev 16, 6–21.
7 Jones PA & Baylin SB (2002) The fundamental role of
epigenetic events in cancer. Nat Rev Genet 3, 415–428.
8 Riggs AD & Pfeifer GP (1992) X-chromosome inactiva-
tion and cell memory. Trends Genet 8, 169–174.
9 Swain JL, Stewart TA & Leder P (1987) Parental legacy
determines methylation and expression of an autosomal
transgene: a molecular mechanism for parental imprint-
ing. Cell 50, 719–727.
10 Zweiger G, Marczynski G & Shapiro L (1994) A Caulo-
bacter DNA methyltransferase that functions only in
the predivisional cell. J Mol Biol 235, 472–485.
11 Ratel D, Ravanat J, Berger F & Wion D (2006)
N6-methyladenine: the other methylated base of DNA.
Bio Essays 28, 309–315.
12 Low DA, Weyend NJ & Mahan MJ (2001) Roles of
DNA adenine methylation in regulating bacterial gene
expression and virulence. Infect Immun 69, 7197–7204.
13 Stephens CM, Zweiger G & Shapiro L (1995) Coordi-
nate cell cycle control of a Caulobacter DNA methyl-
transferase and the flagellar genetic hierarchy.
J Bacteriol 177, 1662–1669.
14 Robertson GT, Reisenauer A, Wright R, Jensen RB,
Jensen A, Shapiro L & Roop RMI (2000) The Brucella
abortus CcrM DNA methyltransferase is essential for
viability, and its overexpression attenuates intracellular
replication in murine macrophages. J Bacteriol 182,
3482–3489.
15 Reisenauer A, Kahng LS, McCollum S & Shapiro L
(1999) Bacterial DNA methylation: a cell cycle regula-
tor? J Bacteriol 181, 5135–5139.
16 Schwarzenlander C & Averhoff B (2006) Characteriza-
tion of DNA transport in the thermophilic bacterium
Thermus thermophilus HB27. FEBS J 273, 4210–4218.
17 de la Cruz F & Davies J (2000) Horizontal gene transfer
and the origin of species: lessons from bacteria. Trends
Microbiol 8, 128–133.
18 Tavazoie S & Church GM (1998) Quantitive whole-
genome analysis of DNA–protein interactions by in vivo
methylase protection in E. coli. Nat Biotechnol 16, 566–
571.
19 Siam R & Marczynski GT (2000) Cell cycle regulator
phosphorylation stimulates two distinct modes of bind-
ing at a chromosome replication origin. EMBO J 19,
1138–1147.
20 Goethals K, Montagu MV & Holsters M (1992) Con-
served motifs in a divergent nod box of Azorhizobium
caulinodans ORS571 reveal a common structure in pro-
moters regulated by LysR-type proteins. Proc Natl Acad
Sci USA 89, 1646–1650.
21 Perret X, Staehelin C & Broughton WJ (2000) Molecu-
lar basis of symbiotic promiscuity. Microbiol Mol Biol
Rev 64, 180–201.
22 Mulligan JT & Long SR (1989) A family of activator
genes regulates expression of Rhizobium meliloti nodula-
tion genes. Genetics 122, 7–18.
23 Yeh KC, Peck MC & Long SR (2002) Luteolin and
GroESL modulate in vitro activity of NodD. J Bacteriol
184, 525–530.
24 Taurian T, Aguilar PM & Fabra A (2002) Characteriza-
tion of nodulating peanut rhizobia isolated from native
soil population in Cordoba, Argentina. Symbiosis 33,
59–72.
25 Broughton WJ & Dilworth MJ (1971) Control of leghe-
moglobin synthesis in snake beans. Biochem J 125,
1075–1080.
26 Wilson K (1994) Preparation of genomic DNA from
bacteria. In Current Protocols in Molecular Biology, 4th
edn. (Ausubel FM, Brent R, Kingston RE, Moore DD,
H. Ichida et al. Genomewide analysis of DNA adenine methylation
FEBS Journal 274 (2007) 951–962 ª 2007 The Authors Journal compilation ª 2007 FEBS 961
Seidman JG, Smith J A & Strauhl K, eds), pp. 2.4.1–
2.4.2, John Willy & Sons Inc, Hoboken, NJ.
27 Hatada I, Hayashizaki Y, Hirotsune S, Komatsubara H
& Mukai T (1991) A genomic scanning method for
higher organisms using restriction sites as landmarks.
Proc Natl Acad Sci USA 8, 9523–9527.
28 Goodner B, Hinkle G, Gattung S, Miller N, Blanchard
M, Qurollo B, Goldman BS, Cao Y, Askenazi M,
Halling C et al. (2001) Genome sequence of the plant
pathogen and biotechnology agent Agrobacterium tume-
faciens C58. Science 294, 2323–2328.
29 Kaneko T, Nakamura Y, Sato S, Asamizu E, Kato T,
Sasamoto S, Watanabe A, Idesawa K, Ishikawa A,
Kawashima K et al. (2000) Complete genome structure
of the nitrogen-fixing symbiotic bacterium Mesorhizo-
bium loti. DNA Res 7, 331–338.
30 Kaneko T, Nakamura Y, Sato S, Minamisawa K,
Uchiumi T, Sasamoto S, Watanabe A, Idesawa K,
Iriguchi M, Kawashima K et al. (2002) Complete geno-
mic sequence of nitrogen-fixing symbiotic bacterium
Bradyrhizobium japonicum USDA110. DNA Res 9, 189–
197.
31 Ewing B, Hillier L, Wendl MC & Green P (1998) Base-
calling of automated sequencer traces using Phred. I.
Accuracy Assessment. Genome Res 8, 175–185.
Supplementary material
The following supplementary material is available
online:
Fig. S1. Real RLGS pattern of M. loti MAFF303099
with NotI as the landmark endzyme and MboI as the
second-dimension fragmentation enzyme.
Fig. S2. Virtual RLGS pattern of M. loti MAFF303099
with NotI–MboI calculated based on the whole-genome
sequence.
Table S1. Oligonucleotides used in this study.
Table S2. BLAST summary of the 339 stably unmeth-
ylated region sequences.
Table S3. Plasmid copy numbers of M. loti MAFF
303099, quantified by real-time PCR.
This material is available as part of the online article
from
Please note: Blackwell Publishing is not responsible
for the content or functionality of any supplementary
materials supplied by the authors. Any queries (other
than missing material) should be directed to the corres-
ponding author for the article.
Genomewide analysis of DNA adenine methylation H. Ichida et al.
962 FEBS Journal 274 (2007) 951–962 ª 2007 The Authors Journal compilation ª 2007 FEBS