Tài liệu Báo cáo khoa học: Role of receptor-mediated endocytosis, endosomal acidification and cathepsin D in cholera toxin cytotoxicity pdf
Bạn đang xem bản rút gọn của tài liệu. Xem và tải ngay bản đầy đủ của tài liệu tại đây (1.06 MB, 16 trang )
Role of receptor-mediated endocytosis, endosomal
acidification and cathepsin D in cholera toxin cytotoxicity
Tatiana El Hage
1,2,
*, Cle
´
mence Merlen
1,2
*, Sylvie Fabrega
1,2
and Franc¸ois Authier
1,2
1 INSERM, U756, Cha
ˆ
tenay-Malabry, France
2 Universite
´
Paris-Sud, Faculte
´
de Pharmacie, Cha
ˆ
tenay-Malabry, France
Cholera toxin (CT) is the causative agent of the diarr-
heal disease cholera, and mediates its effects by
increasing cAMP levels [1]. The resulting increase in
intracellular cAMP causes net intestinal salt and
water secretion, resulting in massive secretory diarrhea
and changes in cell morphology, presumably due to
Keywords
acidification; cathepsin D; cholera toxin;
endosome; G protein
Correspondence
F. Authier, INSERM U756, Universite
´
Paris-
Sud, Faculte
´
de Pharmacie, 5 rue Jean-
Baptiste Cle
´
ment, 92296 Cha
ˆ
tenay-Malabry,
France
Fax: +33 1 46835844
Tel: +33 1 46835528
E-mail:
*These authors contributed equally to this
work
(Received 19 December 2006, revised 7
March 2007, accepted 20 March 2007)
doi:10.1111/j.1742-4658.2007.05797.x
Using the in situ liver model system, we have recently shown that, after
cholera toxin binding to hepatic cells, cholera toxin accumulates in a low-
density endosomal compartment, and then undergoes endosomal proteoly-
sis by the aspartic acid protease cathepsin-D [Merlen C, Fayol-Messaoudi
D, Fabrega S, El Hage T, Servin A, Authier F (2005) FEBS J 272, 4385–
4397]. Here, we have used a subcellular fractionation approach to address
the in vivo compartmentalization and cytotoxic action of cholera toxin in
rat liver parenchyma. Following administration of a saturating dose of
cholera toxin to rats, rapid endocytosis of both cholera toxin subunits was
observed, coincident with massive internalization of both the 45 kDa and
47 kDa Gsa proteins. These events coincided with the endosomal recruit-
ment of ADP-ribosylation factor proteins, especially ADP-ribosylation fac-
tor-6, with a time course identical to that of toxin and the A subunit of the
stimulatory G protein (Gsa) translocation. After an initial lag phase of
30 min, these constituents were linked to NAD-dependent ADP-ribosyla-
tion of endogenous Gsa, with maximum accumulation observed at
30–60 min postinjection. Assessment of the subsequent postendosomal fate
of internalized Gsa revealed sustained endolysosomal transfer of the two
Gsa isoforms. Concomitantly, cholera toxin increased in vivo endosome
acidification rates driven by the ATP-dependent H
+
-ATPase pump and
in vitro vacuolar acidification in hepatoma HepG2 cells. The vacuolar H
+
-
ATPase inhibitor bafilomycin and the cathepsin D inhibitor pepstatin A
partially inhibited, both in vivo and in vitro, the cAMP response to cholera
toxin. This cathepsin D-dependent action of cholera toxin under the con-
trol of endosomal acidity was confirmed using cellular systems in which
modification of the expression levels of cathepsin D, either by transfection
of the cathepsin D gene or small interfering RNA, was followed by parallel
changes in the cytotoxic response to cholera toxin. Thus, in hepatic cells, a
unique endocytic pathway was revealed following cholera toxin administra-
tion, with regulation specificity most probably occurring at the locus of the
endosome and implicating endosomal proteases, such as cathepsin D, as
well as organelle acidification.
Abbreviations
ARF, ADP-ribosylation factor; CT, cholera toxin; CT-A, cholera toxin A subunit; CT-B, cholera toxin B subunit; ER, endoplasmic reticulum;
GSa, A subunit of the stimulatory G protein; LPS, postmitochondrial supernatant; si, small interfering.
2614 FEBS Journal 274 (2007) 2614–2629 ª 2007 The Authors Journal compilation ª 2007 FEBS
activation of cAMP-dependent protein kinase A.
Although the human small intestine mucosal cell is the
normal target of the toxin, CT is a ubiquitous activa-
tor of adenylate cyclase in most eukaryotic cells [2].
CT belongs to the AB family of bacterial exotoxins,
and consists of a pentameric B subunit (CT-B) and an
A subunit (CT-A) comprising two polypeptides, A1
and A2, linked by a disulfide bond. CT-B binds with
high affinity to GM1, a ganglioside present in apical
membranes of all intestinal epithelial cells. A1 has
ADP-ribosyl transferase activity, whereas A2 contains
a C-terminal KDEL endoplasmic reticulum (ER)
retrieval signal [2].
The intervening steps between CT binding and
adenylate cyclase activation are not fully understood.
There is a characteristic lag period after CT binds to
the cell surface and before an increase in adenylate
cyclase activity is observed. It is generally proposed
that this lag period corresponds to sequential steps of
CT uptake, CT activation and CT translocation to its
protein target, the A subunit of the stimulatory G pro-
tein (Gsa). Two major models have been proposed to
explain the events during this lag time. The first model,
supported by in vivo and in vitro studies on the intoxi-
cation of rat hepatocytes, suggests that CT cytotoxicity
may be related, at least in part, to proteolytic events
within endocytic vesicles [3–7]. Following CT binding
to the plasma membrane of hepatocytes, CT accumu-
lated in a low-density endosomal compartment, with
maximum accumulation observed by 15–30 min [4,7].
Following ATP-dependent endosomal acidification,
internalized CT was rapidly proteolyzed within hepatic
endosomes by aspartic acid protease cathepsin D [7].
In vivo studies showed that the acidotropic agent
chloroquine, as well as the carboxylic ionophore
monensin, inhibited CT activation of adenylate cyclase
and increased the lag period for this process [5,6].
In vitro experiments revealed that hydrolysates of CT
generated by cathepsin D displayed ADP-ribosyltrans-
ferase activity towards exogenous Gs a [7]. However,
the mechanisms by which the endosome-activated
CT-A gains access to Gsa, which is mainly localized to the
inner face of the plasma membrane, remain undefined.
A second activating pathway has been proposed to
operate within the ER, which CT accesses by retrograde
vesicular traffic via the trans-Golgi network. In the
ER, the disulfide bond linking CT-A1 to CT-A2 ⁄
CT-B5 is reduced by protein disulfide isomerase, and
CT-A1 is then translocated to the cytosol in a process
involving ER-associated degradation. The cytosolic
pool of CT-A1 escapes ubiquitin-mediated protein deg-
radation, due to its very limited number of internal
lysine residues [8,9], and subsequently ADP-ribosylates
Gsa. However, mutagenesis studies have indicated that
although the ER retrieval signal of CT-A2 and the ER
localization of the toxin enhance the efficiency of CT
cytotoxicity, they are not absolutely required for toxin
action, suggesting the existence of alternative compart-
ment(s) for CT activation [10,11].
At present, no experimental data exist to support a
mechanism of interaction between the active frag-
ment(s) of CT-A generated at the endosomal locus and
its target, Gsa. The object of the present study was
to investigate endosomally located mechanisms that
regulate the activation and cytotoxic effect of CT in
hepatocytes. Using a subcellular fractionation
approach to address the compartmentalization, activa-
tion and action of CT in vivo, we demonstrate the
existence of a complex of activated CT, Gsa and
ADP-ribosylation factor (ARF) protein in the endo-
somal membrane. This coincided with ADP-ribosy-
lation of Gsa in the endosomal compartment. In
addition, the aspartic acid protease inhibitor pep-
statin A reduced, both in vivo and in vitro, the CT-
stimulated cAMP response in hepatic cells, as did
transfection of MCF-7 cells with cathepsin D small
interfering (si)RNA. In contrast, cathepsin D over-
expression in rat tumor cells increased the cAMP
response to CT. Finally, we report on the endosomal
acidification step, which was specifically increased by
CT and was required for its efficient action in rat liver
and hepatoma cells.
Results
CT-induced translocation and ADP-ribosylation
of Gsa within the endolysosomal apparatus
To determine whether the activated form of endosomal
CT remained functional within hepatic endosomes
in vivo, we first evaluated the subcellular content of
Gsa (CT substrate) in endosomal fractions prepared
from control and CT-injected rats (Fig. 1). In agree-
ment with our previous work [7], a time-dependent
increase in CT-A and CT-B was observed in endoso-
mal fractions 10–20 min after native CT injection
(Fig. 1, upper left blot) or 20–90 min after CT-B injec-
tion (Fig. 1, upper right blot). In control rats,
immunoreactive Gsa was detected as a doublet of
47 kDa and 45 kDa (Fig. 1, lanes 1 of lower blots).
In vivo injection of native CT or CT-B effected a rapid
increase of both the 47 kDa and 45 kDa Gsa isoforms,
with maximal accumulation 20 min (native CT; 32%
increase) or 30 min (CT-B; 77% increase) postinjec-
tion. By 90 min postinjection, both Gsa isoforms had
returned to basal levels (Fig. 1, lane 6 of lower blots).
T. El Hage et al. Cytotoxic action of cholera toxin and cathepsin D
FEBS Journal 274 (2007) 2614–2629 ª 2007 The Authors Journal compilation ª 2007 FEBS 2615
Next, we used the in situ liver model system for
endosome–lysosome transfer analysis to determine the
endosomal fate of the internalized CT and Gsa
(Fig. 2). Transfer of CT and Gsa from the endosomal
compartment to the lysosomal compartment was
examined by Nycodenz density gradient analysis of the
postmitochondrial supernatant (LPS) fractions pre-
pared 20 min after CT administration (Fig. 2A). When
LPS fractions were incubated at 4 °C, most of the CT-
B and Gsa appeared in a single broad region with a
density of 1.077–1.119 gÆmL
)1
(Fig. 2A, left blots),
which mainly coincided with the Golgi marker galacto-
syltransferase (Fig. 2A, upper left panel) and the endo-
somal marker EEA1 or procathepsin D precursor
(Fig. 2B). When the LPS fraction was incubated at
37 °C, there were only minor changes in the distribu-
tion of CT-B (Fig. 2A, upper right blot), with a slight
shift to the right that partially coincided with the lyso-
somal marker acid phosphatase (Fig. 2A, upper right
panel) and the mature 45 kDa cathepsin D enzyme
(Fig. 2B, lower blot). This was accompanied by a par-
tial loss in CT-B immunoreactivity at the endosomal
position (Fig. 2A, upper right blot). However, a major
transfer of both Gsa proteins from the endosomal to
the lysosomal position was clearly detectable, along
with a partial decrease in the total amount of immuno-
reactive Gsa throughout the gradient (Fig. 2A, lower
right blot).
The cofactor ARF, and especially ARF-6, is
required for full ADP-ribosylation of Gsa by activated
CT [12]. Therefore, we evaluated the subcellular con-
tent of ARF proteins in hepatic fractions prepared
from CT and CT-B-injected rats (Fig. 3A). An increase
in ARF content was observed in endosomal fractions
isolated 5 min postinjection of CT-B, and this increase
was maintained for up to 60 min (Fig. 3A, upper
panel). CT administration led to a low and brief
recruitment of ARF-6 to the endosomal membrane
15–30 min postinjection (Fig. 3A, lower panel EN),
a decrease in plasma membrane ARF-6 content
5–15 min postinjection (Fig. 3A, panel PM), and a sus-
tained association of ARF-6 with the cytosolic fraction
5–60 min postinjection (Fig. 3A, panel S).
Finally, we performed an in vivo CT substrate
labeling experiment using [
32
P]NAD and endocytic
vesicles that contained in vivo internalized native
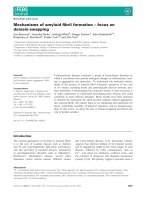
Fig. 1. CT-mediated internalization of Gsa in the endosomal apparatus. Rat liver endosomal fractions were isolated at the indicated times
after the in vivo administration of native CT or CT-B, and evaluated by western blotting for their content of both CT subunits and Gsa. Fifty
micrograms of protein was applied to each lane. Molecular mass markers are indicated on the left of the upper panels. Arrows to the right
indicate the mobility of CT-A ( 28 kDa), CT-B ( 12 kDa) and Gsa ( 47 and 45 kDa). Lower panels: quantification of Gsa signals by scan-
ning densitometry, with results expressed as percentage of signal intensity in the endosomal fraction prepared from control (noninjected)
rats.
Cytotoxic action of cholera toxin and cathepsin D T. El Hage et al.
2616 FEBS Journal 274 (2007) 2614–2629 ª 2007 The Authors Journal compilation ª 2007 FEBS
CT (Fig. 3B). Radiolabeling of endosomal Gsa
was observed with endosomal fractions prepared 30
and 60 min postinjection of native CT. Thus, CT is
active in vivo towards endosomal Gsa following
a 30 min lag period, which probably corres-
ponds to the time required for its internalization
into endocytic structures and subsequent proteolytic
activation.
Effect of CT on ATP-dependent endosomal
acidification
It has been previously reported that 18 h after the
intraperitoneal injection of CT into rats, hepatic endo-
somes displayed increased rates of acidification and a
more acidic steady-state intravesicular pH [13]. There-
fore, we investigated whether CT altered endosomal
A
B
Fig. 2. Transfer of CT-B and Gsa from the endosomal to the lysosomal position on Nycodenz gradients. (A) The LPS fraction was isolated
20 min after CT administration, and immediately subfractionated on linear Nycodenz density gradients (left panels, 4 °C), or incubated with
ATP and an ATP-regenerating system at 37 °C for 60–90 min prior to subfractionation on linear Nycodenz density gradients (right panels,
37 °C). Galactosyltransferase (circles) and acid phosphatase (squares) activities were determined, and results expressed as a percentage of
total enzymatic activity recovered. CT subunits and Gsa content were evaluated for each subfraction by immunoblotting. Thirty microliters of
each subfraction was loaded onto each lane. Arrowheads indicate the median densities of galactosyltransferase (closed arrowhead) and acid
phosphatase (open arrowhead). Arrows on the right indicate the mobilities of immunodetected CT-B ( 12 kDa) and Gsa ( 47 and 45 kDa).
CT-A was below the limits of detection (results not shown). (B) The content of early endosome antigen 1 (EEA1) and cathepsin D (CD) was
evaluated by immunoblotting for each subfraction isolated from the LPS fraction incubated at 37 °C. Components appearing at densities
1.075–1.105 and 1.11–1.14 gÆmL
)1
were scored, respectively, as truly endosomal and lysosomal.
T. El Hage et al. Cytotoxic action of cholera toxin and cathepsin D
FEBS Journal 274 (2007) 2614–2629 ª 2007 The Authors Journal compilation ª 2007 FEBS 2617
acidification during the early stage of CT action, when
most of the internalized CT should be located within
hepatic endosomes. We used a fluorescent weak base,
acridine orange, which concentrates within acidic
compartments and has been widely used to assess
vacuolar H
+
-ATPase activity [14,15]. A time-dependent
decrease in fluorescence intensity was observed within
hepatic endosomes prepared from uninjected rats as
well as toxin-injected rats, both with (closed symbols)
and without (open symbols) addition of ATP
(Fig. 4A). However, endosome acidification was
strongly ATP-dependent, and, in the presence of ATP,
the rate of acidification was markedly increased follow-
ing CT administration (closed squares). The initial rate
of ATP-dependent acidification of endosomes (which
was linearly related to incubation time for the first
5 min) increased two-fold in endosomes isolated from
CT-injected rats (closed squares), but this was not
observed for CT-B-injected (closed diamonds) or
diptheria toxin-injected rats (closed circles).
Bafilomycin A1 neutralizes endosomal acidification
by inhibiting the vacuolar ATPases responsible for
maintaining proton gradients [16]. It was therefore of
interest to determine whether bafilomycin A1 would
similarly affect endosomal acidification in control and
CT-treated cells (Fig. 4B). Incubation of HepG2 cells
for 30 min with bafilomycin A1 alone (0.2 lm) abol-
ished the granular fluorescence of DAMP almost com-
pletely (Fig. 4B, lower left panel). However, a residual
fluorescent staining reminiscent of vesicular acidifica-
tion was clearly observed in cells pretreated with
bafilomycin A1 and then incubated with CT for 2 h
(Fig. 4B, lower right panel). These data are consistent
with our finding that CT increased endosomal acidifi-
cation at the early stage of CT action.
Role of endosomal acidification and cathepsin D
in CT action
To assess whether the aspartic acid protease cathep-
sin D and endosomal acidity might be two major
requirements for CT cytotoxicity in hepatic cells, we
examined the in vivo and in vitro effects of agents that
inhibit aspartic acid protease activity and ⁄ or vesicle
acidification (Fig. 5). Animals were given an intraperi-
toneal injection of either pepstatin A, an inhibitor of
aspartic acid proteases [17], or a mixture of bafilo-
mycin A1 and folimycin, two inhibitors of the vacuolar
ATPases [16], prior to CT administration (50 lg per
100 g body weight). Rats were then killed 50 min
post-CT injection. The cAMP content in rat liver
homogenates isolated from control rats was increased
5-fold over basal levels after CT injection (Fig. 5A,
cf. Basal and CT-Control). Both pepstatin A and
bafilomycin A1 ⁄ folimycin treatment caused a 3-fold
decrease in hepatic cAMP content in CT-treated rats
(Fig. 5A, cf. PA, Bafi ⁄ Foli and Control).
Cellular cAMP content was next measured in vitro
in hepatoma HepG2 cells treated with CT in the
presence or absence of pepstatin A or bafilomycin A1
(Fig. 5B). Cellular cAMP content increased 45 min
after the addition of CT, and reached a maximum
90–120 min (closed circles). Bafilomycin A1 (closed
triangles) extended the lag phase by 15 min, and
decreased the rate at which CT increased cellular
cAMP content. Pepstatin A (closed squares) was less
effective at inhibiting the initial rate of cAMP pro-
duction, but did reduce the maximal extent of cAMP
production.
A
B
Fig. 3. CT-mediated recruitment of ARF-6 and ADP-ribosylation of
Gsa in hepatic endosomes. (A) Rat liver endosomal (EN), plasma
membrane (PM) and cytosolic (S) fractions were isolated at the
indicated times after the in vivo administration of native CT or
CT-B, and evaluated by western blotting for their content of ARF
and ARF-6 using their respective polyclonal and monoclonal anti-
bodies. Arrows to the right of each panel indicate the mobilities of
immunodetected ARF proteins ( 21 kDa). (B) Endosomal fractions
were isolated at the indicated times after the in vivo administration
of native CT, and immediately incubated with 0.54 l
M [
32
P]NAD at
30 °C in an ADP-ribosylation buffer; this was followed by
SDS ⁄ PAGE and autoradiography. Molecular mass markers are indi-
cated to the left of the panel. The arrow on the right indicates the
mobility of [
32
P]-labeled Gsa ( 45 kDa).
Cytotoxic action of cholera toxin and cathepsin D T. El Hage et al.
2618 FEBS Journal 274 (2007) 2614–2629 ª 2007 The Authors Journal compilation ª 2007 FEBS
Time of incubation (min)
control
control + ATP
cholera toxin
cholera toxin + ATP
diphtheria toxin
diphtheria toxin + ATP
A
30
15
200
400
Fluorescence Intensity (A.U.)
Basal Cholera toxin 2 H
Baf-A1
B
No drugs
CT-B subunit + ATP
Fig. 4. Effect of cholera toxin on endosomal acidification. (A) Rat liver endosomal fractions were isolated 2 h after the in vivo administration
of native CT, CT-B or diphtheria toxin (60 lg per 100 g body weight), and incubated in 0.15
M KCl containing 5 mM MgCl
2
,5lM acridine
orange and, when indicated, 5 m
M ATP. The relative decrease in fluorescence intensity was immediately recorded at 37 °C for 30 min using
a recording spectrofluorometer. Results are expressed as arbitrary units of fluorescence intensity. Baseline fluorescence at zero time was
284.63 ± 7.41 (– ATP) and 422.97 ± 1.79 (+ ATP). (B) HepG2 hepatoma cells were incubated at 37 °C for 30 min with or without bafilomy-
cin A1 (0.2 l
M), and this was followed by the addition of CT (1.3 lM) or buffer alone for an additional 2 h. The acidic compartments were
visualized by immunofluorescence using the DAMP method.
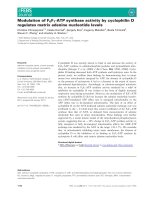
Fig. 5. Role of vesicular acidification and
cathepsin D in cellular cAMP production by
CT. (A) Rats were injected with native CT
(50 lg per 100 g body weight) 1 h after an
intraperitoneal injection of either 12.5%
dimethylsulfoxide, 625 lg pepstatin A
methyl ester (PA) or a mixture of bafilomy-
cin A1 ⁄ folimycin (Bafi ⁄ Foli) (0.75 lg each).
Fifty minutes after CT injection, rats were
killed, hepatic homogenates were prepared,
and cAMP content was measured by radio-
immunoassay. The data were expressed as
pmol cAMP per mG protein. Each histogram
represents the mean ± SD of at least three
independent determinations. (B) HepG2
hepatoma cells were treated with CT
(10 lgÆmL
)1
) and incubated at 37 °C in the
absence (control) or presence of pepstatin A
(120 lgÆmL
)1
) or bafilomycin A1 (0.2 l M) for
the indicated times. Cellular cAMP content
was measured as described for (A), and
the data were expressed as pmolÆ(mG pro-
tein)
)1
. Results are the mean ± SD of three
separate experiments.
T. El Hage et al. Cytotoxic action of cholera toxin and cathepsin D
FEBS Journal 274 (2007) 2614–2629 ª 2007 The Authors Journal compilation ª 2007 FEBS 2619
As pepstatin A treatment produced, both in vivo
and in vitro, a sustained reduction in the cAMP
response to CT, we next evaluated the role of the
pepstatin A-sensitive enzyme cathepsin D in CT cyto-
toxicity by using cathepsin D-deficient 3Y1-Ad12 cells
transfected with the human cathepsin D gene [18].
Immunoblot analysis of equal amounts of protein
from 3Y1-Ad12 cell lysates confirmed the absence of
cathepsin D in nontransfected cells, and the presence
of both the 31 kDa mature cathepsin D and the
45 kDa procathepsin D in cathepsin D-overexpressing
cells (Fig. 6A, lower panel). Measurement of cellular
cAMP levels in 3Y1-Ad12 cells after CT treatment
revealed that cells expressing the transfected gene
were 3–5-fold more sensitive to CT treatment than
were control cells deficient in cathepsin D (Fig. 6A,
upper panel). To strengthen the possibility of a direct
action of cathepsin D in CT cytotoxicity, cAMP
assays were performed with MCF-7 cells whose
endogenous cathepsin D expression was inhibited
by small RNA-mediated gene silencing (cathepsin D
siRNA) (Fig. 6B). A progressive decrease in expres-
sion of both procathepsin D and mature cathepsin D
was observed in MCF-7 cells 48–72 h after transfec-
tion with cathepsin D siRNA (Fig. 6B, lower panel).
On the basis of cellular cAMP levels, transfected
MCF-7 cells were 4-fold less effective in responding
to CT treatment as compared to nontransfected
MCF-7 cells (Fig. 6B, upper panel), supporting the
notion that cathepsin D might play a crucial role in
CT activation and action in hepatic cells as well as in
other cell types.
BA
Fig. 6. Relationship between cathepsin D expression and cellular cAMP response to CT. (A) Rat embryonic 3Y1-Ad12 tumor cells expressing
either no cathepsin D (control cells, open histograms) or overexpressing human wild-type cathepsin D (3Y1-Ad12-CD, closed histograms)
were incubated with CT (1.3 l
M) for 2 h. Cellular cAMP content was measured, and expressed as fold stimulation over basal (unstimulated)
activity [6 pmolÆ(mG protein)
)1
] (upper panel). Results are the mean ± SD of three separate experiments. Whole cell lysates (60 lg of protein
per lane) were evaluated by immunoblotting for their content of human cathepsin D (lower panel). Arrows on the right indicate the mobility
of procathepsin D ( 45 kDa) and mature cathepsin D ( 31 kDa). (B) MCF-7 cells, whose cathepsin D expression was inhibited by siRNA
silencing for 48–72 h, were incubated with CT (1.3 l
M) for 2 h. Cellular cAMP content was measured and expressed as fold stimulation over
basal (unstimulated) activity [ 28 pmolÆ (mG protein)
)1
] (upper panel). Results are the mean ± SD of three separate experiments. Whole cell
lysates (60 lg of protein per lane) were evaluated by immunoblotting for their content of human cathepsin D (lower panel). Arrows on the
right indicate the mobility of procathepsin D ( 45 kDa) and mature cathepsin D ( 31 kDa).
Cytotoxic action of cholera toxin and cathepsin D T. El Hage et al.
2620 FEBS Journal 274 (2007) 2614–2629 ª 2007 The Authors Journal compilation ª 2007 FEBS
Assessment of the KDEL peptide integrity
of endosomal CT-A
The results presented thus far established that CT-A
represented a high-affinity substrate for endosomal
cathepsin D that assisted in the release of CT-A frag-
ment(s) that are active towards Gs a. However, the
endosomal degradative CT-A fragment(s) remained
undefined, and it was unknown whether the processed
form(s) of internalized CT-A had lost part or all of its
C-terminal ER-retention KDEL motif.
To investigate this, we characterized three polyclonal
antibodies to KDEL for their specificity towards CT-A
by western blot analysis of pure CT or CT-A
(Fig. 7A). Each antibody revealed a specificity for
CT-A, with the antibody to KAVKKDEL revealing
the highest affinity. Therefore, the antibody to
KAVKKDEL was used to assess the presence of the
KDEL peptide in the internalized CT-A. No percep-
tible KDEL immunoreactivity was detected in rat liver
endosomal fractions isolated 5–90 min post-CT injec-
tion (Fig. 7B), suggesting that the integrity of the
C-terminal KDEL peptide was rapidly lost during CT
endocytosis.
We have previously identified a 25 kDa endosomal
CT-A fragment, which we postulated might be
involved in the ADP-ribosylation of Gsa [7]. The
25 kDa fragment was consistently observed in endo-
somal hydrolysates of CT obtained at acidic pH, and
was strictly cathepsin D-dependent; its detection coin-
cided with
32
P-labeling of Gsa by CT hydrolysates at
acidic pH [7]. Consequently, we examined whether,
under conditions where a 25 kDa CT-A fragment was
generated by endosomal cathepsin D, we would
observe a corresponding loss of the C-terminal KDEL
peptide (Fig. 7C). Indeed, whereas rapid production of
α-CT α-KSEKKDEL α-KX
5
KDEL α-KAVKKDEL
CT-A
(28-kDa)
CT-B
(12-kDa)
CT CT-A CT CT-A CT CT-A CT CT-A
A
α-KAVKKDEL
CT-A
(28-kDa)
CT-B
(12-kDa)
0 5 15 30 60 90
CT
B
α-CT
0 5 15 30 60 90
CT
α-KAVKKDELα-CT
CT-A
(28-kDa)
CT-B
(12-kDa)
–
45
4
pH–
–3030
60 Time of incubation (min)
–
C
Fig. 7. Metabolic fate of the KDEL peptide during endosomal proteolysis of internalized CT. (A) Polyclonal sera against CT or KDEL peptides
were assessed by western blotting for their ability to bind specifically to CT-A. Each lane contained 1 lg of CT-A or 5 lg of CT. Arrows to
the left indicate the mobilities of CT-A ( 28 kDa) and CT-B ( 12 kDa). Each antibody to KDEL showed specificity for CT-A. Polyclonal anti-
serum to CT bound to both subunits. (B) Rat liver endosomal fractions were isolated at the indicated times after the in vivo administration of
CT, and evaluated by western blotting for their immunoreactivity using polyclonal antiserum to synthetic peptide KAVKKDEL (a-KAVKKDEL)
or polyclonal IgG against CT (a-CT) (incubation with the same membrane). Fifty micrograms of protein was applied to each lane. Arrows to
the left indicate the mobilities of CT-A ( 28 kDa) and CT-B ( 12 kDa). (C) Endosomal fractions were incubated with 10 lg of native CT at
37 °C for the indicated times in 30 m
M citrate ⁄ phosphate buffer at the indicated pH. The incubation mixtures were then analyzed by western
blotting using polyclonal antibody to CT (left panel) or polyclonal antibody to KAVKKDEL (right panel). The mobilities of each intact CT subunit
are indicated on the left (CT-A, 28 kDa; CT-B, 12 kDa). A major 25 kDa CT-A fragment was evident after 30 min of incubation, but was
not recognized by the antibody to KDEL.
T. El Hage et al. Cytotoxic action of cholera toxin and cathepsin D
FEBS Journal 274 (2007) 2614–2629 ª 2007 The Authors Journal compilation ª 2007 FEBS 2621
a 25 kDa product of CT-A was evident following pro-
teolysis of CT at acidic pH (Fig. 7C, left panel), no
detectable KDEL immunoreactivity was associated
with this degradative CT-A product (Fig. 7C, right
panel).
Discussion
In the present study, we show that rat hepatocytes dis-
play endosomally located mechanisms to regulate CT
activation and action. Two of these regulatory mecha-
nisms may be at the level of intraendosomal toxin pro-
teolysis and endosome acidification (Fig. 8). The
assessment of CT compartmentalization during its
endocytosis into rat liver has revealed specific in vivo
regulation during the early phase (0–60 min) of toxin
internalization. First, a complex of activated CT-A,
cointernalized Gsa and recruited ARF proteins was
observed in endosomes 5–30 min postinjection. Sec-
ond, efficient ADP-ribosylation of the cointernalized
Gsa proteins occurred at the endosomal locus after a
lag phase of 30 min. Third, CT-mediated hyperacidifi-
cation of endosomes increased over a time course sim-
ilar to that of endosomal activation of CT. Therefore,
we propose that endosome regulation would serve as
an effective amplification mechanism for promoting
CT and cathepsin D interaction to induce a maximal
cytotoxic effect (Fig. 8). Finally, using in vitro cellular
systems, we have obtained evidence that the cAMP
response in CT-treated cells was, at least in part, rela-
ted to the proteolytic activity and expression level of
the aspartic acid protease cathepsin D (Fig. 8). How-
ever, internalized CT that has been localized within the
ER in murine hepatocyte BNL CL.2 cells [19] may
also follow another activating pathway operating at a
late stage of endocytosis and requiring retrograde
transport.
Although G proteins are widely accepted as media-
tors of signal transduction by cell surface receptors,
several lines of evidence now indicate that trimeric
G proteins are located in the endosomal compartment
of various cells and are involved in vesicular transport
events through the endocytic pathway [20]. Consistent
with previous studies [21,22], similar amounts of two
Fig. 8. Endosomal regulation of CT activation and action in rat liver.
Cytotoxic action of cholera toxin and cathepsin D T. El Hage et al.
2622 FEBS Journal 274 (2007) 2614–2629 ª 2007 The Authors Journal compilation ª 2007 FEBS
forms of Gsa, with apparent molecular masses of
47 kDa (large form, Gsa-L) and 45 kDa (small form,
Gsa-S), have been identified in our endosomal frac-
tions isolated from noninjected rats. These isoforms
are produced by alternative splicing of a single precur-
sor mRNA [23].
The translocation of G proteins from the plasma
membrane to the endosomal apparatus has been demon-
strated biochemically and morphologically in various
cells stimulated by agonists such as glucagon [21], iso-
proterenol [24], carbachol [25], thyrotropin-releasing
hormone [26] and bradykinin [27]. Our studies extend
these observations to CT, for which maximal endosomal
association of Gsa was observed 20 min (native CT) or
30 min (CT-B) postinjection. The underlying mecha-
nisms involved in CT-induced endosomal translocation
of Gsa may well originate in target lipid rafts at the cell
surface, which show significant enrichment of stimula-
tory and inhibitory G protein and predominant localiza-
tion of the endogenous CT receptor ganglioside GM1
[28,29]. This would facilitate interactions between CT,
GM1 and Gsa and, potentially, their subsequent coin-
ternalization. Alternatively CT, which increases the
endosomal content of fluid-phase endocytosis probes in
rat liver [30], might induce the uptake of various plasma
membrane molecules, such as its own cellular protein
target Gsa, into the endocytic pathway.
Our data suggest a direct interaction between activa-
ted CT-A and Gsa in the endosomal membrane. It has
clearly been shown that the endosomal acidic pH faci-
litates the membrane insertion and penetration of
intact CT-A and ⁄ or activated CT-A fragment(s) across
the endosomal membrane. Using the lipid bilayer mat-
rix containing ganglioside GM1, fluorescence and
phosphorescence spectroscopy studies have shown that
upon CT binding to GM1, CT-A faces the membrane
surface but does not significantly penetrate into the
hydrophobic core of the bilayer at neutral pH [31,32].
However, CT-A1 peptide released from CT-A2 peptide
exhibits hydrophobic behavior in aqueous solution and
when membrane-bound, suggesting that free CT-A1
peptide or CT-A fragment may partition spontane-
ously into the hydrophobic core of the endosomal
membrane. Fluorescence resonance energy transfer,
used to monitor pH-dependent structural changes in
CT-B, has revealed that the low endosomal pH is cap-
able of inducing structural changes in CT, which, in
turn, exerts its effect on the structure of the membrane
to which CT-B is bound [33]. The role of endosomal
acidity in facilitating CT-A translocation across the
endosomal membrane has also been demonstrated
using hepatic endosomes isolated after injection of
native CT, and then examined for their ability to bind
antibodies to CT-A and to stimulate exogenous plasma
membrane-associated adenylate cyclase [6]. Time- and
acid-dependent exteriorization of CT-A was observed
with no translocation of CT-B [6]. These findings
would be consistent with a model in which CT mark-
edly increases endosomal acidification rates (this study)
[13], to allow maximal insertion of activated CT-A into
the endosomal membrane, leading to efficient ADP-
ribosylation of cointernalized Gsa.
The enzymatic activity of CT-A1 is allosterically sti-
mulated by ARFs, which are host-cell small GTP-
binding proteins active in the GTP-bound form [34].
On the basis of the reconstitution of a signal transduc-
tion pathway in a bacterial two-hybrid system, a direct
interaction between human ARF-6 (belonging to the
class III ARFs) and CT-A1 was demonstrated [34].
Recently, the cocrystallization of CT and ARF-6 has
defined the structural basis for activation of CT by
human ARF-6 [35]. However, inhibition of the ARF-6
pathway had minimal effects on CT entry, intracellular
CT transport, and CT-induced activation of adenylate
cyclase [36]. Although the CT–ARF interaction has
been extensively characterized in vitro, little is known
about their in vivo interaction, and the subcellular
binding site(s) between CT and ARF-6 remain(s) unde-
fined. Originally, ARF-6 was thought to be an uncon-
ventional member of the ARF family that was found
exclusively in the plasma membrane of Chinese ham-
ster ovary cells [37]. However, assessment of the sub-
cellular distribution of endogenous ARF-6 in various
other tissues and cells has established both a cytosolic
and membrane-bound localization [38], and over-
expressed ARF-6 has been localized to the plasma
membrane and endosomes [39]. In the present study,
we demonstrate the existence of an endosomal pool of
ARFs whose amount was strongly increased after CT
treatment. ARF-6 was undetectable in endosomes pre-
pared from untreated rats, but its endosomal recruit-
ment was rapidly observed after CT injection.
Recently, it was shown that V-ATPase-dependent
endosomal acidification stimulates the recruitment of
ARF-6 from proximal tubule cytosol to endosomal
membranes, implicating this process in endosomal
function in situ [40]. However, the precise functional
role of endosomal ARF-6 in the full activation of
internalized CT-A remains to be determined.
Subcellular fractionation techniques used to assess
the in vivo localization of [
125
I]CT uptake into rat liver
have previously shown that some radioactivity (30 min
to 2 h postinjection) is intrinsic to acid-phosphatase-
containing structures, presumably lysosomes [4]. Using
the in situ rat liver model system for endosome–
lysosome fusion, we have confirmed a low lysosomal
T. El Hage et al. Cytotoxic action of cholera toxin and cathepsin D
FEBS Journal 274 (2007) 2614–2629 ª 2007 The Authors Journal compilation ª 2007 FEBS 2623
transfer of internalized native CT-B, which was accom-
panied by a sustained transfer of Gsa, the CT sub-
strate. The endolysosomal transfer of CT-B was also
accompanied by a net decrease in its immunoreactivity
throughout the gradient, suggesting that CT-B is pro-
teolyzed in the endosomal apparatus (this study) [7], as
well as within lysosomal vesicles. Despite the fact that
the catalytic CT-A was below the limits of detection in
our fusion system, the massive cotransfer of Gsa to
lysosomes observed in response to CT injection sug-
gests that extended ADP-ribosylation of Gsa may also
occur in vivo at the locus of the lysosomal apparatus.
Weak bases and proton ionophores have been used
in vivo and in vitro to study the role of organelle
acidification in the cytotoxic action of CT [5,6]. Using
isolated rat hepatocytes, it has been shown that
chloroquine inhibits the ability of CT to activate
adenylate cyclase, and that a similar effect occurs with
monensin [5]. In addition, both drugs comparably
inhibited generation of the CT-A1 peptide. In rat liver,
chloroquine accumulates in hepatic endosomes, leading
to an increase in the lag phase for activation of adeny-
late cyclase by CT and a decrease of 3–10-fold in the
apparent affinity of the toxin for the enzyme [6]. More-
over, both chloroquine and monensin interfered with
the ATP-dependent intraendosomal degradation of
internalized radioactive CT [6]. Recently, we have
identified an endosomal aspartic acid protease, cathep-
sin D, that binds specifically to endocytosed CT at aci-
dic pH and generates degradative CT fragments
displaying ADP-ribosyltransferase activity towards
exogenous Gsa [7]. This would suggest that within
hepatocytes, vacuolar acidification participates in the
activation and action of CT, and our present study is
consistent with this view.
Considering the nonacidotropic effects of chloro-
quine [41], we showed that bafilomycin, a macrolide
antibiotic that specifically inhibits vacuolar ATPase
at concentrations up to 1 lm, similarly affected CT
action in hepatocytes. This decrease in vacuolar acidifi-
cation was accompanied both in vivo and in vitro by a
corresponding reduction in the cAMP response of hep-
atic cells to CT. Finally, we have shown here that
expression of cathepsin D in the cathepsin D-deficient
3Y1-Ad12 cell line led to an increase in CT action,
whereas siRNA of cathepsin D in MCF-7 cells reduced
CT sensitivity. Our data, together with previous studies
[7], assign an important role to endosomal acidic cath-
epsin D in promoting the cytotoxic action of CT, most
probably through the removal of C-terminal residues
of CT-A1 encompassing the terminal KDEL peptide.
Our in vivo and in vitro studies with hepatocytes are in
marked contrast to in vitro studies using other cellular
models, where acidotropic drugs and V-ATPase inhibi-
tors had little to no effect on the cytotoxic action of
CT [42,43]. This may be a reflection of the differences
between hepatocytes and other cell types.
Previous studies using rat liver have shown that CT
markedly alters several aspects of fluid-phase endo-
cytosis: it increases rates of endosome acidification
without altering ion conductances, and leads to a more
acidic steady-state intraendosomal pH, persistence of
Na
+
⁄ H
+
exchange in late endosomes, and changes in
endosome trafficking [13,30]. In contrast, CT had no
significant effect on lysosome acidification rates and
steady-state internal pH, indicating that CT predomin-
antly altered the earlier steps of endocytosis [44]. How-
ever, the effects of CT on endosome acidification were
demonstrated at a late exposure time, with animals
receiving CT intraperitoneally 16 h prior to endosome
preparation [13]. Our estimate of the rate of endosom-
al acidification, which increased two-fold after CT
treatment, compared favorably with these previous
reports [13,30]. Moreover, we provide three supple-
mental observations: (a) endosomal acidification rates
were significantly increased 2 h post-CT treatment,
which coincided with the presence of internalized CT
within endocytic vesicles; (b) endosome acidification
rates were unaffected by diphtheria toxin and free
CT-B, which confirmed the potential role of cAMP in
mediating the effects of CT on endosome acidification
[13]; and (c) the effects of CT were not observed when
endosome acidification was measured in the absence of
ATP, possibly due to a direct effect(s) of CT and ⁄ or
cAMP on the activity and ⁄ or abundance of the endo-
somal H
+
pump. The effects of CT on endosomal aci-
dification are likely to be mediated, at least in part, by
increased intracellular cAMP. Thus, the effects of CT
were reproduced by direct administration to perfused
livers of dibutyryl cAMP [13] or by intraperitoneal
injection of pertussis toxin to rats, which increased
liver cAMP significantly [13]. In contrast, in vivo
administration of diphtheria toxin (which does not
modify the intracellular cAMP level) or CT-B (for
which cytotoxic activity is nonexistent) had no effect
on endosome acidification. Also, it is possible that CT
causes an activation of the vacuolar H
+
-pump and ⁄ or
Cl
–
transport, as well as changes in the remodeling and
maturation of early endocytic vesicles in response to
cAMP [13]. Finally, our findings would be consistent
with a model in which CT induced an increase in the
number of H
+
-ATPase pumps per endosome and ⁄ or
redistribution of vacuolar H
+
-pumps. Whatever the
precise signal transduction mechanism responsible for
CT increasing endosome H
+
transport, our data sug-
gest that the more acidic pH of endocytic vesicles at
Cytotoxic action of cholera toxin and cathepsin D T. El Hage et al.
2624 FEBS Journal 274 (2007) 2614–2629 ª 2007 The Authors Journal compilation ª 2007 FEBS
an early stage may be part of the toxic action of CT,
facilitating the proteolytic activation of CT-A by cath-
epsin D, and its subsequent translocation across the
endosomal membrane, both of which require an acidic
pH [5,6].
Although suggesting that it is the CT–CT receptor
complex that is internalized to the endolysosomal
apparatus of hepatocytes, our studies described here
provide no direct information on the nature and fate of
the CT receptor. Using an in vivo biochemical approach
similar to that used to study the hepatic fate of CT (this
study) [7], studies are currently underway to elucidate
whether the CT receptor is rapidly and specifically
internalized with its ligand to low-density endosomes.
Experimental procedures
Peptides, antibodies, protein determination,
enzyme assays and materials
CT-A and CT-B, native CT, acridine orange and pepsta-
tin A were purchased from Sigma (St Louis, MO, USA). A
nontoxic diphtheria toxin CRM 197 mutant and bafilomy-
cin-A1 were obtained from Calbiochem (San Diego, CA,
USA). Rabbit polyclonal anti-(CT C3062) was obtained
from Sigma. Rabbit polyclonal IgG directed against Gsa
proteins was obtained from NEN. Rabbit anti-(mouse
cathepsin D R291) [7] was obtained from J. S. Mort
(Shriners Hospital for Crippled Children, Montreal,
Quebec, Canada). Rabbit polyclonal IgG broadly reactive
with ARF family proteins, mouse monoclonal IgG directed
against full-length ARF-6 and goat polyclonal IgG directed
against the C-terminus of rat cathepsin D were purchased
from Santa Cruz Biotechnology, Inc. (Santa Cruz, CA,
USA). Mouse monoclonal antibody directed against the
rat early endosome antigen 1 (EEA1) was purchased from
Transduction Laboratories. Rabbit polyclonal antibodies
against KAVKKDEL, KSEKKDEL or KXXXXXKDEL,
which recognize the ER retention signal KDEL and bind to
various ER-resident proteins, were obtained from S. Fuller
(EMBL, Heidelberg, Germany). Fluorescein isothiocyanate-
conjugated rabbit polyclonal IgG to dinitrophenyl-KLH
was obtained from Molecular Probes. Horseradish peroxi-
dase-conjugated goat anti-(rabbit) IgG and anti-(mouse)
IgG were obtained from Bio-Rad (Hercules, CA, USA).
The protein content of isolated fractions was determined by
the method of Lowry et al. [45]. Galactosyltransferase was
assayed as described by Beaufay et al. [46]. Acid phospha-
tase was assayed as described by Trouet [47]. Nitrocellulose
membranes and Enhanced ChemiLuminescence detection
kit were obtained from Amersham. Nycodenz was obtained
from Nycomed Pharma. DAMP was obtained from
Molecular Probes. All other chemicals were obtained from
commercial sources and were of reagent grade.
Animals and injections
In vivo procedures were approved by the institutional com-
mittee for use and care of experimental animals. Male Spra-
gue-Dawley rats, body weight 180–200 g, were obtained
from Charles River France (St Aubin Les Elbeufs, France)
and were fasted for 18 h prior to being killed. Native CT,
CT-B or diphtheria toxin (50 lg per 100 g body weight) in
0.4 mL of 0.15 m NaCl was injected within 5 s into the
penile vein under light anesthesia with ether.
Isolation of subcellular fractions from rat liver
Subcellular fractionation was performed using established
procedures [7]. Following injection of toxins, rats were killed,
and the livers were rapidly removed and minced in isotonic
ice-cold homogenization buffer as previously described [7].
Rat liver cytosolic fraction was isolated by differential
centrifugation as previously described [48–50]. The plasma
membrane fraction was isolated from the nuclear fraction
as described by Hubbard et al. [51]. The endosomal fraction
was isolated by discontinuous sucrose gradient centrifuga-
tion, and collected at the 0.25–1.0 m sucrose interface
[7,17,48–50]. The soluble endosomal extract was isolated
from the endosomal fraction by freeze–thawing in 5 mm
sodium phosphate (pH 7.4), disrupted in the same hypo-
tonic medium using a small Dounce homogenizer (15
strokes with a Type A pestle), and centrifuged at 150 000 g
for 60 min in a Beckman 70.1 Ti rotor as previously des-
cribed [7,17,48–50].
In vitro endosome–lysosome transfer reaction
The cell-free endosome–lysosome transfer of in vivo internali-
zed CT and Gsa was performed as described previously
[21,52,53]. The postmitochondrial supernatant (referred to as
the LPS fraction) was incubated for 60–90 min at 4 °Cor
37 °C with 5 mm ATP, 1 mgÆmL
)1
creatine kinase, and
20 mm phosphocreatine. After cooling to 4 °C, incubation
mixtures were subjected to centrifugation on linear Nycodenz
gradients at 200 000 g for 60 min in a Beckman SW41 rotor
as described previously [21,52,53]. The distribution of CT,
Gsa and enzyme activities was determined, and components
appearing at densities 1.065–1.11 and 1.11–1.145 gÆmL
)1
were scored as endosomal and lysosomal, respectively.
Immunoblot analysis
Electrophoresed samples were transferred onto nitrocellu-
lose membranes for 60 min at 380 mA in transfer buffer
containing 25 mm Tris base and 192 mm glycine. The mem-
branes were blocked by a 3 h incubation with 5% skimmed
milk in 10 mm Tris ⁄ HCl (pH 7.5), 300 mm NaCl, and
0.05% Tween-20. The membranes were then incubated with
primary antibody [rabbit polyclonal serum against native
T. El Hage et al. Cytotoxic action of cholera toxin and cathepsin D
FEBS Journal 274 (2007) 2614–2629 ª 2007 The Authors Journal compilation ª 2007 FEBS 2625
CT C3062 (diluted 1 : 60 000), KAVKKDEL (diluted
1 : 100), KSEKKDEL (diluted 1 : 100), KXXXXXKDEL
(diluted 1 : 100), affinity-purified rabbit polyclonal IgG
against human ARF-1 (diluted 1 : 400) and Gsa (diluted
1 : 10 000) and mouse monoclonal IgG against human
ARF-6 (diluted 1 : 100)] in the above buffer for 16 h at
4 °C. The blots were then washed three times with 0.5%
skimmed milk in 10 mm Tris ⁄ HCl (pH 7.5), 300 mm NaCl
and 0.05% Tween-20 over a period of 1 h at room tem-
perature. The bound immunoglobulin was detected using
horseradish peroxidase-conjugated goat anti-(rabbit) IgG.
CT-catalyzed ADP-ribosylation
Hepatic endosomal fractions were prepared from CT-injected
rats. The endosomal fractions ( 50 lg) were then suspended
in an ADP-ribosylation buffer containing 0.54 lm
[
32
P]NAD, 50 mm sodium phosphate buffer (pH 7.2),
0.5 mm GTP, 1 mm ATP, 5 mm MgCl
2
, and 10 mm thymi-
dine, and incubated at 30 °C for 45 min. The reaction was
stopped by the addition of Laemmli sample buffer [54], and
this was followed by SDS ⁄ PAGE and autoradiography.
Cell-free assay for ATP-dependent endosomal
acidification
ATP-dependent acidification of isolated endosomes was
assayed using acridine orange, a membrane-permeable lipo-
philic weak base that accumulates in acidic organelles [15].
Hepatic endosomes isolated after injection of native cholera
or diphtheria toxins (120 lg) were incubated in 0.15 m
KCl, 5 mm MgCl
2
,5lm acridine orange and, when indica-
ted, 5 mm ATP. These suspensions were immediately placed
in the spectrofluorometer, and fluorescence intensities were
recorded at 37 °C for 1–30 min.
cAMP assays
Following injection of native CT, rats were sacrificed at
50 min and livers were rapidly removed and minced in
cold ethanol containing 1 mm isobutylmethylxanthine
(40 mL per liver). For some experiments, rats received an
intraperitoneal injection of pepstatin A methyl ester
(62.5 lg), bafilomycin-A1 ⁄ folimycin (0.75 lg each) or
solvent (dimethylsulfoxide) 1 h prior to injection of CT.
Livers were homogenized on ice for 1 min using a Poly-
tron, frozen in liquid N
2
, thawed at 21 °C three times,
and then centrifuged at 25 000 g for 20 min at 4 °C.
Supernatants were dried using a Speedvac and then dis-
solved in cAMP assay buffer. The cAMP present in the
samples was measured by radioimmunoassay as previously
described [13]. Protein concentration was determined in
parallel, and data were expressed as pmol cAMP per
mG protein.
For other experiments, hepatoma HepG2 cells were pre-
incubated with 1 mm isobutylmethylxanthine for 30 min.
The medium was then supplemented with CT (10 lgÆmL
)1
)
and incubated for 15 min to 2 h with or without pep-
statin A methyl ester (120 lgÆmL
)1
) or bafilomycin A1
(0.2 lm). Control cells received 2% dimethylsulfoxide only.
At the end of the incubation, the medium was removed,
cells were lysed with 1 m perchloric acid, and cAMP was
measured as above [13].
Cell culture
Human hepatoma (HepG2) cells were grown in DMEM
supplemented with 10% (v ⁄ v) fetal bovine serum and 1%
penicillin ⁄ streptomycin in an atmosphere of 95% air ⁄ 5%
CO
2
[55]. The human breast carcinoma cell line MCF-7
was grown in DMEM supplemented with 10% (v ⁄ v) fetal
bovine serum in an atmosphere of 90% air ⁄ 10% CO
2
[56].
Cathepsin D-transfected 3Y1-Ad12 carcinoma cells were
grown in RPMI medium supplemented with 5% fetal
bovine serum, 400 lgÆmL
)1
G418 and 50 lgÆmL
)1
gentami-
cin in an atmosphere of 95% air ⁄ 5% CO
2
[18].
Transfection and RNA interference
Cathepsin D siRNA and control siRNA were synthesized
by Eurogentec (Seraing, Belgium). The siRNA sequence for
human cathepsin D has been previously described [57].
MCF-7 cells were grown in six-well plates for 3 days, and
then transiently transfected with 2 lg of siRNA using 8 lL
of Oligofectamine (Invitrogen, Carlsbad, CA, USA). Cells
were then incubated for 4 h at 37 °C prior to the addition
of 5% fetal bovine serum. Cells were harvested 48–72 h
post-transfection, and subjected to western blot analysis (to
monitor cathepsin D expression levels) and cAMP assays.
Immunofluorescence
The acidic compartments in hepatoma HepG2 cells were
visualized by immunofluorescence using the DAMP method
[41]. Cells grown on glass coverslips were washed twice with
NaCl ⁄ P
i
before incubation at 37 °C for 30 min with serum-
free DMEM in the presence or absence of 0.2 lm bafilo-
mycin A1. Cells were then treated with CT (1.3 lm)or
buffer alone for 2 h, and this was followed by the addition
of DAMP (30 lm) for 30 min. Cells were then washed three
times with NaCl ⁄ P
i
, and fixed with 3% paraformaldehyde
in NaCl ⁄ P
i
for 20 min. Fixed cells were treated with 50 mm
NH
4
Cl for 15 min, washed with NaCl ⁄ P
i
, and permeabi-
lized with 0.1% Triton X-100 in NaCl ⁄ P
i
for 4 min and
0.5% saponine in NaCl ⁄ P
i
for 10 min. Permeabilized cells
were blocked for 20 min with 10% horse serum in NaCl ⁄ P
i
,
and then incubated for 60 min with a rabbit polyclonal
anti-dinitrophenyl fluorescein conjugate (1 : 100 dilution).
Cytotoxic action of cholera toxin and cathepsin D T. El Hage et al.
2626 FEBS Journal 274 (2007) 2614–2629 ª 2007 The Authors Journal compilation ª 2007 FEBS
Laser-scanning confocal microscopy was performed using a
Zeiss LSM 510 confocal (Axiovert 100 m) inverted micro-
scope equiped with a Zeiss X63 ⁄ 1.4 NA oil immersion
objective lens (plan-Apochromat).
Acknowledgements
We thank Pamela H. Cameron (McGill University,
Montreal, Quebec, Canada) for reviewing the manu-
script and assistance in these studies. We thank
Dr F. Nato (Institut Pasteur, Paris, France) for the
kind gift of monoclonal antibodies to CT, Dr V. Nico-
las (IFR 75 INSERM, Faculte
´
de Pharmacie, Chaˆ te-
nay-Malabry, France) for assistance with confocal
microscopy, Dr C. Rouyer-Fessard (INSERM U773,
Faculte
´
de Me
´
decine Xavier Bichat, Paris, France) for
assistance with cAMP assays, and Drs M. Garcia and
H. Rochefort (INSERM U540, Universite
´
de Montpel-
lier, Paris, France) for the gift of 3Y1-Ad12 cells over-
expressing cathepsin D.
References
1 Lencer WI (2001) Microbes and microbial toxins: para-
digms for microbial-mucosal toxins. V. Cholera: inva-
sion of the intestinal epithelial barrier by a stably folded
protein toxin. Am J Physiol 280, G781–G786.
2 Sandvig K & Van Deurs B (2002) Membrane traffic
exploited by protein toxins. Annu Rev Cell Dev Biol 18,
1–24.
3 Houslay MD & Elliott KRF (1981) Is the receptor-
mediated endocytosis of cholera toxin a pre-requisite for
its activation of adenylate cyclase in intact rat hepato-
cytes? FEBS Lett 128, 289–292.
4 Janicot M & Desbuquois B (1987) Fate of injected
125
I-labeled cholera toxin taken up by rat liver in vivo.
Eur J Biochem 163, 433–442.
5 Janicot M, Clot JP & Desbuquois B (1988) Interactions
of cholera toxin with isolated hepatocytes. Biochem J
253, 735–743.
6 Janicot M, Fouque F & Desbuquois B (1991) Activa-
tion of rat liver adenylate cyclase by cholera toxin
requires toxin internalization and processing in endo-
somes. J Biol Chem 266, 12858–12865.
7 Merlen C, Fayol-Messaoudi D, Fabrega S, El Hage T,
Servin A & Authier F (2005) Proteolytic activation of
internalized cholera toxin within hepatic endosomes by
cathepsin D. FEBS J 272, 4385–4397.
8 Hazes B & Read RJ (1997) Accumulating evidence sug-
gests that several AB-toxins subvert the endoplasmic
reticulum-associated protein degradation pathway to
enter target cells. Biochemistry 36, 11051–11054.
9 Rodighiero C, Tsai B, Rapoport TA & Lencer WI
(2002) Role of ubiquitination in retro-translocation of
cholera toxin and escape of cytosolic degradation.
EMBO Rep 3, 1222–1227.
10 Cieplak W, Mead DJ, Messer RJ & Grant CC (1995)
Site-directed mutagenic alteration of potential active-site
residues of the A subunit of Escherichia coli heat-labile
enterotoxin. Evidence for a catalytic role for glutamic
acid 112. J Biol Chem 270, 30545–30550.
11 Lencer WI, Constable C, Moe S, Jobling MG, Webb
HM, Ruston S, Madara JL, Hirst TR & Holmes RK
(1995) Targeting of cholera toxin and Escherichia coli
heat labile toxin in polarized epithelia: role of COOH-
terminal KDEL. J Cell Biol 131, 951–962.
12 Teter K, Jobling MG, Sentz D & Holmes RK (2006)
The cholera toxin A1 (3) subdomain is essential for
interaction with ADP-ribosylation factor 6 and full
toxic activity but is not required for translocation from
the endoplasmic reticulum to the cytosol. Infect Immun
74, 2259–2267.
13 Van Dyke RW (1997) Cholera and pertussis toxins
increase acidification of endocytic vesicles without alter-
ing ion conductances. Am J Physiol 272, C1123–C1133.
14 Van Dyke RW, Hornick CA, Belcher J, Scharschmidt
BF & Havel RJ (1985) Identification and characteriza-
tion of ATP-dependent proton transport by rat liver
multivesicular bodies. J Biol Chem 260, 11021–11026.
15 Authier F & Desbuquois B (1991) Degradation of glu-
cagon in isolated liver endosomes. Biochem J 280,
211–218.
16 Mellman I, Fuchs R & Helenius A (1986) Acidification
of the endocytic and exocytic pathways. Ann Rev Bio-
chem 55, 663–700.
17 Authier F, Me
´
tioui M, Fabrega S, Kouach M & Briand
G (2002) Endosomal proteolysis of internalized insulin
at the C-terminal region of the B chain by cathepsin D.
J Biol Chem 277, 9437–9446.
18 Liaudet E, Garcia M & Rochefort H (1994) Cathepsin
D maturation and its stimulatory effect on metastasis
are prevented by addition of KDEL retention signal.
Oncogene 9, 1145–1154.
19 Henley JR, Krueger EW, Oswald BJ & McNiven MA
(1998) Dynamin-mediated internalization of caveolae.
J Cell Biol 141, 85–99.
20 Svoboda P & Novotny J (2002) Hormone-induced sub-
cellular redistribution of trimeric G proteins. Cell Mol
Life Sci 59 , 501–512.
21 Merlen C, Fabrega S, Desbuquois B, Unson CG &
Authier F (2006) Glucagon-mediated internalization of
serine-phosphorylated glucagon receptor and Gsa in rat
liver. FEBS Lett 580, 5697–5704.
22 Van Dyke RW (2004) Heterotrimeric G protein sub-
units are located on rat liver endosomes.
BMC Physiol
4, 1–16.
23 Yagami T, Kirita S, Matsushita A, Kawasaki K &
Mizushima Y (1994) Alterations in the stimulatory G
T. El Hage et al. Cytotoxic action of cholera toxin and cathepsin D
FEBS Journal 274 (2007) 2614–2629 ª 2007 The Authors Journal compilation ª 2007 FEBS 2627
protein of the rat liver after partial hepatectomy. Bio-
chim Biophys Acta 1222, 81–87.
24 Wedegaertner PB, Bourne HR & von Zastrow M (1996)
Activation-induced subcellular redistribution of Gs
alpha. Mol Biol Cell 7, 1225–1233.
25 Svoboda P & Milligan G (1994) Agonist-induced trans-
fer of the A rtbtmiss of the guanine-nucleotide-binding
regulatory proteins Gq and G11 and of muscarinic m1
acetylcholine receptors from plasma membranes to a
light-vesicular membrane fraction. Eur J Biochem 224,
455–462.
26 Svoboda P, Kim GD, Grassie MA, Eidne KA &
Milligan G (1996) Thyrotropin-releasing hormone-
induced subcellular redistribution and down-regulation
of G11a: analysis of agonist regulation of coex-
pressed G11a species variants. Mol Pharmacol 49,
646–655.
27 Arthur JM, Collinsworth GP, Gettys TW & Raymond
JR (1999) Agonist-induced translocation of Gq ⁄ 11a
immunoreactivity directly from plasma membrane in
MDCK cells. Am J Physiol 276, F528–F534.
28 Wolf AA, Jobling MG, Wimer-Mackin S, Ferguson-
Maltzman M, Madara JL, Holmes RK & Lencer WI
(1998) Ganglioside structure dictates signal transduction
by cholera toxin and association with caveolae-like
membrane domains in polarized epithelia. J Cell Biol
141, 917–927.
29 Oh P & Schnitzer JE (2001) Segregation of heterotri-
meric G proteins in cell surface microdomains. G(q)
binds caveolin to concentrate in caveolae, whereas G(i)
and G(s) target lipid rafts by default. Mol Biol Cell 12,
685–698.
30 Van Dyke RW (2000) Effect of cholera toxin and cyclic
adenosine monophosphate on fluid-phase endocytosis,
distribution, and trafficking of endosomes in rat liver.
Hepatology 32, 1357–1369.
31 Goins B & Freire E (1985) Lipid phase separations
induced by the association of cholera toxin to phos-
pholipid membranes containing ganglioside GM1. Bio-
chemistry 24, 1791–1797.
32 Goins B & Freire E (1988) Thermal stability and inter-
subunit interactions of cholera toxin in solution and in
association with its cell-surface receptor ganglioside
GM1. Biochemistry 27, 2046–2052.
33 McCann JA, Mertz JA, Czworkowski J & Picking WD
(1997) Conformational changes in cholera toxin B sub-
unit–ganglioside GM1 complexes are elicited by envi-
ronmental pH and evoke changes in membrane
structure. Biochemistry 36, 9169–9178.
34 Jobling MG & Holmes RK (2000) Identification of
motifs in cholera toxin A1 polypeptide that are required
for its interaction with human ADP-ribosylation factor
6 in a bacterial two-hybrid system. Proc Natl Acad Sci
USA 97, 14662–14667.
35 O’Neal CJ, Jobling MG, Holmes RK & Hol WGJ
(2005) Structural basis for the activation of cholera
toxin by human AR6-GTP. Science 309, 1093–1096.
36 Massol RH, Larsen JE, Fujinaga Y, Lencer WI &
Kirchhausen T (2004) Cholera toxin toxicity does not
require functionnal Arf6- and dynamin-dependent endo-
cytic pathways. Mol Biol Cell 15, 3631–3641.
37 Cavenagh MM, Whitney JA, Caroll K, Zhang C,
Boman AC, Rosenwald AG, Melhnan I & Kahn RA
(1996) Intracellular distribution of Arf proteins in mam-
malian cells. Arf6 is uniquely localized to the plasma
membrane. J Biol Chem 271, 21767–21774.
38 Yang CZ, Heimberg H, D’Souza-Schorey C, Mueckler
MM & Stahl PD (1998) Subcellular distribution and
differential expression of endogenous ADP-ribosylation
factor 6 in mammalian cells. J Biol Chem 273,
4006–4011.
39 D’Souza-Schorey C, van Donselaar E, Hsu VW, Yang
C, Stahl PD & Peters PJ (1998) ARF6 targets recycling
vesicles to the plasma membrane: insights from an ultra-
structural investigation. J Cell Biol 140, 603–616.
40 Maranda B, Brown D, Bourgoin S, Casanova JE, Vinay
P, Ausiello DA & Marshansky V (2001) Intra-endo-
somal pH-sensitive recruitment of the Arf-nucleotide
exchange factor ARNO and Arf6 from cytoplasm to
proximal tubule endosomes. J Biol Chem 276,
18540–18550.
41 Balbis A, Baquiran G, Dumas V & Posner BI (2004)
Effect of inhibiting vacuolar acidification on insulin sig-
naling in hepatocytes. J Biol Chem 279, 12777–12785.
42 Orlandi PA, Curran PK & Fishman PH (1993)
Brefeldin A blocks the response of cultured cells to cho-
lera toxin. Implications for intracellular trafficking in
toxin action. J Biol Chem 268, 12010–12016.
43 Lencer WI, Strohmeier G, Moe S, Carlson SL,
Constable CT & Madara JL (1995) Signal transduction
by cholera toxin: processing in vesicular compartments
does not require acidification. Am J Physiol 269,
G548–G557.
44 Van Dyke RW, Ervin LL, Lewis MR & Wang X (2000)
Effect of cholera toxin on rat liver lysosome acidifica-
tion. Biochem Biophys Res Commun 274, 717–721.
45 Lowry OH, Rosebrough NJ, Farr AL & Randall RJ
(1951) Protein measurement with the Folin phenol
reagent. J Biol Chem 193, 265–275.
46 Beaufay H, Amar-Costesec A, Feytmans E, Thine
`
s-
Sempoux D, Wibo M, Robbi M & Berthet J (1974)
Analytical study of microsomes and isolated subcellular
membranes from rat liver. I. Biochemical methods.
J Cell Biol 61 , 188–200.
47 Trouet A (1974) Isolation of modified liver lysosomes.
Methods Enzymol 31, 323–329.
48 Authier F, Rachubinski RA, Posner BI & Bergeron
JJM (1994) Endosomal proteolysis of insulin by an
Cytotoxic action of cholera toxin and cathepsin D T. El Hage et al.
2628 FEBS Journal 274 (2007) 2614–2629 ª 2007 The Authors Journal compilation ª 2007 FEBS
acidic thiol metalloprotease unrelated to insulin-degrad-
ing enzyme. J Biol Chem 269, 3010–3016.
49 Authier F, Mort JS, Bell AW, Posner BI & Bergeron
JJM (1995) Proteolysis of glucagon within hepatic endo-
somes by membrane-associated cathepsins B and D.
J Biol Chem 270, 15798–15807.
50 Authier F, Me
´
tioui M, Bell AW & Mort JS (1999)
Negative regulation of epidermal growth factor signal-
ing by selective proteolytic mechanisms in the endo-
some mediated by cathepsin B. J Biol Chem 274,
33723–33731.
51 Hubbard AL, Wall DA & Ma A (1983) Isolation of rat
hepatocyte plasma membranes. 1. Presence of three
major domains. J Cell Biol 96, 217–229.
52 Chauvet G, Tahiri K, Authier F & Desbuquois B
(1998) Endosome–lysosome transfer of insulin and
glucagon in a liver cell-free system. Eur J Biochem 254,
527–537.
53 Authier F & Chauvet G (1999) In vitro endosome–
lysosome transfer of dephosphorylated EGF receptor
and Shc in rat liver. FEBS Lett 461, 25–31.
54 Laemmli UK (1970) Cleavage of structural proteins
during the assembly of the head of bacteriophage T4.
Nature 227, 680–685.
55 Authier F, Cameron PH & Taupin V (1996)
Association of insulin-degrading enzyme with a 70
kDa cytosolic protein in hepatoma cells. Biochem J
319, 149–158.
56 Navab R, Chevet E, Authier F, Di Guglielmo GM,
Bergeron JJM & Brodt P (2001) Inhibition of endoso-
mal insulin-like growth factor-I processing by cysteine
proteinase inhibitors blocks receptor-mediated func-
tions. J Biol Chem 276, 13644–13649.
57 Laurent-Matha V, Maruani-Herrmann S, Pre
´
bois C,
Beaujouin M, Glondu M, Noe
¨
l A, Alvarez-Gonzalez
ML, Blacher S, Coopman P, Baghdiguian S et al.
(2005) Catalytically inactive human cathepsin D
triggers fibroblast invasive growth. J Cell Biol 168,
489–499.
T. El Hage et al. Cytotoxic action of cholera toxin and cathepsin D
FEBS Journal 274 (2007) 2614–2629 ª 2007 The Authors Journal compilation ª 2007 FEBS 2629