Tài liệu Báo cáo khoa học: "Which words are hard to recognize? Prosodic, lexical, and disfluency factors that increase ASR error rates" ppt
Bạn đang xem bản rút gọn của tài liệu. Xem và tải ngay bản đầy đủ của tài liệu tại đây (198.52 KB, 9 trang )
Proceedings of ACL-08: HLT, pages 380–388,
Columbus, Ohio, USA, June 2008.
c
2008 Association for Computational Linguistics
Which words are hard to recognize?
Prosodic, lexical, and disfluency factors that increase ASR error rates
Sharon Goldwater, Dan Jurafsky and Christopher D. Manning
Department of Linguistics and Computer Science
Stanford University
{sgwater,jurafsky,manning}@stanford.edu
Abstract
Many factors are thought to increase the
chances of misrecognizing a word in ASR,
including low frequency, nearby disfluencies,
short duration, and being at the start of a turn.
However, few of these factors have been for-
mally examined. This paper analyzes a variety
of lexical, prosodic, and disfluency factors to
determine which are likely to increase ASR er-
ror rates. Findings include the following. (1)
For disfluencies, effects depend on the type of
disfluency: errors increase by up to 15% (ab-
solute) for words near fragments, but decrease
by up to 7.2% (absolute) for words near repeti-
tions. This decrease seems to be due to longer
word duration. (2) For prosodic features, there
are more errors for words with extreme values
than words with typical values. (3) Although
our results are based on output from a system
with speaker adaptation, speaker differences
are a major factor influencing error rates, and
the effects of features such as frequency, pitch,
and intensity may vary between speakers.
1 Introduction
In order to improve the performance of automatic
speech recognition (ASR) systems on conversational
speech, it is important to understand the factors
that cause problems in recognizing words. Previous
work on recognition of spontaneous monologues
and dialogues has shown that infrequent words are
more likely to be misrecognized (Fosler-Lussier and
Morgan, 1999; Shinozaki and Furui, 2001) and that
fast speech increases error rates (Siegler and Stern,
1995; Fosler-Lussier and Morgan, 1999; Shinozaki
and Furui, 2001). Siegler and Stern (1995) and
Shinozaki and Furui (2001) also found higher er-
ror rates in very slow speech. Word length (in
phones) has also been found to be a useful pre-
dictor of higher error rates (Shinozaki and Furui,
2001). In Hirschberg et al.’s (2004) analysis of
two human-computer dialogue systems, misrecog-
nized turns were found to have (on average) higher
maximum pitch and energy than correctly recog-
nized turns. Results for speech rate were ambiguous:
faster utterances had higher error rates in one corpus,
but lower error rates in the other. Finally, Adda-
Decker and Lamel (2005) demonstrated that both
French and English ASR systems had more trouble
with male speakers than female speakers, and found
several possible explanations, including higher rates
of disfluencies and more reduction.
Many questions are left unanswered by these pre-
vious studies. In the word-level analyses of Fosler-
Lussier and Morgan (1999) and Shinozaki and Fu-
rui (2001), only substitution and deletion errors were
considered, so we do not know how including inser-
tions might affect the results. Moreover, these stud-
ies primarily analyzed lexical, rather than prosodic,
factors. Hirschberg et al.’s (2004) work suggests that
prosodic factors can impact error rates, but leaves
open the question of which factors are important at
the word level and how they influence recognition
of natural conversational speech. Adda-Decker and
Lamel’s (2005) suggestion that higher rates of dis-
fluency are a cause of worse recognition for male
speakers presupposes that disfluencies raise error
rates. While this assumption seems natural, it has
yet to be carefully tested, and in particular we do not
380
know whether disfluent words are associated with
errors in adjacent words, or are simply more likely to
be misrecognized themselves. Other factors that are
often thought to affect a word’s recognition, such as
its status as a content or function word, and whether
it starts a turn, also remain unexamined.
The present study is designed to address all of
these questions by analyzing the effects of a wide
range of lexical and prosodic factors on the accu-
racy of an English ASR system for conversational
telephone speech. In the remainder of this paper, we
first describe the data set used in our study and intro-
duce a new measure of error, individual word error
rate (IWER), that allows us to include insertion er-
rors in our analysis, along with deletions and substi-
tutions. Next, we present the features we collected
for each word and the effects of those features indi-
vidually on IWER. Finally, we develop a joint sta-
tistical model to examine the effects of each feature
while controlling for possible correlations.
2 Data
For our analysis, we used the output from the
SRI/ICSI/UW RT-04 CTS system (Stolcke et al.,
2006) on the NIST RT-03 development set. This sys-
tem’s performance was state-of-the-art at the time of
the 2004 evaluation. The data set contains 36 tele-
phone conversations (72 speakers, 38477 reference
words), half from the Fisher corpus and half from
the Switchboard corpus.
1
The standard measure of error used in ASR is
word error rate (WER), computed as 100(I + D +
S)/R, where I, D and S are the number of inser-
tions, deletions, and substitutions found by align-
ing the ASR hypotheses with the reference tran-
scriptions, and R is the number of reference words.
Since we wish to know what features of a reference
word increase the probability of an error, we need
a way to measure the errors attributable to individ-
ual words — an individual word error rate (IWER).
We assume that a substitution or deletion error can
be assigned to its corresponding reference word, but
for insertion errors, there may be two adjacent ref-
erence words that could be responsible. Our so-
lution is to assign any insertion errors to each of
1
These conversations are not part of the standard Fisher and
Switchboard corpora used to train most ASR systems.
Ins Del Sub Total % data
Full word 1.6 6.9 10.5 19.0 94.2
Filled pause 0.6 – 16.4 17.0 2.8
Fragment 2.3 – 17.3 19.6 2.0
Backchannel 0.3 30.7 5.0 36.0 0.6
Guess 1.6 – 30.6 32.1 0.4
Total 1.6 6.7 10.9 19.7 100
Table 1: Individual word error rates for different word
types, and the proportion of words belonging to each
type. Deletions of filled pauses, fragments, and guesses
are not counted as errors in the standard scoring method.
the adjacent words. We could then define IWER as
100(n
i
+ n
d
+ n
s
)/R, where n
i
, n
d
, and n
s
are the
insertion, deletion, and substitution counts for indi-
vidual words (with n
d
= D and n
s
= S). In general,
however, n
i
> I, so that the IWER for a given data
set would be larger than the WER. To facilitate com-
parisons with standard WER, we therefore discount
insertions by a factor α, such that αn
i
= I. In this
study, α = .617.
3 Analysis of individual features
3.1 Features
The reference transcriptions used in our analysis
distinguish between five different types of words:
filled pauses (um, uh), fragments (wh-, redistr-),
backchannels (uh-huh, mm-hm), guesses (where the
transcribers were unsure of the correct words), and
full words (everything else). Error rates for each
of these types can be found in Table 1. The re-
mainder of our analysis considers only the 36159 in-
vocabulary full words in the reference transcriptions
(70 OOV full words are excluded). We collected the
following features for these words:
Speaker sex Male or female.
Broad syntactic class Open class (e.g., nouns and
verbs), closed class (e.g., prepositions and articles),
or discourse marker (e.g., okay, well). Classes were
identified using a POS tagger (Ratnaparkhi, 1996)
trained on the tagged Switchboard corpus.
Log probability The unigram log probability of
each word, as listed in the system’s language model.
Word length The length of each word (in phones),
determined using the most frequent pronunciation
381
BefRep FirRep MidRep LastRep AfRep BefFP AfFP BefFr AfFr
yeah i i i think you should um ask for the ref- recommendation
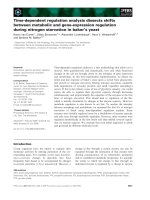
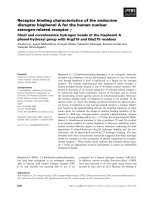
Figure 1: Example illustrating disfluency features: words occurring before and after repetitions, filled pauses, and
fragments; first, middle, and last words in a repeated sequence.
found for that word in the recognition lattices.
Position near disfluency A collection of features
indicating whether a word occurred before or after a
filled pause, fragment, or repeated word; or whether
the word itself was the first, last, or other word in a
sequence of repetitions. Figure 1 illustrates. Only
identical repeated words with no intervening words
or filled pauses were considered repetitions.
First word of turn Turn boundaries were assigned
automatically at the beginning of any utterance fol-
lowing a pause of at least 100 ms during which the
other speaker spoke.
Speech rate The average speech rate (in phones per
second) was computed for each utterance using the
pronunciation dictionary extracted from the lattices
and the utterance boundary timestamps in the refer-
ence transcriptions.
In addition to the above features, we used Praat
(Boersma and Weenink, 2007) to collect the follow-
ing additional prosodic features on a subset of the
data obtained by excluding all contractions:
2
Pitch The minimum, maximum, mean, and range
of pitch for each word.
Intensity The minimum, maximum, mean, and
range of intensity for each word.
Duration The duration of each word.
31017 words (85.8% of the full-word data set) re-
main in the no-contractions data set after removing
words for which pitch and/or intensity features could
not be extracted.
2
Contractions were excluded before collecting prosodic fea-
tures for the following reason. In the reference transcriptions
and alignments used for scoring ASR systems, contractions are
treated as two separate words. However, aside from speech rate,
our prosodic features were collected using word-by-word times-
tamps from a forced alignment that used a transcription where
contractions are treated as single words. Thus, the start and end
times for a contraction in the forced alignment correspond to
two words in the alignments used for scoring, and it is not clear
how to assign prosodic features appropriately to those words.
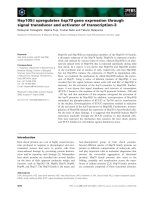
3.2 Results and discussion
Results of our analysis of individual features can be
found in Table 2 (for categorical features) and Figure
2 (for numeric features). Comparing the error rates
for the full-word and the no-contractions data sets in
Table 2 verifies that removing contractions does not
create systematic changes in the patterns of errors,
although it does lower error rates (and significance
values) slightly overall. (First and middle repetitions
are combined as non-final repetitions in the table,
because only 52 words were middle repetitions, and
their error rates were similar to initial repetitions.)
3.2.1 Disfluency features
Perhaps the most interesting result in Table 2 is
that the effects of disfluencies are highly variable de-
pending on the type of disfluency and the position
of a word relative to it. Non-final repetitions and
words next to fragments have an IWER up to 15%
(absolute) higher than the average word, while fi-
nal repetitions and words following repetitions have
an IWER up to 7.2% lower. Words occurring be-
fore repetitions or next to filled pauses do not have
significantly different error rates than words not in
those positions. Our results for repetitions support
Shriberg’s (1995) hypothesis that the final word of a
repeated sequence is in fact fluent.
3.2.2 Other categorical features
Our results support the common wisdom that
open class words have lower error rates than other
words (although the effect we find is small), and that
words at the start of a turn have higher error rates.
Also, like Adda-Decker and Lamel (2005), we find
that male speakers have higher error rates than fe-
males, though in our data set the difference is more
striking (3.6% absolute, compared to their 2.0%).
3.2.3 Word probability and word length
Turning to Figure 2, we find (consistent with pre-
vious results) that low-probability words have dra-
matically higher error rates than high-probability
382
Filled Pau. Fragment Repetition Syntactic Class Sex
Bef Aft Bef Aft Bef Aft NonF Fin Clos Open Disc 1st M F All
(a) IWER 17.6 16.9 33.8 21.6 16.7 13.8 26.0 11.6 19.7 18.0 19.6 21.2 20.6 17.0 18.8
% wds 1.7 1.7
1.6 1.5 0.7 0.9 1.2 1.1 43.8 50.5 5.8 6.2 52.5 47.5 100
(b) IWER 17.6 17.2 32.0 21.5 15.8 14.2 25.1 11.6 18.8 17.8 19.0 20.3 20.0 16.4 18.3
% wds 1.9 1.8
1.6 1.5 0.8 0.8 1.4 1.1 43.9 49.6 6.6 6.4 52.2 47.8 100
Table 2: IWER by feature and percentage of words exhibiting each feature for (a) the full-word data set and (b) the no-
contractions data set. Error rates that are significantly different for words with and without a given feature (computed
using 10,000 samples in a Monte Carlo permutation test) are in bold (p < .05) or bold italics (p < .005). Features
shown are whether a word occurs before or after a filled pause, fragment, or repetition; is a non-final or final repetition;
is open class, closed class, or a discourse marker; is the first word of a turn; or is spoken by a male or female. All is
the IWER for the entire data set. (Overall IWER is slightly lower than in Table 1 due to the removal of OOV words.)
words. More surprising is that word length in
phones does not seem to have a consistent effect on
IWER. Further analysis reveals a possible explana-
tion: word length is correlated with duration, but
anti-correlated to the same degree with log proba-
bility (the Kendall τ statistics are .50 and 49). Fig-
ure 2 shows that words with longer duration have
lower IWER. Since words with more phones tend to
have longer duration, but lower frequency, there is
no overall effect of length.
3.2.4 Prosodic features
Figure 2 shows that means of pitch and intensity
have relatively little effect except at extreme val-
ues, where more errors occur. In contrast, pitch
and intensity range show clear linear trends, with
greater range of pitch or intensity leading to lower
IWER.
3
As noted above, decreased duration is as-
sociated with increased IWER, and (as in previous
work), we find that IWER increases dramatically
for fast speech. We also see a tendency towards
higher IWER for very slow speech, consistent with
Shinozaki and Furui (2001) and Siegler and Stern
(1995). The effects of pitch minimum and maximum
are not shown for reasons of space, but are similar
to pitch mean. Also not shown are intensity mini-
mum (with more errors at higher values) and inten-
sity maximum (with more errors at lower values).
For most of our prosodic features, as well as log
probability, extreme values seem to be associated
3
Our decision to use the log transform of pitch range was
originally based on the distribution of pitch range values in the
data set. Exploratory data analysis also indicated that using the
transformed values would likely lead to a better model fit (Sec-
tion 4) than using the raw values.
with worse recognition than average values. We ex-
plore this possibility further in Section 4.
4 Analysis using a joint model
In the previous section, we investigated the effects
of various individual features on ASR error rates.
However, there are many correlations between these
features – for example, words with longer duration
are likely to have a larger range of pitch and inten-
sity. In this section, we build a single model with all
of our features as potential predictors in order to de-
termine the effects of each feature after controlling
for the others. We use the no-contractions data set so
that we can include prosodic features in our model.
Since only 1% of tokens have an IWER > 1, we
simplify modeling by predicting only whether each
token is responsible for an error or not. That is, our
dependent variable is binary, taking on the value 1 if
IWER > 0 for a given token and 0 otherwise.
4.1 Model
To model data with a binary dependent variable, a
logistic regression model is an appropriate choice.
In logistic regression, we model the log odds as a
linear combination of feature values x
0
. . . x
n
:
log
p
1 − p
= β
0
x
0
+ β
1
x
1
+ . . . + β
n
x
n
where p is the probability that the outcome occurs
(here, that a word is misrecognized) and β
0
. . . β
n
are coefficients (feature weights) to be estimated.
Standard logistic regression models assume that all
categorical features are fixed effects, meaning that
all possible values for these features are known in
advance, and each value may have an arbitrarily dif-
ferent effect on the outcome. However, features
383
2 4 6 8 10
0 20 40
Word length (phones)
IWER
100 200 300
0 20 40
Pitch mean (Hz)
50 60 70 80
0 20 40
Intensity mean (dB)
0.0 0.2 0.4 0.6 0.8 1.0
0 20 40
Duration (sec)
−5 −4 −3 −2
0 20 40
Log probability
IWER
1 2 3 4 5
0 20 40
log(Pitch range) (Hz)
IWER
10 30 50
0 20 40
Intensity range (dB)
5 10 15 20
0 20 40
Speech rate (phones/sec)
Figure 2: Effects of numeric features on IWER of the SRI system for the no-contractions data set. All feature values
were binned, and the average IWER for each bin is plotted, with the area of the surrounding circle proportional to the
number of points in the bin. Dotted lines show the average IWER over the entire data set.
such as speaker identity do not fit this pattern. In-
stead, we control for speaker differences by assum-
ing that speaker identity is a random effect, mean-
ing that the speakers observed in the data are a ran-
dom sample from a larger population. The base-
line probability of error for each speaker is therefore
assumed to be a normally distributed random vari-
able, with mean equal to the population mean, and
variance to be estimated by the model. Stated dif-
ferently, a random effect allows us to add a factor
to the model for speaker identity, without allowing
arbitrary variation in error rates between speakers.
Models such as ours, with both fixed and random
effects, are known as mixed-effects models, and are
becoming a standard method for analyzing linguis-
tic data (Baayen, 2008). We fit our models using the
lme4 package (Bates, 2007) of R (R Development
Core Team, 2007).
To analyze the joint effects of all of our features,
we initially built as large a model as possible, and
used backwards elimination to remove features one
at a time whose presence did not contribute signifi-
cantly (at p ≤ .05) to model fit. All of the features
shown in Table 2 were converted to binary variables
and included as predictors in our initial model, along
with a binary feature controlling for corpus (Fisher
or Switchboard), and all numeric features in Figure
2. We did not include minimum and maximum val-
ues for pitch and intensity because they are highly
correlated with the mean values, making parameter
estimation in the combined model difficult. Prelimi-
nary investigation indicated that using the mean val-
ues would lead to the best overall fit to the data.
In addition to these basic fixed effects, our ini-
tial model included quadratic terms for all of the nu-
meric features, as suggested by our analysis in Sec-
tion 3, as well as random effects for speaker iden-
tity and word identity. All numeric features were
rescaled to values between 0 and 1 so that coeffi-
cients are comparable.
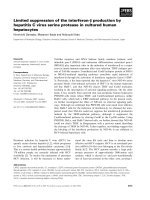
4.2 Results and discussion
Figure 3 shows the estimated coefficients and stan-
dard errors for each of the fixed effect categorical
features remaining in the reduced model (i.e., after
backwards elimination). Since all of the features are
binary, a coefficient of β indicates that the corre-
sponding feature, when present, adds a weight of β
to the log odds (i.e., multiplies the odds of an error
by a factor of e
β
). Thus, features with positive co-
efficients increase the odds of an error, and features
with negative coefficients decrease the odds of an er-
ror. The magnitude of the coefficient corresponds to
the size of the effect.
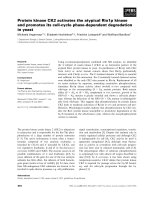
Interpreting the coefficients for our numeric fea-
tures is less intuitive, since most of these variables
have both linear and quadratic effects. The contribu-
tion to the log odds of a particular numeric feature
384
−1.5 −1.0 −0.5 0.0 0.5 1.0
corpus=SW
sex=M
starts turn
before FP
after FP
before frag
after frag
non−final rep
open class
Figure 3: Estimates and standard errors of the coefficients
for the categorical predictors in the reduced model.
x
i
, with linear and quadratic coefficients a and b, is
ax
i
+ bx
2
i
. We plot these curves for each numeric
feature in Figure 4. Values on the x axes with posi-
tive y values indicate increased odds of an error, and
negative y values indicate decreased odds of an er-
ror. The x axes in these plots reflect the rescaled
values of each feature, so that 0 corresponds to the
minimum value in the data set, and 1 to the maxi-
mum value.
4.2.1 Disfluencies
In our analysis of individual features, we found
that different types of disfluencies have different ef-
fects: non-final repeated words and words near frag-
ments have higher error rates, while final repetitions
and words following repetitions have lower error
rates. After controlling for other factors, a differ-
ent picture emerges. There is no longer an effect for
final repetitions or words after repetitions; all other
disfluency features increase the odds of an error by
a factor of 1.3 to 2.9. These differences from Sec-
tion 3 can be explained by noting that words near
filled pauses and repetitions have longer durations
than other words (Bell et al., 2003). Longer duration
lowers IWER, so controlling for duration reveals the
negative effect of the nearby disfluencies. Our re-
sults are also consistent with Shriberg’s (1995) find-
ings on fluency in repeated words, since final rep-
etitions have no significant effect in our combined
model, while non-final repetitions incur a penalty.
4.2.2 Other categorical features
Without controlling for other lexical or prosodic
features, we found that a word is more likely to
be misrecognized at the beginning of a turn, and
less likely to be misrecognized if it is an open class
word. According to our joint model, these effects
still hold even after controlling for other features.
Similarly, male speakers still have higher error rates
than females. This last result sheds some light on
the work of Adda-Decker and Lamel (2005), who
suggested several factors that could explain males’
higher error rates. In particular, they showed that
males have higher rates of disfluency, produce words
with slightly shorter durations, and use more alter-
nate (“sloppy”) pronunciations. Our joint model
controls for the first two of these factors, suggesting
that the third factor or some other explanation must
account for the remaining differences between males
and females. One possibility is that female speech is
more easily recognized because females tend to have
expanded vowel spaces (Diehl et al., 1996), a factor
that is associated with greater intelligibility (Brad-
low et al., 1996) and is characteristic of genres with
lower ASR error rates (Nakamura et al., 2008).
4.2.3 Prosodic features
Examining the effects of pitch and intensity indi-
vidually, we found that increased range for these fea-
tures is associated with lower IWER, while higher
pitch and extremes of intensity are associated with
higher IWER. In the joint model, we see the same
effect of pitch mean and an even stronger effect for
intensity, with the predicted odds of an error dra-
matically higher for extreme intensity values. Mean-
while, we no longer see a benefit for increased pitch
range and intensity; rather, we see small quadratic
effects for both features, i.e. words with average
ranges of pitch and intensity are recognized more
easily than words with extreme values for these fea-
tures. As with disfluencies, we hypothesize that the
linear trends observed in Section 3 are primarily due
to effects of duration, since duration is moderately
correlated with both log pitch range (τ = .35) and
intensity range (τ = .41).
Our final two prosodic features, duration and
speech rate, showed strong linear and weak
quadratic trends when analyzed individually. Ac-
cording to our model, both duration and speech rate
are still important predictors of error after control-
ling for other features. However, as with the other
prosodic features, predictions of the joint model are
dominated by quadratic trends, i.e., predicted error
rates are lower for average values of duration and
speech rate than for extreme values.
Overall, the results from our joint analysis suggest
385
0.0 0.4 0.8
−4 0 4
Word length
log odds
y = −0.8x
0.0 0.4 0.8
−4 0 4
Pitch mean
log odds
y = 1x
0.0 0.4 0.8
−4 0 4
Intensity mean
log odds
y = −13.2x +11.5x
2
0.0 0.4 0.8
−4 0 4
Duration
log odds
y = −12.6x +14.6x
2
0.0 0.4 0.8
−4 0 4
Log probability
log odds
y = −0.6x +4.1x
2
0.0 0.4 0.8
−4 0 4
log(Pitch range)
log odds
y = −2.3x +2.2x
2
0.0 0.4 0.8
−4 0 4
Intensity range
log odds
y = −1x +1.2x
2
0.0 0.4 0.8
−4 0 4
Speech rate
log odds
y = −3.9x +4.4x
2
Figure 4: Predicted effect on the log odds of each numeric feature, including linear and (if applicable) quadratic terms.
Model Neg. log lik. Diff. df
Full 12932 0 32
Reduced 12935 3 26
No lexical 13203 271 16
No prosodic 13387 455 20
No speaker 13432 500 31
No word 13267 335 31
Baseline 14691 1759 1
Table 3: Fit to the data of various models. Degrees of
freedom (df) for each model is the number of fixed ef-
fects plus the number of random effects plus 1 (for the
intercept). Full model contains all predictors; Reduced
contains only predictors contributing significantly to fit;
Baseline contains only intercept. Other models are ob-
tained by removing features from Full. Diff is the differ-
ence in log likelihood between each model and Full.
that, after controlling for other factors, extreme val-
ues for prosodic features are associated with worse
recognition than typical values.
4.2.4 Differences between lexical items
As discussed above, our model contains a random
effect for word identity, to control for the possibil-
ity that certain lexical items have higher error rates
that are not explained by any of the other factors
in the model. It is worth asking whether this ran-
dom effect is really necessary. To address this ques-
tion, we compared the fit to the data of two models,
each containing all of our fixed effects and a ran-
dom effect for speaker identity. One model also con-
tained a random effect for word identity. Results are
shown in Table 3. The model without a random ef-
fect for word identity is significantly worse than the
full model; in fact, this single parameter is more im-
portant than all of the lexical features combined. To
see which lexical items are causing the most diffi-
culty, we examined the items with the highest esti-
mated increases in error. The top 20 items on this
list include yup, yep, yes, buy, then, than, and r., all
of which are acoustically similar to each other or to
other high-frequency words, as well as the words af-
ter, since, now, and though, which occur in many
syntactic contexts, making them difficult to predict
based on the language model.
4.2.5 Differences between speakers
We examined the importance of the random effect
for speaker identity in a similar fashion to the ef-
fect for word identity. As shown in Table 3, speaker
identity is a very important factor in determining the
probability of error. That is, the lexical and prosodic
variables examined here are not sufficient to fully
explain the differences in error rates between speak-
ers. In fact, the speaker effect is the single most im-
portant factor in the model.
Given that the differences in error rates between
speakers are so large (average IWER for different
speakers ranges from 5% to 51%), we wondered
whether our model is sufficient to capture the kinds
of speaker variation that exist. The model assumes
that each speaker has a different baseline error rate,
but that the effects of each variable are the same for
each speaker. Determining the extent to which this
assumption is justified is beyond the scope of this
paper, however we present some suggestive results
in Figure 5. This figure illustrates some of the dif-
386
40 60 80
0.0 0.2 0.4
Intensity mean (dB)
Fitted P(err)
100 250 400
0.0 0.2 0.4
Pitch mean (Hz)
0.0 0.5 1.0 1.5
0.0 0.2 0.4
Duration (sec)
−6 −5 −4 −3 −2
0.0 0.2 0.4
Neg. log prob.
0 5 10 20
0.0 0.2 0.4
Sp. rate (ph/sec)
40 60 80
0.0 0.2 0.4
Intensity mean (dB)
Fitted P(err)
100 250 400
0.0 0.2 0.4
Pitch mean (Hz)
0.0 0.5 1.0 1.5
0.0 0.2 0.4
Duration (sec)
−6 −5 −4 −3 −2
0.0 0.2 0.4
Neg. log prob.
0 5 10 20
0.0 0.2 0.4
Sp. rate (ph/sec)
Figure 5: Estimated effects of various features on the error rates of two different speakers (top and bottom). Dashed
lines illustrate the baseline probability of error for each speaker. Solid lines were obtained by fitting a logistic regres-
sion model to each speaker’s data, with the variable labeled on the x-axis as the only predictor.
ferences between two speakers chosen fairly arbi-
trarily from our data set. Not only are the baseline
error rates different for the two speakers, but the ef-
fects of various features appear to be very different,
in one case even reversed. The rest of our data set
exhibits similar kinds of variability for many of the
features we examined. These differences in ASR be-
havior between speakers are particularly interesting
considering that the system we investigated here al-
ready incorporates speaker adaptation models.
5 Conclusion
In this paper, we introduced the individual word er-
ror rate (IWER) for measuring ASR performance
on individual words, including insertions as well as
deletions and substitutions. Using IWER, we ana-
lyzed the effects of various word-level lexical and
prosodic features, both individually and in a joint
model. Our analysis revealed the following effects.
(1) Words at the start of a turn have slightly higher
IWER than average, and open class (content) words
have slightly lower IWER. These effects persist even
after controlling for other lexical and prosodic fac-
tors. (2) Disfluencies heavily impact error rates:
IWER for non-final repetitions and words adjacent
to fragments rises by up to 15% absolute, while
IWER for final repetitions and words following rep-
etitions decreases by up to 7.2% absolute. Control-
ling for prosodic features eliminates the latter ben-
efit, and reveals a negative effect of adjacent filled
pauses, suggesting that the effects of these disfluen-
cies are normally obscured by the greater duration of
nearby words. (3) For most acoustic-prosodic fea-
tures, words with extreme values have worse recog-
nition than words with average values. This effect
becomes much more pronounced after controlling
for other factors. (4) After controlling for lexical
and prosodic characteristics, the lexical items with
the highest error rates are primarily homophones or
near-homophones (e.g., buy vs. by, then vs. than).
(5) Speaker differences account for much of the vari-
ance in error rates between words. Moreover, the di-
rection and strength of effects of different prosodic
features may vary between speakers.
While we plan to extend our analysis to other
ASR systems in order to determine the generality
of our findings, we have already gained important
insights into a number of factors that increase ASR
error rates. In addition, our results suggest a rich
area for future research in further analyzing the vari-
ability of both lexical and prosodic effects on ASR
behavior for different speakers.
Acknowledgments
This work was supported by the Edinburgh-Stanford
LINK and ONR MURI award N000140510388. We
thank Andreas Stolcke for providing the ASR out-
put, language model, and forced alignments used
here, and Raghunandan Kumaran and Katrin Kirch-
hoff for earlier datasets and additional help.
387
References
M. Adda-Decker and L. Lamel. 2005. Do speech rec-
ognizers prefer female speakers? In Proceedings of
INTERSPEECH, pages 2205–2208.
R. H. Baayen. 2008. Analyzing Linguistic Data. A
Practical Introduction to Statistics. Cambridge
University Press. Prepublication version available at
/>lications.html.
Douglas Bates, 2007. lme4: Linear mixed-effects models
using S4 classes. R package version 0.99875-8.
A. Bell, D. Jurafsky, E. Fosler-Lussier, C. Girand,
M. Gregory, and D. Gildea. 2003. Effects of disflu-
encies, predictability, and utterance position on word
form variation in English conversation. Journal of the
Acoustical Society of America, 113(2):1001–1024.
P. Boersma and D. Weenink. 2007. Praat:
doing phonetics by computer (version 4.5.16).
/>A. Bradlow, G. Torretta, and D. Pisoni. 1996. Intelli-
gibility of normal speech I: Global and fine-grained
acoustic-phonetic talker characteristics. Speech Com-
munication, 20:255–272.
R. Diehl, B. Lindblom, K. Hoemeke, and R. Fahey. 1996.
On explaining certain male-female differences in the
phonetic realization of vowel categories. Journal of
Phonetics, 24:187–208.
E. Fosler-Lussier and N. Morgan. 1999. Effects of
speaking rate and word frequency on pronunciations
in conversational speech. Speech Communication,
29:137– 158.
J. Hirschberg, D. Litman, and M. Swerts. 2004. Prosodic
and other cues to speech recognition failures. Speech
Communication, 43:155– 175.
M. Nakamura, K. Iwano, and S. Furui. 2008. Differ-
ences between acoustic characteristics of spontaneous
and read speech and their effects on speech recogni-
tion performance. Computer Speech and Language,
22:171– 184.
R Development Core Team, 2007. R: A Language and
Environment for Statistical Computing. R Foundation
for Statistical Computing, Vienna, Austria. ISBN 3-
900051-07-0.
A. Ratnaparkhi. 1996. A Maximum Entropy model for
part-of-speech tagging. In Proceedings of the First
Conference on Empirical Methods in Natural Lan-
guage Processing, pages 133–142.
T. Shinozaki and S. Furui. 2001. Error analysis using de-
cision trees in spontaneous presentation speech recog-
nition. In Proceedings of ASRU 2001.
E. Shriberg. 1995. Acoustic properties of disfluent rep-
etitions. In Proceedings of the International Congress
of Phonetic Sciences, volume 4, pages 384–387.
M. Siegler and R. Stern. 1995. On the effects of speech
rate in large vocabulary speech recognition systems.
In Proceedings of ICASSP.
A. Stolcke, B. Chen, H. Franco, V. R. R. Gadde, M. Gra-
ciarena, M Y. Hwang, K. Kirchhoff, A. Mandal,
N. Morgan, X. Lin, T. Ng, M. Ostendorf, K. Sonmez,
A. Venkataraman, D. Vergyri, W. Wang, J. Zheng, and
Q. Zhu. 2006. Recent innovations in speech-to-text
transcription at SRI-ICSI-UW. IEEE Transactions on
Audio, Speech and Language Processing, 14(5):1729–
1744.
388