Nano Surface Chemistry
Bạn đang xem bản rút gọn của tài liệu. Xem và tải ngay bản đầy đủ của tài liệu tại đây (13.04 MB, 691 trang )
www.pdfgrip.com
ISBN: 0-8247-0254-9
This book is printed on acid-free paper.
Headquarters
Marcel Dekker, Inc.
270 Madison Avenue, New York, NY 10016
tel: 212-696-9000; fax: 212-685-4540
Eastern Hemisphere Distribution
Marcel Dekker AG
Hutgasse 4, Postfach 812, CH-4001 Basel, Switzerland
tel: 41-61-261-8482; fax: 41-61-261-8896
World Wide Web
The publisher offers discounts on this book when ordered in bulk quantities. For more information,
write to Special Sales/Professional Marketing at the headquarters address above.
Copyright © 2002 by Marcel Dekker, Inc. All Rights Reserved.
Neither this book nor any part may be reproduced or transmitted in any form or by any means,
electronic or mechanical, including photocopying, microfilming, and recording, or by any
information storage and retrieval system, without permission in writing from the publisher.
Current printing (last digit):
10 9 8 7 6 5 4 3 2 1
PRINTED IN THE UNITED STATES OF AMERICA
www.pdfgrip.com
Preface
Tools shape how we think; when the only tool you have is an axe, everything resembles a
tree or a log. The rapid advances in instrumentation in the last decade, which allow us to
measure and manipulate individual molecules and structures on the nanoscale, have caused
a paradigm shift in the way we view molecular behavior and surfaces. The microscopic details underlying interfacial phenomena have customarily been inferred from in situ measurements of macroscopic quantities. Now we can see and “finger” physical and chemical
processes at interfaces.
The reviews collected in this book convey some of the themes recurrent in nano-colloid science: self-assembly, construction of supramolecular architecture, nanoconfinement
and compartmentalization, measurement and control of interfacial forces, novel synthetic
materials, and computer simulation. They also reveal the interaction of a spectrum of disciplines in which physics, chemistry, biology, and materials science intersect. Not only is
the vast range of industrial and technological applications depicted, but it is also shown
how this new way of thinking has generated exciting developments in fundamental science.
Some of the chapters also skirt the frontiers, where there are still unanswered questions.
The book should be of value to scientific readers who wish to become acquainted
with the field as well as to experienced researchers in the many areas, both basic and technological, of nanoscience.
The lengthy maturation of a multiauthored book of this nature is subject to life’s contingencies. Hopefully, its structure is sound and has survived the bumps of “outrageous fortune.” I wish to thank all the contributors for their courage in writing. It is their work and
commitment that have made this book possible.
Morton Rosoff
iii
www.pdfgrip.com
www.pdfgrip.com
Contents
Preface iii
Contributors vii
Introduction ix
1.
Molecular Architectures at Solid–Liquid Interfaces Studied by Surface Forces
Measurement 1
Kazue Kurihara
2.
Adhesion on the Nanoscale 17
Suzanne P. Jarvis
3.
Langmuir Monolayers: Fundamentals and Relevance to Nanotechnology 59
Keith J. Stine and Brian G. Moore
4.
Supramolecular Organic Layer Engineering for Industrial Nanotechnology 141
Claudio Nicolini, V. Erokhin, and M. K. Ram
5.
Mono- and Multilayers of Spherical Polymer Particles Prepared by
Langmuir–Blodgett and Self-Assembly Techniques 213
Bernd Tieke, Karl-Ulrich Fulda, and Achim Kampes
6.
Studies of Wetting and Capillary Phenomena at Nanometer Scale with Scanning
Polarization Force Microscopy 243
Lei Xu and Miquel Salmeron
7.
Nanometric Solid Deformation of Soft Materials in Capillary Phenomena 289
Martin E. R. Shanahan and Alain Carré
8.
Two-Dimensional and Three-Dimensional Superlattices: Syntheses and Collective
Physical Properties 315
Marie-Paule Pileni
9.
Molecular Nanotechnology and Nanobiotechnology with Two-Dimensional Protein
Crystals (S-Layers) 333
Uwe B. Sleytr, Margit Sára, Dietmar Pum, and Bernhard Schuster
v
www.pdfgrip.com
vi
Contents
10.
DNA as a Material for Nanobiotechnology 391
Christof M. Niemeyer
11.
Self-Assembled DNA/Polymer Complexes 431
Vladimir S. Trubetskoy and Jon A. Wolff
12.
Supramolecular Assemblies Made of Biological Macromolecules 461
Nir Dotan, Noa Cohen, Ori Kalid, and Amihay Freeman
13.
Reversed Micelles as Nanometer-Size Solvent Media 473
Vincenzo Turco Liveri
14.
Engineering of Core-Shell Particles and Hollow Capsules 505
Frank Caruso
15.
Electro-Transport in Hydrophilic Nanostructured Materials 527
Bruce R. Locke
16.
Electrolytes in Nanostructures 625
Kwong-Yu Chan
17.
Polymer–Clay Nanocomposites: Synthesis and Properties 653
Syed Qutubuddin and Xiaoan Fu
Index 675
www.pdfgrip.com
Contributors
Alain Carré
Fontainebleau Research Center, Corning S.A., Avon, France
Frank Caruso
Max-Planck-Institute of Colloids and Interfaces, Potsdam, Germany
Kwong-Yu Chan
SAR, China
Department of Chemistry, The University of Hong Kong, Hong Kong
Noa Cohen Department of Molecular Microbiology and Biotechnology, Faculty of Life
Sciences, Tel Aviv University, Tel Aviv, Israel
Nir Dotan Glycominds Ltd., Maccabim, Israel
V. Erokhin Department of Biophysical M&O Science and Technologies, University of
Genoa, Genoa, Italy
Amihay Freeman Department of Molecular Microbiology and Biotechnology, Faculty
of Life Sciences, Tel Aviv University, Tel Aviv, Israel
Xiaoan Fu Department of Chemical Engineering, Case Western Reserve University,
Cleveland, Ohio
Karl-Ulrich Fulda
Germany
Institute of Physical Chemistry, University of Cologne, Cologne,
Suzanne P. Jarvis Nanotechnology Research Institute, National Institute of Advanced
Industrial Science and Technology, Ibaraki, Japan
Ori Kalid Department of Molecular Microbiology and Biotechnology, Faculty of Life
Sciences, Tel Aviv University, Tel Aviv, Israel
Achim Kampes
Germany
Institute for Physical Chemistry, University of Cologne, Cologne,
Kazue Kurihara
Japan
Institute for Chemical Reaction Science, Tohoku University, Sendai,
vii
www.pdfgrip.com
viii
Contributors
Bruce R. Locke Department of Chemical Engineering, Florida State University,
Tallahassee, Florida
Brian G. Moore
Pennsylvania
School of Science, Penn State Erie–The Behrend College, Erie,
Claudio Nicolini Department of Biophysical M&O Science and Technologies,
University of Genoa, Genoa, Italy
Christof M. Niemeyer Department of Biotechnology, University of Bremen, Bremen,
Germany
Marie-Paule Pileni Université Pierre et Marie Curie, LM2N, Paris, France
Dietmar Pum Center for Ultrastructure Research, Universität für Bodenkultur Wien,
Vienna, Austria
Syed Qutubuddin Department of Chemical Engineering, Case Western Reserve
University, Cleveland, Ohio
M. K. Ram Department of Biophysical M&O Science and Technologies, University of
Genoa, Genoa, Italy
Miquel Salmeron Materials Sciences Division, Lawrence Berkeley National
Laboratory, Berkeley, California
Margit Sára Center for Ultrastructure Research, Universität für Bodenkultur Wien,
Vienna, Austria
Bernhard Schuster Center for Ultrastructure Research, Universität für Bodenkultur
Wien, Vienna, Austria
Martin E. R. Shanahan Adhesion, Wetting, and Bonding, National Centre for Scientific
Research/School of Mines Paris, Evry, France
Uwe B. Sleytr Center for Ultrastructure Research, Universität für Bodenkultur Wien,
Vienna, Austria
Keith J. Stine Department of Chemistry and Center for Molecular Electronics,
University of Missouri–St. Louis, St. Louis, Missouri
Bernd Tieke
Germany
Institute for Physical Chemistry, University of Cologne, Cologne,
Vladimir S. Trubetskoy
Mirus Corporation, Madison, Wisconsin
Vincenzo Turco Liveri
Palermo, Italy
Department of Physical Chemistry, University of Palermo,
Jon A. Wolff Departments of Pediatrics and Medical Genetics, University of
Wisconsin–Madison, Madison, Wisconsin
Lei Xu Materials Sciences Division, Lawrence Berkeley National Laboratory, Berkeley,
California
www.pdfgrip.com
Introduction
The problems of chemistry and biology can be greatly helped if our ability to see what we are
doing, and to do things on an atomic level is ultimately developed—a development which I
think can’t be avoided.
Richard Feynman
God created all matter—but the surfaces are the work of the Devil.
Wolfgang Pauli
The prefix nano-, derived from the Greek word meaning “dwarf,” has been applied most often to systems whose functions and characteristics are determined by their tiny size. Structures less than 100 nanometers in length (i.e., one-ten-millionth of a meter) are typical in
nano-technology, which emphasizes the approach of building up from molecules and nanostructures (“bottom-up”) versus the “top-down,” or miniaturization, approach. Nano- actually
refers not so much to the size of the object as to the resolution at the molecular scale. At such
small scales, about half of the atoms are in the surface layer, the surface energy dominates,
and the surface layer can be considered a new material with properties different from those of
bulk. The hierarchy of scales, both spatial and temporal, is represented in the following table:
Scale
Length (meters)
Time (seconds)
Quantum
Atom/nano
Mesoscopic
Macroscopic
10Ϫ11–10Ϫ8
10Ϫ16–10Ϫ12
10Ϫ9–10Ϫ6
10Ϫ13–10Ϫ10
10Ϫ6–10Ϫ3
10Ϫ10–10Ϫ6
Ͼ10Ϫ3
Ͼ10Ϫ6
Classical surface and colloid chemistry generally treats systems experimentally in a
statistical fashion, with phenomenological theories that are applicable only to building simplified microstructural models. In recent years scientists have learned not only to observe
individual atoms or molecules but also to manipulate them with subangstrom precision.
The characterization of surfaces and interfaces on nanoscopic and mesoscopic length scales
is important both for a basic understanding of colloidal phenomena and for the creation and
mastery of a multitude of industrial applications.
ix
www.pdfgrip.com
x
Introduction
The self-organization or assembly of units at the nanoscale to form supramolecular
ensembles on mesoscopic length scales comprises the range of colloidal systems. There is
a need to understand the connection between structure and properties, the evolution and dynamics of these structures at the different levels—supramolecular, molecular, and submolecular—by “learning from below.”
When interaction and physical phenomena length scales become comparable to or
larger than the size of the structure, as, for example, with polymer contour chain length, the
system may exhibit unusual behavior and generate novel arrangements not accessible in
bulk.
It is also at these levels (10–500 nm) that nature utilizes hierarchical assemblies in biology, and biological processes almost invariably take place at the nanoscale, across membranes and at interfaces. Biomolecular materials with unique properties may be developed
by mimicking biological processes or modifying them. There is still much to discover about
improving periodic arrays of biomolecules, biological templating, and how to exploit the
differences between biological and nonbiological self-assembly.
The linkage of microscopic and macroscopic properties is not without challenges,
both theoretical and experimental. Statistical mechanics and thermodynamics provide the
connection between molecular properties and the behavior of macroscopic matter. Coupled
with statistical mechanics, computer simulation of the structure, properties, and dynamics
of mesoscale models is now feasible and can handle the increase in length and time scales.
Scanning proble techniques (SPM)—i.e., scanning tunneling microscopy (STM) and
atomic force microscopy (AFM), as well as their variations—have the power to visualize
nanoscale surface phenomena in three dimensions, manipulate and modify individual
molecules, and measure such properties as adhesion, stiffness, and friction as well as magnetic and electric fields. The use of chemically modified tips extends the technique to include chemical imaging and measurement of specific molecular interactions. Improved optical methods complement probe images and are capable of imaging films a single molecule
thick. Optical traps, laser tweezers, and “nano-pokers” have been developed to measure
forces and manipulate single molecules. In addition, there is a vast range of experimental
tools that cross different length and time scales and provide important information (x-ray,
neutrons, surface plasmon resonance). Nevertheless, there is a further need for instrumentation of higher resolution, for example, in the decreased ranged of space and time encountered when exploring the dynamics and kinetics of surface films.
Chapter 1 is a view of the potential of surface forces apparatus (SFA) measurements
of two-dimensional organized ensembles at solid–liquid interfaces. At this level, information is acquired that is not available at the scale of single molecules. Chapter 2 describes
the measurement of surface interactions that occur between and within nanosized surface
structures—interfacial forces responsible for adhesion, friction, and recognition.
In Chapter 3, Langmuir–Blodgett films of varying organizational complexity are discussed, as well as nanoparticles and fullerenes. Molecular dynamic simulation of monolayers and multilayers of surfactants is also reviewed. Chapter 4 presents those aspects of
supramolecular layer assemblies related to the development of nanotechnological applications. Problems of preparing particle films with long-range two-dimensional and three-dimensional order by Langmuir–Blodgett and self-assembly techniques are dealt with in
Chapter 5.
The next two chapters are concerned with wetting and capillarity. Wetting phenomena are still poorly understood; contact angles, for example, are simply an empirical parameter to quantify wettability. Chapter 6 reviews the use of scanning polarization force
www.pdfgrip.com
Introduction
xi
microscopy (SPFM), a new application of AFM using electrostatic forces, to study the
nanostructure of liquid films and droplets. The effect of solid nanometric deformation on
the kinetics of wetting and dewetting and capillary flow in soft materials, such as some
polymers and gels, is treated in Chapter 7.
Chapter 8 presents evidence on how the physical properties of colloidal crystals organized by self-assembly in two-dimensional and three-dimensional superlattices differ
from those of the free nanoparticles in dispersion.
A biomolecular system of glycoproteins derived from bacterial cell envelopes that
spontaneously aggregates to form crystalline arrays in the mesoscopic range is reviewed in
Chapter 9. The structure and features of these S-layers that can be applied in biotechnology, membrane biomimetics, sensors, and vaccine development are discussed.
DNA is ideally suited as a structural material in supramolecular chemistry. It has
sticky ends and simple rules of assembly, arbitrary sequences can be obtained, and there is
a profusion of enzymes for modification. The molecule is stiff and stable and encodes information. Chapter 10 surveys its varied applications in nanobiotechnology. The emphasis
of Chapter 11 is on DNA nanoensembles, condensed by polymer interactions and electrostatic forces for gene transfer. Chapter 12 focuses on proteins as building blocks for nanostructures.
The next two chapters concern nanostructured core particles. Chapter 13 provides examples of nano-fabrication of cored colloidal particles and hollow capsules. These systems
and the synthetic methods used to prepare them are exceptionally adaptable for applications
in physical and biological fields. Chapter 14, discusses reversed micelles from the theoretical viewpoint, as well as their use as nano-hosts for solvents and drugs and as carriers and
reactors.
Chapter 15 gives an extensive and detailed review of theoretical and practical aspects
of macromolecular transport in nanostructured media. Chapter 16 examines the change in
transport properties of electrolytes confined in nanostructures, such as pores of membranes.
The confinment effect is also analyzed by molecular dynamic simulation.
Nanolayers of clay interacting with polymers to form nanocomposites with improved
material properties relative to the untreated polymer are discussed in Chapter 17.
Morton Rosoff
www.pdfgrip.com
www.pdfgrip.com
1
Molecular Architectures at Solid–Liquid
Interfaces Studied by Surface Forces
Measurement
KAZUE KURIHARA
Tohoku University, Sendai, Japan
I. INTRODUCTION
Molecular and surface interactions are ubiquitous in molecular science, including biology.
Surface forces measurement and atomic force microscopy (AFM) have made it possible to
directly measure, with high sensitivity, molecular and surface interactions in liquids as a
function of the surface separation. Naturally, they have become powerful tools for studying the origins of forces (van der Waals, electrostatic, steric, etc.) operating between
molecules and/or surfaces of interest [1–4]. They also offer a unique, novel surface characterization method that “monitors surface properties changing from the surface to the bulk
(depth profiles)” and provides new insights into surface phenomena. This method is direct
and simple. It is difficult to obtain a similar depth profile by other methods; x-ray and neutron scattering measurements can provide similar information but require extensive instrumentation and appropriate analytical models [4].
Molecular architectures are self-organized polymolecular systems where molecular
interactions play important roles [5]. They exhibit specific and unique functions that could
not be afforded by single molecules. Molecular architecture chemistry beyond molecules
is not only gaining a central position in chemistry but becoming an important interdisciplinary field of science. Investigations of molecular architectures by surface forces measurement is important for the following reasons.
1. It is essential to elucidate intermolecular interactions involved in self-organization,
whose significance is not limited to material science but extends to the ingenuity of biological systems [5].
2. The importance of surface characterization in molecular architecture chemistry and engineering is obvious. Solid surfaces are becoming essential building blocks for constructing molecular architectures, as demonstrated in self-assembled monolayer formation [6] and alternate layer-by-layer adsorption [7]. Surface-induced structuring of
liquids is also well-known [8,9], which has implications for micro- and nano-technologies (i.e., liquid crystal displays and micromachines). The virtue of the force measurement has been demonstrated, for example, in our report on novel molecular architectures (alcohol clusters) at solid–liquid interfaces [10].
3. Two-dimensionally organized molecular architectures can be used to simplify the
complexities of three-dimensional solutions and allow surface forces measurement. By
1
www.pdfgrip.com
2
Kurihara
employing this approach, we can study complex systems such as polypeptides and
polyelectrolytes in solutions. For example, it is possible to obtain essential information
such as the length and the compressibility of these polymers in solutions by systematically varying their chemical structures and the solution conditions [11].
Earlier studies of surface forces measurement were concerned mainly with surface
interactions determining the colloidal stability, including surfactant assemblies. It has
been demonstrated, however, that a “force–distance” curve can provide much richer information on surface molecules; thus it should be utilized for studying a wider range of
phenomena [12]. Practically, the preparation of well-defined surfaces, mostly modified
by two-dimensional organized molecules, and the characterization of the surfaces by
complementary techniques are keys to this approach. A similar concept is “force spectroscopy” [13], coined to address force as a new parameter for monitoring the properties
of materials. A major interest in force spectroscopy is the single molecular measurement
generally employing an atomic force microscope. This measurement treats relatively
strong forces, such as adhesion, and discusses the binding of biotin-streptavidin [14] and
complementary strands of DNA [15] as well as the unfolding and folding of proteins
[16]. On the other hand, the forces measurement of two-dimensionally organized
molecules has advantages complementary to those of single molecule force spectroscopy.
It can monitor many molecules at the same time and thus is better suited for studying
long-range weaker forces. The measurement should bear a close relevance to real systems
that consist of many molecules, because interactions between multiple molecules and/or
macroscopic surfaces in solvents may exhibit characteristics different from those between
single molecules.
The aim of this review is to demonstrate the potential of surface forces measurement
as a novel means for investigating surfaces and complex soft systems by describing our recent studies, which include cluster formation of alcohol, polyion adsorption, and polyelectrolyte brushes.
II. SURFACE FORCES MEASUREMENT
Surface forces measurement directly determines interaction forces between two surfaces as
a function of the surface separation (D) using a simple spring balance. Instruments employed are a surface forces apparatus (SFA), developed by Israelachivili and Tabor [17],
and a colloidal probe atomic force microscope introduced by Ducker et al. [18] (Fig. 1). The
former utilizes crossed cylinder geometry, and the latter uses the sphere-plate geometry.
For both geometries, the measured force (F) normalized by the mean radius (R) of cylinders or a sphere, F/R, is known to be proportional to the interaction energy, Gƒ, between
flat plates (Derjaguin approximation),
F
ᎏᎏ ϭ 2Gƒ
R
(1)
This enables us to quantitatively evaluate the measured forces, e.g., by comparing them
with a theoretical model.
Sample surfaces are atomically smooth surfaces of cleaved mica sheets for SFA, and
various colloidal spheres and plates for a colloidal probe AFM. These surfaces can be modified using various chemical modification techniques, such as Langmuir–Blodgett (LB) deposition [12,19] and silanization reactions [20,21]. For more detailed information, see the
original papers and references texts.
www.pdfgrip.com
Surface Forces Measurement
3
FIG. 1 Schematic drawings of (a) the surface forces apparatus and (b) the colloidal probe atomic
force microscope.
III. ALCOHOL CLUSTER FORMATION ON SILICA SURFACES
IN CYCLOHEXANE
Surface forces measurement is a unique tool for surface characterization. It can directly
monitor the distance (D) dependence of surface properties, which is difficult to obtain by
other techniques. One of the simplest examples is the case of the electric double-layer force.
The repulsion observed between charged surfaces describes the counterion distribution in
the vicinity of surfaces and is known as the electric double-layer force (repulsion). In a similar manner, we should be able to study various, more complex surface phenomena and obtain new insight into them. Indeed, based on observation by surface forces measurement
and Fourier transform infrared (FTIR) spectroscopy, we have found the formation of a
novel molecular architecture, an alcohol macrocluster, at the solid–liquid interface.
Adsorption phenomena from solutions onto solid surfaces have been one of the important subjects in colloid and surface chemistry. Sophisticated application of adsorption
has been demonstrated recently in the formation of self-assembling monolayers and multilayers on various substrates [4,7]. However, only a limited number of researchers have
been devoted to the study of adsorption in binary liquid systems. The adsorption isotherm
and colloidal stability measurement have been the main tools for these studies. The molecular level of characterization is needed to elucidate the phenomenon. We have employed
the combination of surface forces measurement and Fourier transform infrared spectroscopy in attenuated total reflection (FTIR-ATR) to study the preferential (selective) adsorption of alcohol (methanol, ethanol, and propanol) onto glass surfaces from their binary
mixtures with cyclohexane. Our studies have demonstrated the cluster formation of alcohol adsorbed on the surfaces and the long-range attraction associated with such adsorption.
We may call these clusters macroclusters, because the thickness of the adsorbed alcohol
layer is about 15 nm, which is quite large compared to the size of the alcohol. The following describes the results for the ethanol–cycohexane mixtures [10].
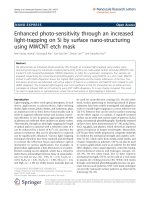
Typical forces profiles measured between glass surfaces in ethanol–cyclohexane
mixtures are shown in Fig. 2. Colloidal probe atomic force microscopy has been employed.
In pure cyclohexane, the observed force agrees well with the conventional van der Waals
attraction calculated with the nonretarded Hamaker constant for glass/cyclohexane/glass,
www.pdfgrip.com
4
Kurihara
3.1 ϫ 10Ϫ21 J. At an ethanol concentration of 0.1 mol%, the interaction changes remarkably: The long-range attraction appears at a distance of 35 nm, shows a maximum around
10 nm, and turns into repulsion at distances shorter than 5 nm. The pull-off force of the contacting surfaces is 140 Ϯ 19 mN/m, which is much higher than that in pure cyclohexane,
10 Ϯ 7 mN/m. Similar force profiles have been obtained on increasing the ethanol concentration to 0.4 mol%. A further increase in the concentration results in a decrease in the
long-range attraction. At an ethanol concentration of 1.4 mol%, the interaction becomes
identical to that in pure cyclohexane. When the ethanol concentration is increased, the
range where the long-range attraction extends changes in parallel to the value of the pulloff force, indicating that both forces are associated with the identical phenomenon, most
likely the adsorption of ethanol. Separation force profiles after the surfaces are in contact
shows the presence of a concentrated ethanol layer near and on the surfaces (see Ref. 10a).
The short-range repulsion is ascribable to steric force due to structure formation of ethanol
molecules adjacent to the glass surfaces.
In order to understand the conditions better, we determined the adsorption isotherm
by measuring the concentration changes in the alcohol upon adsorption onto glass particles
using a differential refractometer. Figure 3 plots the range of the attraction vs. the ethanol
concentration, together with the apparent adsorption layer thickness estimated from the adsorption isotherm, assuming that only ethanol is present in the adsorption layer [22]. For
0.1 mol% ethanol, half the distance where the long-range attraction appears, 18 Ϯ 2 nm, is
close to the apparent layer thickness of the adsorbed ethanol, 13 Ϯ 1 nm. This supports our
interpretation that the attraction is caused by contact of opposed ethanol adsorption layers.
Half the attraction range is constant up to ~0.4 mol% ethanol and decreases with increasing ethanol concentration, while the apparent adsorption layer thickness remains constant
at all concentration ranges studied. The discrepancy between the two quantities indicates a
change in the structure of the ethanol adsorption layer at concentrations higher than ~0.4
FIG. 2 Interaction forces between glass surfaces upon compression in ethanol–cyclohexane mixtures. The dashed and solid lines represent the van der Waals force calculated using the nonretarded
Hamarker constants of 3 ϫ 10Ϫ21 J for glass/cyclohexane/glass and 6 ϫ 10Ϫ21 J for glass/ethanol
glass, respectively.
www.pdfgrip.com
Surface Forces Measurement
5
FIG. 3 Plots of half the range of attraction (see Fig. 2) and the apparent thickness of the ethanol adsorption layer vs. the ethanol concentration.
mol%. The structures of the adsorbed ethanol turned out to be hydrogen-bonded clusters,
via the study employing FTIR-ATR spectroscopy.
FTIR-ATR spectra were recorded on a Perkin Elmer FTIR system 2000 using a TGS
detector and the ATR attachment from Grasby Specac. The ATR prism made of an oxidized silicon crystal was used as a solid adsorbent surface because of its similarity to glass
surfaces. Immediately prior to each experiment, the silicon crystal was treated with water
vapor plasma in order to ensure the formation of silanol groups on the surfaces. Obtained
spectra have been examined by referring to well-established, general spectral characteristics of hydrogen-bonded alcohols in the fundamental OH stretching region, because ethanol
is known to form hydrogen-bonded dimers and polymers (clusters) in nonpolar liquids [23].
We have also experimentally examined hydrogen-bonded ethanol cluster formation in bulk
cyclohexane–ethanol mixtures using transmission infrared spectroscopy.
FTIR-ATR spectra of ethanol in cyclohexane at various ethanol concentrations
(0.0–3.0 mol%) are presented in Figure 4. At 0.1 mol% ethanol, a narrow negative band at
3680 cmϪ1, a weak absorption at 3640 cmϪ1 (free OH), and a broad strong absorption
(3600–3000 cmϪ1) with shoulders at 3530 cmϪ1 (cyclic dimer or donor end OH), 3450, and
3180 cmϪ1 are observed. It is known that the isolated silanol group exhibits an absorption
band at 3675–3690 cmϪ1 in a nonpolar liquid, e.g., CCl4 and when the silanol groups hydrogen bond with esters, the absorption band shifts to a lower wavenumber (3425–3440
cmϪ1) [24]. Thus, the negative absorption at 3680 cmϪ1 and the positive shoulder at 3450
cmϪ1 should correspond to the decrease in the isolated silanol groups and the appearance
of the silanol groups hydrogen bonded with the adsorbed ethanol, respectively. The strong
broad band ascribed to the polymer OH appeared at 3600–3000 cmϪ1 together with the relatively weak monomer OH band at 3640 cmϪ1. This demonstrated the cluster formation of
ethanol adsorbed on the silicon oxide surface even at 0.1 mol% ethanol, where no polymer
peak appeared in the spectrum of the bulk solution at 0.1 mol% ethanol. With increasing
ethanol concentration, the free monomer OH (3640 cmϪ1) and the polymer OH peak (3330
cmϪ1) increased, while the peaks at 3530, 3450, and 3180 cmϪ1 remained the same.
www.pdfgrip.com
6
Kurihara
FIG. 4 FTIR-ATR spectra of ethanol on a silicon oxide surface in ethanol–cyclohexane binary liquids at various ethanol concentrations: 0.0, 0.1, 0.3, 0.5, 1.0, and 2.0 mol%.
At higher ethanol concentrations, ATR spectra should contain the contribution from
bulk species, because of the long penetration depth of the evanescent wave, 250 nm. To examine the bulk contribution, the integrated peak intensities of polymer OH peaks of transmission (ATS) and ATR (AATR) spectra are plotted as a function of the ethanol concentration
in Figure 5. The former monitors cluster formation in the bulk liquid, and the latter contains
contributions of clusters both on the surface and in the bulk. A sharp increase is seen in AATR
FIG. 5 Plots of integrated peak intensities of polymer OH (3600–3000 cmϪ1) as a function of the
ethanol concentration. Filled circles represent the value obtained from the transmission spectra (ATS),
while filled squares represent those from ATR (AATR).
www.pdfgrip.com
Surface Forces Measurement
7
FIG. 6 Plausible structure of the adsorption layer composed of ethanol clusters.
even at 0.1 mol% ethanol, but no significant increase is seen in ATS at ethanol concentrations lower than 0.5 mol%. A comparison of ATS and AATR clearly indicated that ethanol
clusters formed locally on the surface at concentrations of ethanol lower than ~0.5 mol%,
where practically only a negligible number of clusters exist in the bulk. The thick adsorption layer of ethanol most likely consists of ethanol clusters formed through hydrogen
bonding of surface silanol groups and ethanol as well as those between ethanol molecules.
A plausible structure of the ethanol adsorption layer is presented in Figure 6.
The contact of adsorbed ethanol layers should bring about the long-range attraction
observed between glass surfaces in ethanol–cyclohexane mixtures. The attraction starts to
decrease at ~0.5 mol% ethanol, where ethanol starts to form clusters in the bulk phase. It is
conceivable that the cluster formation in the bulk influences the structure of the adsorbed alcohol cluster layer, thus modulating the attraction. We think that the decrease in the attraction is due to the exchange of alcohol molecules between the surface and the bulk clusters.
A similar long-range attraction associated with cluster formation has been found for
cyclohexane–carboxylic acid mixtures and is under active investigation in our laboratory.
Such knowledge should be important for understanding various surface-treatment processes performed in solvent mixtures and for designing new materials with the use of
molecular assembling at the solid–liquid interfaces. For the latter, we have prepared polymer thin films by in situ polymerization of acrylic acid preferentially adsorbed on glass surfaces [25].
IV. ADSORPTION OF POLYELECTROLYTES ONTO
OPPOSITELY CHARGED SURFACES
The process of adsorption of polyelectrolytes on solid surfaces has been intensively studied because of its importance in technology, including steric stabilization of colloid particles [3,4]. This process has attracted increasing attention because of the recently developed,
sophisticated use of polyelectrolyte adsorption: alternate layer-by-layer adsorption [7] and
stabilization of surfactant monolayers at the air–water interface [26]. Surface forces measurement has been performed to study the adsorption process of a negatively charged polymer, poly(styrene sulfonate) (PSS), on a cationic monolayer of fluorocarbon ammonium
amphiphille 1 (Fig. 7) [27].
A force–distance curve between layers of the ammonium amphiphiles in water is
shown in Figure 8. The interaction is repulsive and is attributed to the electric double-layer
www.pdfgrip.com
8
Kurihara
FIG. 7 Chemical structures of fluorocarbon ammonium amphiphile 1 and poly(styrene sulfonate)
(PSS).
force. The addition of 0.7 mg/L PSS (1.4 ϫ 10Ϫ9 M, equivalent to the addition of 0.7 nmol
of PSS, which is close to the amount of the amphiphile on the surface) into the aqueous
phase drastically alters the interaction. Here, the molecular weight (Mw) of PSS is 5 ϫ 105.
Over the whole range of separations from 5 to 100 nm, the force decreases more than one
order of magnitude and does not exceed 100 N/m. The analysis of the force profile has
shown that more than 99% of the initial surface charges are shielded by PSAS binding. The
FIG. 8 Force–distance dependence for surfaces covered with fluorocarbon amphiphile 1 in pure
water (1) and in aqueous solutions containing 0.7 mg/L poly (styrenesulfonate) (2) and 7.0 g/L poly
(styrenesulfonate) (3). The molecular weight of the polymer is 5 ϫ 105. Lines are drawn as a visual
guide.
www.pdfgrip.com
Surface Forces Measurement
9
FIG. 9 Schematic illustration of adsorption of poly(styrenesulfonate) on an oppositely charged surface. For an amphiphile surface in pure water or in simple electrolyte solutions, dissociation of
charged groups leads to buildup of a classical double layer. (a) In the initial stage of adsorption, the
polymer forms stoichiometric ion pairs and the layer becomes electroneutral. (b) At higher polyion
concentrations, a process of restructuring of the adsorbed polymer builds a new double layer by additional binding of the polymer.
thickness of the adsorbed layer of PSS is in the range of 1.5–2.5 nm (it is less than 1 nm in
the case of PSS of 1 ϫ 104 Mw). These data indicate flat and stoichiometric adsorption of
the polyelectrolytes onto the monolayer surface (Fig. 9a).
Increased concentration of PSS at 7.0 g/L (1.4 ϫ 10Ϫ5 M) leads to an increase in the
force to value seven higher than that between the surfaces of fluorocarbon monolayers
alone. The origin of this force is electrostatic in nature. Recharging of the surface by additional adsorption of PSS should occur as shown in Figure 9b.
Our results demonstrate well the complexities of polyelectrolyte adsorption and provide a basis for various surface treatments utilizing polyelectrolytes. They especially afford
physical-chemical support for alternate layer-by-layer film formation of polyelectrolytes,
which is becoming a standard tool for building composite polymer nano-films in advanced
materials science.
V. POLYPEPTIDE AND POLYELECTROLYTE BRUSHES
Polypeptides and polyelectrolytes are essential classes of substances because of their importance in such areas as advanced materials science (functionalized gel) and biology (proteins, living cells, and DNA). Being polymers with charges and counterions and/or hydrogen bonding, they exhibit interesting, albeit complicated, properties. Two-dimensionally
organized brush structures of polymers can simplify the complexities of the polyelectrolyte
solutions. Attempts to investigate polyelectrolyte brushes have been carried out experimentally [11,28–32] and theoretically [33,34]. Direct measurement of surface forces has
been proven useful in obtaining information about the concrete structures of polypeptide
and polyelectrolyte brush layers. Taking advantage of the LB method, we prepared welldefined brush layers of chain-end-anchored polypeptides and polyelectrolytes [11,28–30].
www.pdfgrip.com
10
Kurihara
We then investigated them based on the force profiles, together with FTIR spectra and surface pressure–area isotherms by systematically varying the polymer chain length, chemical
structure, brush density, and solution conditions (pH, salt concentrations, etc). When the
surfaces of the opposed polymer layers approach to a separation distance of molecular dimensions, the steric repulsion becomes predominant and hence measurable. By analyzing
them, it is possible to obtain key parameters, such as thickness (length) and compressibility of polyelectrolyte layers, which are difficult to obtain by other methods, and to correlate them with polymer structures. Obtained information should form a basis for elucidating their properties and developing physical models. Moreover, it is more likely to discover
new phenomena via a novel approach: We have found the density-dependent transition of
polyelectrolyte brushes, which we have accounted for in terms of the change in the binding
modes of counterions to polyelectrolytes [30].
A. Brush Layers of Poly(glutamic acid) and Poly(lysine)
Polypeptides form various secondary structures (␣-helix, -sheet, etc.), depending on solution pHs. We have investigated end-anchored poly(L-glutamic acid) and poly(L-lysine) in
various secondary structures [11,29,35,36], using the analytical method for the steric force
FIG. 10 Schematic drawing of surface forces measurement on charged polypeptide brushes prepared by LB deposition of amphiphiles 2 and 3.
www.pdfgrip.com
Surface Forces Measurement
11
FIG. 11 Force profiles between poly(glutamic acid), 2C18PLGA(44), brushes in water (a) at pH
ϭ 3.0 (HNO3), (b) at pH 10 (KOH) 1/ represents the decay length of the double-layer force. The
brush layers were deposited at ϭ 40 mN/m from the water subphase at pH ϭ 3.0 and 10, respectively.
in order to examine more quantitatively the structures and structural changes in polyelectrolyte layers. The elastic compressibility modulus of polypeptide brushes was obtained, to
our knowledge, as the first quantitative determination of the mechanical modulus of an oriented, monomolecular polymer layer in solvents.
Poly(L-glutamic acid) and poly(L-lysine) brush layers were prepared using amphiphiles 2 and 3 carrying the poly(L-glutamic acid) (2C18PLGA(n), degree of polymerization, n ϭ 21, 44, 48) and the ply(L-lysine) segment (2C18PLL(n), n ϭ 41), respectively
(Fig. 10). They formed a stable monolayer at the air–water interface in which different secondary structures, such as ␣-helix and -structures, were formed through intra- and intermolecular hydrogen bonding, depending on surface pressure and subphase pH. They were
deposited onto mica surfaces and subjected to surface forces measurement. We used FTIR
spectroscopy to study the formation and orientation of their secondary structures.
Figure 11a shows a force–distance profile measured for poly(L-glutamic acid) brushes
(2C18PLGA(44)) in water (pH ϭ 3.0, 10Ϫ3 M HNO3) deposited at 40 mN/m from the water subphase at pH ϭ 3.0. The majority of peptides are in the forms of an ␣-helix (38% determined from the amide I band) and a random coil. Two major regions are clearly seen in
www.pdfgrip.com
12
Kurihara
the force–distance profiles. At surface separations longer than 35 nm, the interaction is a typical double-layer electrostatic force, with a decay length of 10 Ϯ 1 nm, which agrees well
with the Debye length (9.6 nm) for 10Ϫ3 M HNO3, due to ionized carboxyl groups. At separations shorter than ~20 nm, the repulsion is steric in origin and varies depending on the
secondary structures existing in the surface layer. In order to examine detailed changes in
the interactions, a force–distance profile is converted to a stress–distance (P-D) profile by
differentiating the free energy of interaction Gƒ [Eq. (1)] between two flat surfaces as
ᎏdDᎏ
dGf
1
P ϭ Ϫ ᎏᎏ ϭ Ϫ ᎏᎏ
dD
2
d(F/R)
(2)
The stress curve sharply increases when the steric component appears upon compression.
The initial thickness of a deformed layer is equal to be half the distance D0 obtained by extrapolating the sharpest initial increase to stress zero. The value D0 is 21 Ϯ 1 nm, which is
close the thickness of two molecular layers (19.2 nm) of the ␣-helix brush, calculated using the CPK model and the orientation angles obtained by FTIR analysis. We have calculated the elastic compressibility modulus Y,
dP
Y ϭ Ϫ ᎏᎏ
dD/D0
(3)
to be 38 Ϯ 8 MPa from the steepest slope of the stress–distance curve. This value is one to
two orders of magnitude larger than the elasticity measured for a typical rubber (1 MPa).
Figure 11b shows a profile at pH 10, measured between the 2C18PLGA(44) LB surfaces prepared at 40 mN/m from the aqueous KOH subphase (pH 10). In this sample, twothirds of the carboxylic acid groups dissociate; therefore, it behaves as a simple polyelectrolyte. The initial thickness of the deformed layer is 35 Ϯ 2 nm, which is close to twice the
length of 2C18PLGA(44) in the extended form, 37 nm. The elastic compressibility modulus is 0.2 Ϯ 0.1, which is even smaller than the value for a typical rubber. Unexpectedly,
the ionized layers are easily compressed. Counterion binding to the ionized chain should
play an important role in decreasing the stress for compression by reducing the effective
charges through the shielding and charge-recombination mechanisms.
Similar measurements have been done on poly(L-lysine) brushes. Table 1 lists a part
of our data, which display specific features: (1) The value D0 depends on the polymer chain
TABLE 1 Effective Length and Compressibility Modulus of Polypeptide Brushes Determined
by SFA in Water
Peptide
pH
␣-Helix content
R␣ (%)
D0
(nm)
Compressibility modulus, Y
(MPa)
PLL (n ϭ 41)
(ionized chain)
10
11
12
4
3
5.6
10
9.6
34
47
54
0
38
32
0
0
16 Ϯ 1
19 Ϯ 1
14 Ϯ 1
32 Ϯ 1
21 Ϯ 1
22 Ϯ 1
35 Ϯ 2
25 Ϯ 2
1.2 Ϯ 0.6
3.1 Ϯ 0.8
3.3 Ϯ 0.8
0.14 Ϯ 0.05
38 Ϯ 8
22 Ϯ 5
0.2 Ϯ 0.1
0.2 Ϯ 0.1
PLGA (n ϭ 44)
(ionized chain)
PLGA (n ϭ 21)
(ionized chain)
The length D0 corresponds to twice the thickness of the brush layers.
www.pdfgrip.com