Tài liệu Báo cáo khoa học: Cytochrome b559 content in isolated photosystem II reaction center preparations docx
Bạn đang xem bản rút gọn của tài liệu. Xem và tải ngay bản đầy đủ của tài liệu tại đây (159.81 KB, 6 trang )
Cytochrome
b
559
content in isolated photosystem II
reaction center preparations
Inmaculada Yruela
1
, Francisca Miota
1
, Elena Torrado
1
, Michael Seibert
2
and Rafael Picorel
1
1
Estacio
´
n Experimental de Aula Dei (CSIC), Zaragoza, Spain;
2
National Renewable Energy Laboratory, Basic Sciences Center,
Golden, CO, USA
The cytochrome b
559
content was examined in five types
of isolated photosystem II D1-D2-cytochrome b
559
reaction
center preparations containing either five or six chlorophylls
per reaction center. The reaction center complexes were
obtained following isolation procedures that differed in
chromatographic column material, washing buffer compo-
sition and detergent concentration. Two different types of
cytochrome b
559
assays were performed. The absolute heme
content in each preparation was obtained using the oxidized-
minus-reduced difference extinction coefficient of cyto-
chrome b
559
at 559 nm. The relative amount of D1 and
cytochrome b
559
a-subunit polypeptide was also calculated
for each preparation from immunoblots obtained using
antibodies raised against the two polypeptides. The results
indicate that the cytochrome b
559
heme content in photo-
system II reaction center complexes can vary with the
isolation procedure, but the variation of the cytochrome b
559
a-subunit/D1 polypeptide ratio was even greater. This
variation was not found in the PSII-enriched membrane
fragments used as the RC-isolation starting material, as
different batches of membranes obtained from spinach
harvested at different seasons of the year or those from sugar
beets grown in a chamber under controlled environmental
conditions lack variation in their a-subunit/D1 polypeptide
ratio. A precise determination of the ratio using an
RC1-control sample calibration curve gave a ratio of 1.25
cytochrome b
559
a-subunit per 1.0 D1 polypeptide in photo-
system II membranes. We conclude that the variations
found in the reaction center preparations were due to the
different procedures used to isolate and purify the different
reaction center complexes.
Keywords: chromatography; cytochrome b
559
; detergent;
immunoblot; photosystem II.
Cytochrome (Cyt) b
559
is a hemoprotein component of the
photosystem II (PSII) reaction center (RC) complex [1], and
it is an integral component of the minimal isolated RC
complex still capable of performing primary charge separ-
ation. It is composed of two small polypeptides, the a
(9 kDa) and b (4.5 kDa) subunits, encoded by the psbE and
psbF genes, respectively. Each polypeptide has a single
transmembrane a-helical domain [2,3]. The heme iron is
bound to a single histidine residue on each subunit [4], and it
is located close to the stromal surface of the membrane
[2,3,5–7]. However, a location for Cyt b
559
heme on the
lumenal side of the PSII membrane has also been proposed,
suggesting that two hemes and two copies each of the two
subunits are present in the thylakoid membrane [8,9].
Despite numerous studies [8,10,11], the exact function of
Cyt b
559
is still unclear but the following are possibilities: (a)
involvement in the electron transfer reactions on the
oxidizing side of PSII [12,13]; (b) participation in the
assembly of the water-splitting system [14]; and (c) protec-
tion of PSII against photoinhibition [15–19]. It is well
known that Cyt b
559
can exist in a number of different redox
forms. At pH 6.0–6.5, PSII complexes, surrounded by their
natural membrane environments, as in chloroplasts, thyla-
koids and PSII membrane fragments, Cyt b
559
exhibits
midpoint redox potentials (E¢
m
)of+400mV[thehigh
potential (HP) form], +200–150 mV [the intermediate
potential (IP) form], and +70–60 mV [the low potential
(LP) form] [1,20–22]. The HP form dominates in thyla-
koids and PSII membranes with an intact water-oxidizing
complex.
A longstanding issue has been the number of Cyt b
559
per
PSII complex. Shuvalov and coworkers argued that PSII
core complex from spinach with high O
2
-evolution activity
contains two Cyt b
559
per PSII [8]. However, the currently
accepted value in isolated PSII RCs, based mainly on
absorption spectroscopy techniques [1,23–26], is one heme
per RC. Recent data based on the crystal structure of the
PSII core from Synecochoccus elongatus [2] and Thermo-
synechococcus vulcanus [3] are in agreement with this
proposal. But a second cytochrome might have been lost
during the preparation of the core material. Thus the
question of one or two Cyt b
559
per PSII RC remains
unresolved because the stoichiometry might depend on the
isolation procedure used, the type of PSII preparation and/
or the organism examined.
Correspondence to R. Picorel, Estacio
´
n Experimental de Aula Dei
(CSIC), Ctra. Montan
˜
ana 1005, Zaragoza E-50080, Spain.
Fax: + 34 976 716145; Tel.: + 34 976 716053;
E-mail:
Abbreviations: Cyt, cytochrome; D1/D2 HD, heterodimer made by
crosslinking of D1 and D2 polypeptides; DM, n-dodecyl b-
D
-malto-
side; HP, high potential; IMAC, immobilized metal affinity chroma-
tography; IP, intermidiate potential; LP, low potential; Mes,
2-(N-morpholino) ethane-sulfonic acid; PS, photosystem;
RC, reaction center.
Enzymes: glucose oxidase (EC 1.1.3.4); catalase (EC 1.11.1.6).
(Received 23 January 2003, revised 21 March 2003,
accepted 26 March 2003)
Eur. J. Biochem. 270, 2268–2273 (2003) Ó FEBS 2003 doi:10.1046/j.1432-1033.2003.03597.x
To address this issue, we have determined the D1 and
Cyt b
559
contents of various PSII RC preparations obtained
from market spinach and chamber-grown sugar beets. The
cytochrome content was assayed by both spectrophoto-
metric and immunological methods. The former measures
the heme content and the latter quantitates the amount of
protein present. Note that it is not the aim of this work to
define the quality or performance of the different RC
preparations, but rather to examine the effect of several
isolation procedures on the Cyt b
559
content of these
preparations. The results presented in this work strongly
suggest that the Cyt b
559
heme content and Cyt b
559
a-subunit/D1 ratio are highly dependent on the RC
isolation procedure used; this ratio is close to one in all
PSII-enriched membranes tested.
Materials and methods
Biological material
Sugar beet (Beta vulgaris L. cv. Monohill) was grown
hydroponically in a growth chamber on half-Hoagland
solution, under the following conditions: 325 lEinsteinsÆ
m
)2
Æs
)1
cool fluorescent light (16 h light period), 25 °C, and
80% humidity. Spinach was purchased from the local
market at different times during the year.
Preparation of PSII membranes
PSII-enriched membrane fragments were isolated according
to [27] with some modifications [25]. Samples were suspen-
ded in 0.4
M
sucrose, 15 m
M
NaCl, 5 m
M
MgCl
2
and
50 m
M
2-(N-morpholino) ethane-sulfonic acid (Mes)/
NaOH (pH 6.0), frozen in liquid nitrogen and stored at
)80 °C until use.
Preparation of D1-D2-Cyt
b
559
complexes
Four RC preparations with about six chlorophyll (Chl) a per
two pheophytins (Pheo) and one preparation with about five
Chl per two Pheo were isolated from PSII-enriched mem-
brane fragments using modifications to the standard proce-
dure [23]. This method solubilizes PSII-enriched membranes
at1mgChlÆmL
)1
with 4% (w/v) Triton X-100 for 1 h. After
centrifugation the resultant supernatant is loaded onto a
weak anion-exchange Toyopearl TSK DEAE-650(S) col-
umn pre-equilibrated with 50 m
M
Tris/HCl (pH 7.2) and
0.05% (w/v) Triton X-100 buffer. The column was washed
extensively with the same buffer until the optical density of
the 417 nm peak (main Soret Pheo peak) was much higher
than that at 435 nm (main Soret Chl a peak). The material
was then eluted with a 50–200 m
M
NaCl linear gradient in
the same buffer. Hereafter, we will call this preparation RC1
and consider it the standard control material. Variations of
this procedure were performed as follows: RC2-Strong
anion-exchange Q-Sepharose Fast-Flow column and 0.1%
(w/v) Triton X-100 in 50 m
M
Mes/NaOH (pH 6.5) washing
buffer [28]; RC3-Toyopearl TSK DEAE-650(S) column and
1% (w/v) Triton X-100 and 1.5% (w/v) taurine in 50 m
M
Tris/HCl (pH 7.2) washing buffer [29]; and RC4-Toyopearl
TSK DEAE-650(S) column and 1% (w/v) Triton X-100 in
50 m
M
Tris/HCl washing buffer [30]. In each case, after
detergent exchange with 0.1% (w/v) n-dodecyl-b-
D
-malto-
side (DM) to stabilize the RC [31], the RC complexes were
eluted with a 60–300 m
M
linear salt gradient in 50 m
M
Mes/
NaOH (pH 6.5) and 0.1% (w/v) DM, and the fractions were
collected at 1 mLÆmin
)1
. In some cases, the preparations
obtained as indicated above were exposed to an additional
chromatography step using a copper immobilized metal
affinity chromatographic [Cu(II)-IMAC] column. To pre-
pare the Cu(II)-IMAC column, 100 mL of 0.1
M
CuSO
4
in
distilled water were passed through a Chelating-Sepharose
Fast-Flow column (Amersham-Pharmacia, 1 · 10 cm).
Excess copper was eliminated by washing with 100 mL
distilled water. The column was equilibrated with 50 mL of
50 m
M
Na
2
HPO
4
(pH 6.5), 50 m
M
NaCl, 0.2% (w/v) Triton
X-100 and 1.2 m
M
DM. Then the RC samples were diluted
sixfold in 50 m
M
Mes/NaOH (pH 6.5), loaded onto the
Cu(II)-IMAC column and washed with 50 m
M
Mes/NaOH
(pH 6.5), 50 m
M
NaCl, 0.2% (w/v) Triton X-100 and
1.2 m
M
DM buffer. The samples were then eluted with
1–10 m
M
imidazole linear gradient in 50 m
M
Mes/NaOH
(pH 6.5) and 0.1% (w/v) DM. RC5, a preparation contain-
ing about five Chl per two Pheo, was isolated from PSII-
enriched membranes following the method described in [32]
using the Cu(II)-IMAC column described above. All the
isolation steps were done at 4 °C in the dark. The pigment
composition of the isolated RC complexes was determined
as described in [33].
Spectroscopy
The RC Cyt b
559
heme content was measured spectro-
photometrically. To measure the dithionite-reduced minus
ferricyanide-oxidized absorption spectra in the 510–
600 nm region, the RC samples were diluted to an optical
density of 0.6–1.2 absorption units at the red maximum
peak at around 675.5 nm with a buffer containing 50 m
M
Mes/NaOH (pH 6.5) and 0.1% (w/v) DM (this buffer yields
more transparent D1-D2-Cyt b
559
complex suspensions
than Tris/HCl buffers at higher pH). A differential extinc-
tion coefficient of 21 m
M
)1
Æcm
)1
at the maximun at 559 nm
minus the minimum at around 570 nm [1] was used to
determine the heme content of the different preparations.
Difference absorption spectra were recorded using 1 cm
optical pathlength cuvettes at 10 °CwithaBeckmanDU
640 spectrophotometer. Constant temperature was main-
tained using a circulating bath (MultiTempII, Amersham-
Pharmacia). Samples were oxidized with 2 m
M
ferricyanide
and then reduced by adding 1 lL of a saturated solution of
sodium dithionite prepared in 10 m
M
Tris/HCl, pH 7.5 (at
this pH the dithionite is more stable than at lower pH) and
maintained in an ice-pocket. The addition of another lLof
saturated solution did not further increase the absorption at
559 nm, demonstrating that the Cyt b
559
content was
completely reduced with the first dithionite addition. It
should be noticed that the same results were obtained
without the addition of ferricyanide because the Cyt b
559
from D1-D2-Cyt b
559
complex preparations as obtained
from the chromatography column is always in the oxidized
state. All of the measurements were carried out under
anaerobic conditions maintained by adding 0.23 mgÆmL
)1
glucose oxidase (Sigma, EC 1.1.3.4), 80 lgÆmL
)1
catalase
(Sigma, EC 1.11.1.6) and 10 m
M
glucosetothesample[31].
Ó FEBS 2003 Cytochrome content of different D1-D2-Cyt b559 complex preparations (Eur. J. Biochem. 270) 2269
SDS/PAGE and immunoblot
Electrophoresis was carried out as in [34] using a 4% (w/v)
acrylamide stacking gel and a 12–20% (w/v) acrylamide
linear gradient resolving gel containing 6
M
urea. To avoid
the interference of lipids and detergents during the electro-
phoresis, the RC samples were diluted 10-fold in 1 : 1
ethanol/acetone (v/v), incubated for 1 h at 20 °C, and
centrifuged at 9000 g for 10 min at 4 °C [35]. The pellet
containing the protein was resuspended in 50 m
M
Mes/
NaOH (pH 6.5). The samples were diluted 1 : 1 in 2% (w/v)
SDS, 2
M
urea, 40 m
M
dithiothreitol, and 50 m
M
Mes/
NaOH (pH 6.5), and then denaturated at room temperature
for50min.Replicategelswererununderthesame
conditions at the same time, and the proteins were
transferred onto nitrocellulose membranes for immuno-
detection using a Bio-Rad Mini Trans-Blot Cell. The
transfer buffer was 25 m
M
Tris/HCl (pH 7.5), 192 m
M
glycine and 20% methanol. After protein transfer, one of
the blots was probed with rabbit antibodies raised against a
synthetic peptide homologous to the N-terminus of the
spinach PSII D1 protein and the other with rabbit antibodies
raised against the spinach a-subunit of Cyt b
559
[36]. The
standard peroxidase development procedure with 4-chloro-
1-naphthol as the substrate was used to visualize the blots.
The gels and blots were scanned with a Studio Scan II Si
(AGFA), and the intensity of the bands was quantified by
densitometry using US National Institute of Health
Software (
NIH IMAGE
) available at .
Results and discussion
We examined the Cyt b
559
contentoffivedifferentD1-D2-
Cyt b
559
PSII RC preparations containing either five or six
Chl per RC. Dithionite-reduced minus ferricyanide-oxidized
absorption spectroscopy shows that the absolute Cyt b
559
heme stoichiometry varied between 0.91 and 1.41 hemes per
two Pheo (Table 1). This method is commonly used to
determine the Cyt b
559
content in PSII RC preparations [1]
and shows that heme content can vary depending on the
specific RC isolation procedure.
In RC1, the standard preparation for the purpose of this
paper, we measured slightly more than six Chl per two Pheo
(Table 1). The PSII RC is known to contain two Pheo [2,3].
RC2 contained a little less Chl (6.18) but more Cyt b
559
heme (1.11) per two Pheo compared to RC1. RC3
contained less Chl (5.80) but more Cyt b
559
heme (1.19)
than RC1 and RC2. RC4 contained 6.05 Chl and even more
Cyt b
559
heme (1.41). RC5 had about five Chl per two Pheo
as expected and 1.12 Cyt b
559
heme per two Pheo. The only
significant difference between the RC1 through the RC4
procedures was the concentration of Triton X-100 used
during RC isolation wash steps, and the presence of 1.5%
(w/v) taurine in RC3. Despite the different Cyt b
559
contents
all the preparations showed ÔnormalÕ room temperature
absorption spectra, i.e. the six Chl preparations with
maxima at 675.5 nm and the five Chl preparation with a
maximum at around 677 nm. This indicates that the
cytochrome content has nothing to do with the spectral
quality of the preparations.
In order to compare the actual Cyt b
559
protein content
of each preparation rather than the heme content as above,
we used polyclonal antibodies against D1 and the a-subunit
of Cyt b
559
to assess changes in the ratio of the polypeptide
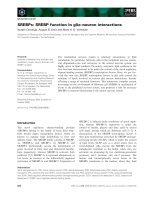
levels in the different RC preparations. Figure 1 shows
immunoblots using antibodies against the D1 polypeptide
(upper box) and the a-subunit (lower box). No D1
degradation product, little D1/D2 heterodimer and no
Cyt b
559
aggregate formation were detected in any of our
preparations. Table 2 shows the relative Cyt b
559
a-subunit/
D1 integrated densities of the two respective bands in the
blot (Fig. 1). RC1 and RC2 show similar ratios, but RC3
and especially RC4 and RC5 showed much higher ratios.
The results of Tables 1 and 2 demonstrate that increasing
the concentration of Triton X-100 during RC washing
procedure leads to a higher Cyt/D1 ratio both on a heme
and a protein basis. However, the variation of the Cyt b
559
a-subunit to D1 ratio with the detergent concentration was
more dramatic in the case of the immunoblot data (Table 2)
compared to the spectrophotometric data (Table 1). This
indicates that free a-subunit polypeptide (with no heme)
from degraded cytochrome must bind preferentially to the
column and is coeluted with the native RC complex. Note
Table 1. Pigment and cytochrome b
559
(heme) content determined spectrophotometrically for various D1-D2-Cyt b
559
PSII RC complexes purified
using different procedures, as described in Materials and methods. Values represent means ± SE (n ¼ 4). Values in parentheses represent the Triton
X-100 concentration used during the isolation washing procedure.
Variable RC1 (0.05%) RC2 (0.1%) RC3 (1%) RC4 (1%) RC5 (0.2%)
Chl a 6.41 ± 0.15 6.18 ± 0.20 5.80 ± 0.13 6.05 ± 0.21 5.12 ± 0.13
Pheo a 22222
Cyt b
559
a
0.91 ± 0.18 1.11 ± 0.13 1.19 ± 0.09 1.41 ± 0.15 1.12 ± 0.08
a
This row also represents the Cyt b
559
heme/RC ratio.
Fig. 1. Immunoblots of several isolated D1-D2-Cyt b
559
PSII RC
preparations using anti-D1 (upper box) and anti-Cyt b
559
a-subunit
(lower box) serum. Lane 1, RC1; lane 2, RC2 ; lane 3, RC3 ; lane 4,
RC4; lane 5, RC5.
2270 I. Yruela et al.(Eur. J. Biochem. 270) Ó FEBS 2003
that the difference spectroscopy employed only detects the
heme in native Cyt b
559
, but the antibody blots detect all
a-subunit polypeptide present. Taurine used to prepare
RC3 is a chaotropic agent that is sometimes used to strip off
loosely bound contaminants to give cleaner protein pre-
parations, and thus RC3 exhibits lower Cyt b
559
protein
content than RC4 (prepared the same way, but without
taurine). In the case of the IMAC procedure (RC5), the
heme content was a little higher than in RC1, but the
a-subunit/D1 ratio was even higher than that in RC4. This
result occurs despite the lower Triton X-100 concentration
used (0.2% [w/v] in RC5 compared to 1% [w/v] in RC4).
The simplest explanation for the much higher level of
a-subunit polypeptide content compared to heme content
in RC5 results from a consideration of the chemistry of the
Cu(II)-IMAC column. The Cu(II), linked to the column
matrix, binds to any available histidine residue on the
surface of a protein. As Cyt b
559
is on the surface of the
D1-D2-Cyt b
559
complex [2,3,6], the two histidines that bind
the heme are prone to be attack by Cu(II). As a consequence
the heme is displaced and washed out of the column, but the
free polypeptide subunits remain bound to the Cu(II)-
IMAC column by the histidine residues until coeluted with
the native RC complex after the application of the imidazole
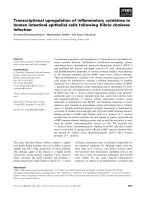
elution step. In order to examine this hypothesis, RC2 and
RC3 were passed through a Cu(II)-IMAC column, and the
results are shown in Fig. 2. Both preparations exhibit a
higher a-subunit/D1 ratio after passing through the Cu(II)-
IMAC column, i.e. the RC2 and RC3 showed a densito-
metric ratio of 1.02 and 1.32, respectively, after the column
compared to 0.62 and 1.09 before the column.
The results reported here indicate that the Cyt b
559
content in the PSII RC complex can be altered by the
purification procedure. In order to confirm that these
variations did not result from variations in Cyt b
559
content
in the starting PSII membranes, we analysed several batches
of market spinach harvested during different times of the
year and sugar beets grown under controlled environmental
conditions in a growth chamber. Figure 3 shows the blots
using antibodies against D1 (upper box) and Cyt b
559
a-subunit (lower box). All of the PSII membrane batches
had similar Cyt b
559
/D1 ratios, independent of the harvest
time of the year, growth conditions or plant species (the
spectrophotometric method also confirmed the presence of
similar concentrations of Cyt b
559
in all PSII membranes,
data not shown). The absolute Cyt b
559
/D1 ratio in the
membranes was calculated using a calibration curve gener-
ated with different amounts of RC1 control material.
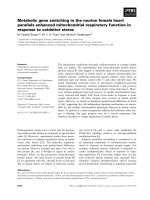
Figure 4A shows the blot from the gel containing different
amounts of RC1 control sample that was used to generate
the standard correlation curve represented in Fig. 4B. The
gel also contains a duplicate of amounts of PSII membranes
(Fig. 4A) corresponding to the Cyt b
559
and D1 content
that fits within the correlation curve. The densitometric
values obtained from the blot for the a-subunit and D1
from the membranes were introduced in the generated
calibration curve to calculate the absolute ratio of these
polypeptide content present in membranes considering that
ratio 1 : 1 in RC1 control sample. This absolute ratio
resulted in 1.25 Cyt b
559
a-subunit per D1 polypeptide.
Assuming that RC1 control sample, obtained using the
lowest Triton X-100 concentration (0.05%, w/v), contains
one Cyt per D1, we can conclude that: (a) PSII-enriched
membranes from higher plants contain a little more than
one but certainly less than two Cyt b
559
a-subunits per D1
polypeptide; (b) both the Cyt b
559
heme and a-subunit
contents of D1-D2-Cyt b
559
complex depend on the puri-
fication procedure used to obtain the preparations; (c) a
Table 2. Relative cytochrome b
559
a-subunit/D1 integrated density ratios of the Western blot bands in Fig. 1. All the ratios were normalized to the
value of RC1 (the standard control preparation) in Table 1. The absolute densitometric band ratio of RC1 was 0.81. Values represent means ± SE
(n ¼ 4).
Variable RC1 RC2 RC3 RC4 RC5
a-Subunit/D1 0.91 ± 0.12 0.84 ± 0.18 1.30 ± 0.15 2.11 ± 0.12 2.27 ± 0.21
Triton conc. (w/v) 0.05% 0.1% 1%
a
1% 0.2%
a
Contained Taurine.
Fig. 2. Immunoblots of RC2 and RC3 preparations before and after
passing through a Cu(II)-IMAC column. Lane 1, RC2; lane 2, RC2
after Cu(II)-IMAC column; lane 3, RC3; lane 4, RC3 after Cu(II)-
IMAC column.
Fig. 3. Immunoblots of PSII membrane preparations from market
spinach obtained in autumn (lane 1), winter (lane 2), spring (lane 3), and
from sugar beets (lane 4) grown in a growth chamber under controlled
environmental conditions. Upper box: immunodetection with antibody
against D1 protein; lower box: immunodetection with antibody
against Cyt b
559
a-subunit.
Ó FEBS 2003 Cytochrome content of different D1-D2-Cyt b559 complex preparations (Eur. J. Biochem. 270) 2271
high Triton X-100 concentration during the chromato-
graphic washing steps clearly increases both the heme and
the a-subunit content per RC; and (d) RC preparations
using Cu(II)-IMAC exhibit a very high a-subunit poly-
peptide compared to their heme content.
Acknowledgements
The authors thank M. V. Ramiro for her helpful technical assistance.
We are indebted to Drs A. K. Matto and R. Barbato for their kind gifts
of antibodies against the D1 and Cyt b
559
polypeptides, respectively.
E. T. was recipient of a predoctoral fellowship from the CONSI + D
(Diputacio
´
n General de Arago
´
n). This work was supported by the
Ministry of Science and Technology of Spain (Grant PB98-1632 and
BMC2002-00031) (RP) and by the Division of Energy Biosciences,
Office of Science, U.S. Department of Energy (under Contract
#DE-AC36–99G010337) (MS).
References
1. Stewart, D.H. & Brudvig, G.W. (1998) Cytochrome b559 of
photosystem II. Biochim. Biophys. Acta 1367, 63–87.
2. Zouni, A., Witt, H T., Kern, J., Fromme, P., Kraube, N., Saen-
ger, W. & Orth, P. (2001) Crystal structure of photosystem II from
Synechococcus elongatus at 3.8 A
˚
resolution. Nature 409, 739–743.
3. Kamiya, N. & Shen, J R. (2003) Crystal structure of oxygen-
evolving photosystem II from Thermosynechococcus vulcanus at
3.7 A
˚
resolution. Proc. Natl Acad. Sci. USA 100, 98–103.
4. Babcock, G.T., Widger, W.R., Cramer, W.A., Oertling, W.A. &
Metz, J.G. (1985) Axial ligands of chloroplast cytochrome b559:
identification and requirement for a heme-crosslinked polypeptide
structure. Biochemistry 24, 3638–3645.
5. Tae, G.S., Black, M.T., Cramer, W.A., Vallon, O. & Bogorad, L.
(1988) Thylakoid membrane topography: Transmembrane
orientation of the chloroplast cytochrome b559 psbE gene
product. Biochemistry 27, 9075–9080.
6. Picorel,R.,Chumanov,G.,Cotton,T.M.,Montoya,G.,Toon,S.
& Seibert, M. (1994) Surface-enhanced resonance Raman scat-
tering spectroscopy of photosystem II pigment-protein complexes.
J. Phys. Chem. 98, 6017–6022.
7. Tae, G.S. & Cramer, W.A. (1994) Topography of the heme
prosthetic group of cytochrome b559 in the photosystem II reac-
tion center. Biochemistry 33, 10060–10068.
8. Shuvalov, V.A. (1994) Composition and function of cytochrome
b559 in reaction centers of photosystem II of green plants.
J. Bioenerg. Biomembr. 26, 619–626.
9. McNamara, V.P., Sutterwala, F.S., Pakrasi, H.B. & Whitmarsh, J.
(1998) Structural model of cytochrome b
559
in photosystem two
based on a mutant with genetically fused subunits. Proc. Natl
Acad. Sci. USA 94, 14173–14178.
10. Cramer, W.A. & Whitmarsh, J. (1977) Photosynthetic cyto-
chromes. Ann. Rev. Plant Physiol. 28, 133–172.
11. Whitmarsh, J. & Pakrasi, H.B. (1996) Form and function of
cytochrome b559.InOxygenic Photosynthesis: the Light Reactions
(Ort, D.R. & Yocum, C.F., eds), pp. 249–264. Kluwer Academic
Publishers, Dordrecht, the Netherlands.
12. Knaff, D.B. & Arnon, D.I. (1969) Light-induced oxidation of a
chloroplast b-type cytochrome at )189°C. Proc. Natl Acad. Sci.
USA 63, 956–962.
13. Cox, R.P. & Bendall, D.S. (1972) The effects on cytochrome b559
HP and P546 of treatments that inhibit oxygen evolution by
chloroplasts. Biochim. Biophys. Acta. 283, 124–135.
14. Cramer, W.A., Theg, S.M. & Widger, W.R. (1986) On the struc-
ture and function of Cyt b559. Photosynth. Res. 10, 393–403.
15. Heber, U., Kork, M.R. & Boardman, N.K. (1979) Photoreactions
of cytochrome b559 and cyclic electron flow in photosystem II of
intact chloroplasts. Biochim. Biophys. Acta 546, 292–306.
16. Thompson, L.K. & Brudvig, G.W. (1988) Cytochrome b559
may function to protect photosystem II from photoinhibition.
Biochemistry 27, 6653–6658.
17. Canaani, O. & Havaux, M. (1990) Evidence for a biological role in
photosynthesis for cytochrome b559 – a component of photosys-
tem II reaction center. Proc. Natl Acad. Sci. USA 87, 9295–9299.
18. Barber, J. & De las Rivas, J. (1993) A functional model for the role
of cytochrome b559 in the protection against donor and acceptor
side photoinhibition. Proc. Natl Acad. Sci. USA 90, 10942–10946.
19. Magnuson, A., Rova. M., Mamedov, F., Fredriksson, P O. &
Styring, S. (1999) The role of cytochrome b559 and tyrosine
D
in
protection against photoinhibition during in vivo photoactivation
of Photosystem II. Biochim. Biophys. Acta 1411, 180–191.
20. Kaminskaya, O., Kurreck, J., Irrgang, K D., Renger, G. &
Shuvalov, V.A. (1999) Redox and spectral properties of cyto-
chrome b559 in different preparations of photosystem II. Bio-
chemistry 38, 16223–16235.
21. Mizusawa, N., Yamashita, T. & Miyao, M. (1999) Restoration of
the high-potential form of cytochrome b559 of photosystem II
occurs via a two-step mechanism under illumination in the pre-
sence of manganese ions. Biochim. Biophys. Acta 1410, 273–286.
22. Roncel, M., Ortega, J.M. & Losada, M. (2001) Factors
determining the special redox properties of photosynthetic
cytochrome b559. Eur. J. Biochem. 268, 4961–4968.
23. Nanba, O. & Satoh, K. (1987) Isolation of a photosystem II
reaction center consisting of D-1 and D-2 polypeptides and
cytochrome b559. Proc. Natl Acad. Sci. USA 84, 109–112.
Fig. 4. Immunoblots of different amounts of RC1-control sample to
generate the calibration curve and PSII membrane proteins. A(upper
box): immunodetection with antibody against D1 protein; A (lower
box): immunodetection with antibody against Cyt b
559
a-subunit. Left
lane: molecular mass standards; lanes 1, 2, 3, 4 and 5: increasing
amounts of RC1 complex (5–43 l
M
reaction centers); lanes 6 and 7: a
duplicate of PSII membranes whose amounts of a-subunit and D1 fit
within the calibration curve. Increasing amounts of RC1 complex were
added to obtain a calibration curve to calculate the absolute Cyt
a-subunit/D1 ratio of PSII membranes assuming a Cyt b
559
a-subunit/
D1 ratio of 1 : 1 in the RC1 control sample.
2272 I. Yruela et al.(Eur. J. Biochem. 270) Ó FEBS 2003
24. Gounaris, K., Chapman, D.J., Booth, P., Crystall, B., Giorgi,
L.B., Klug, D.R., Porter, G. & Barber, J. (1990) Comparation of
the D1–D2-Cyt b559 reaction center complex of photosystem two
isolated by different methods. FEBS Lett. 265, 88–92.
25. Montoya, G., Yruela, I. & Picorel, R. (1991) Pigment stoichio-
metry of a newly isolated D1–D2-Cyt b559 complex from the
higher plant Beta vulgaris L. FEBS Lett. 283, 255–258.
26. Buser, C.A., Diner, B.A. & Brudvig, G.W. (1992) Reevaluation of
the stoichiometry of cytochrome b559 in photosystem II and
thylakoid membranes. Biochemistry 31, 11441–11448.
27. Berthold, D.A., Babcock, G.T. & Yocum, C.F. (1981) A highly
resolved, oxygen-evolving Photosystem II preparation from spi-
nach thylakoid membranes. FEBS Lett. 134, 231–234.
28. Yruela, I., van Kan, P.J.M., Mu
¨
ller, M.G. & Holzwarth, A.R.
(1994) Characterization of a D1–D2-Cyt b559 complex containing
4 chlorophyll a/2 pheophytin a isolated with the use of MgSO
4
.
FEBS Lett. 339, 25–30.
29. Yruela, I., Torrado, E., Roncel, M. & Picorel, R. (2001) Light-
induced absorption spectra of the D1–D2-Cytochrome b559
complex of photosystem II: effect of methyl viologen concentra-
tion. Photosynth. Res. 67, 199–2001.
30. Yruela, I., Toma
´
s, R., Alfonso, M. & Picorel, R. (1999) Effect of
the pH on the absorption spectrum of the isolated D1–D2-Cyt
b559 complex of photosystem II. J. Photochem. Photobiol. B 50,
129–136.
31. McTavish, H., Picorel, R. & Seibert, M. (1989) Stabilisation of
isolated photosystem II reaction center complex in the dark and in
the light using polyethylene glycol and oxygen-scrubbing system.
Plant Physiol. 89, 452–456.
32. Vacha, F., Joseph, D.M., Durrant, J.R., Telfer, A., Klug, D.R.,
Porter, G. & Barber, J. (1995) Photochemistry and spectroscopy of
a five-chlorophyll reaction center of photosystem II isolated by
using a Cu affinity column. Proc. Natl Acad. Sci. USA 92, 2929–
2933.
33. Eijckelhoff, C. & Dekker, J.P. (1997) A routine to determine the
chlorophyll a, pheophytin a and b-carotene contents of isolated
photosystem II reaction center complexes. Photosynth. Res. 52,
69–73.
34. Laemmli, U.K. (1970) Cleavage of the structural proteins during
the assembly of the head of bacteriophage T4. Nature 227,
680–685.
35. Ortega, J.M., Roncel, M. & Losada, M. (1999) Light-induced
degradation of cytochrome b559 during photoinhibition of
photosystem II reaction center. FEBS Lett. 458, 87–92.
36. Barbato, R., de Launeto, P.P., Rigoni, F., de Martini, E. &
Giacometti, G.M. (1995) Pigment-protein complexes from the
photosynthetic membrane of the cyanobacterium Synechocystis
sp. PCC 6803. Eur J. Biochem. 234, 459–465.
Ó FEBS 2003 Cytochrome content of different D1-D2-Cyt b559 complex preparations (Eur. J. Biochem. 270) 2273